 News
News  Market Data
  Discover
Support: 888-992-3836
Copyright © 2023 InvestorsHub Inc.


Register for free to join our community of investors and share your ideas. You will also get access to streaming quotes, interactive charts, trades, portfolio, live options flow and more tools.
$PHBI Non-dilutive government deal.
You don't see these often in the OTC.
Nasdaq100 stock index, NQ commodity futures
this is tommorrows daily bar, which will close at 1600pm tomorrow. It opended this eveing at 5pm
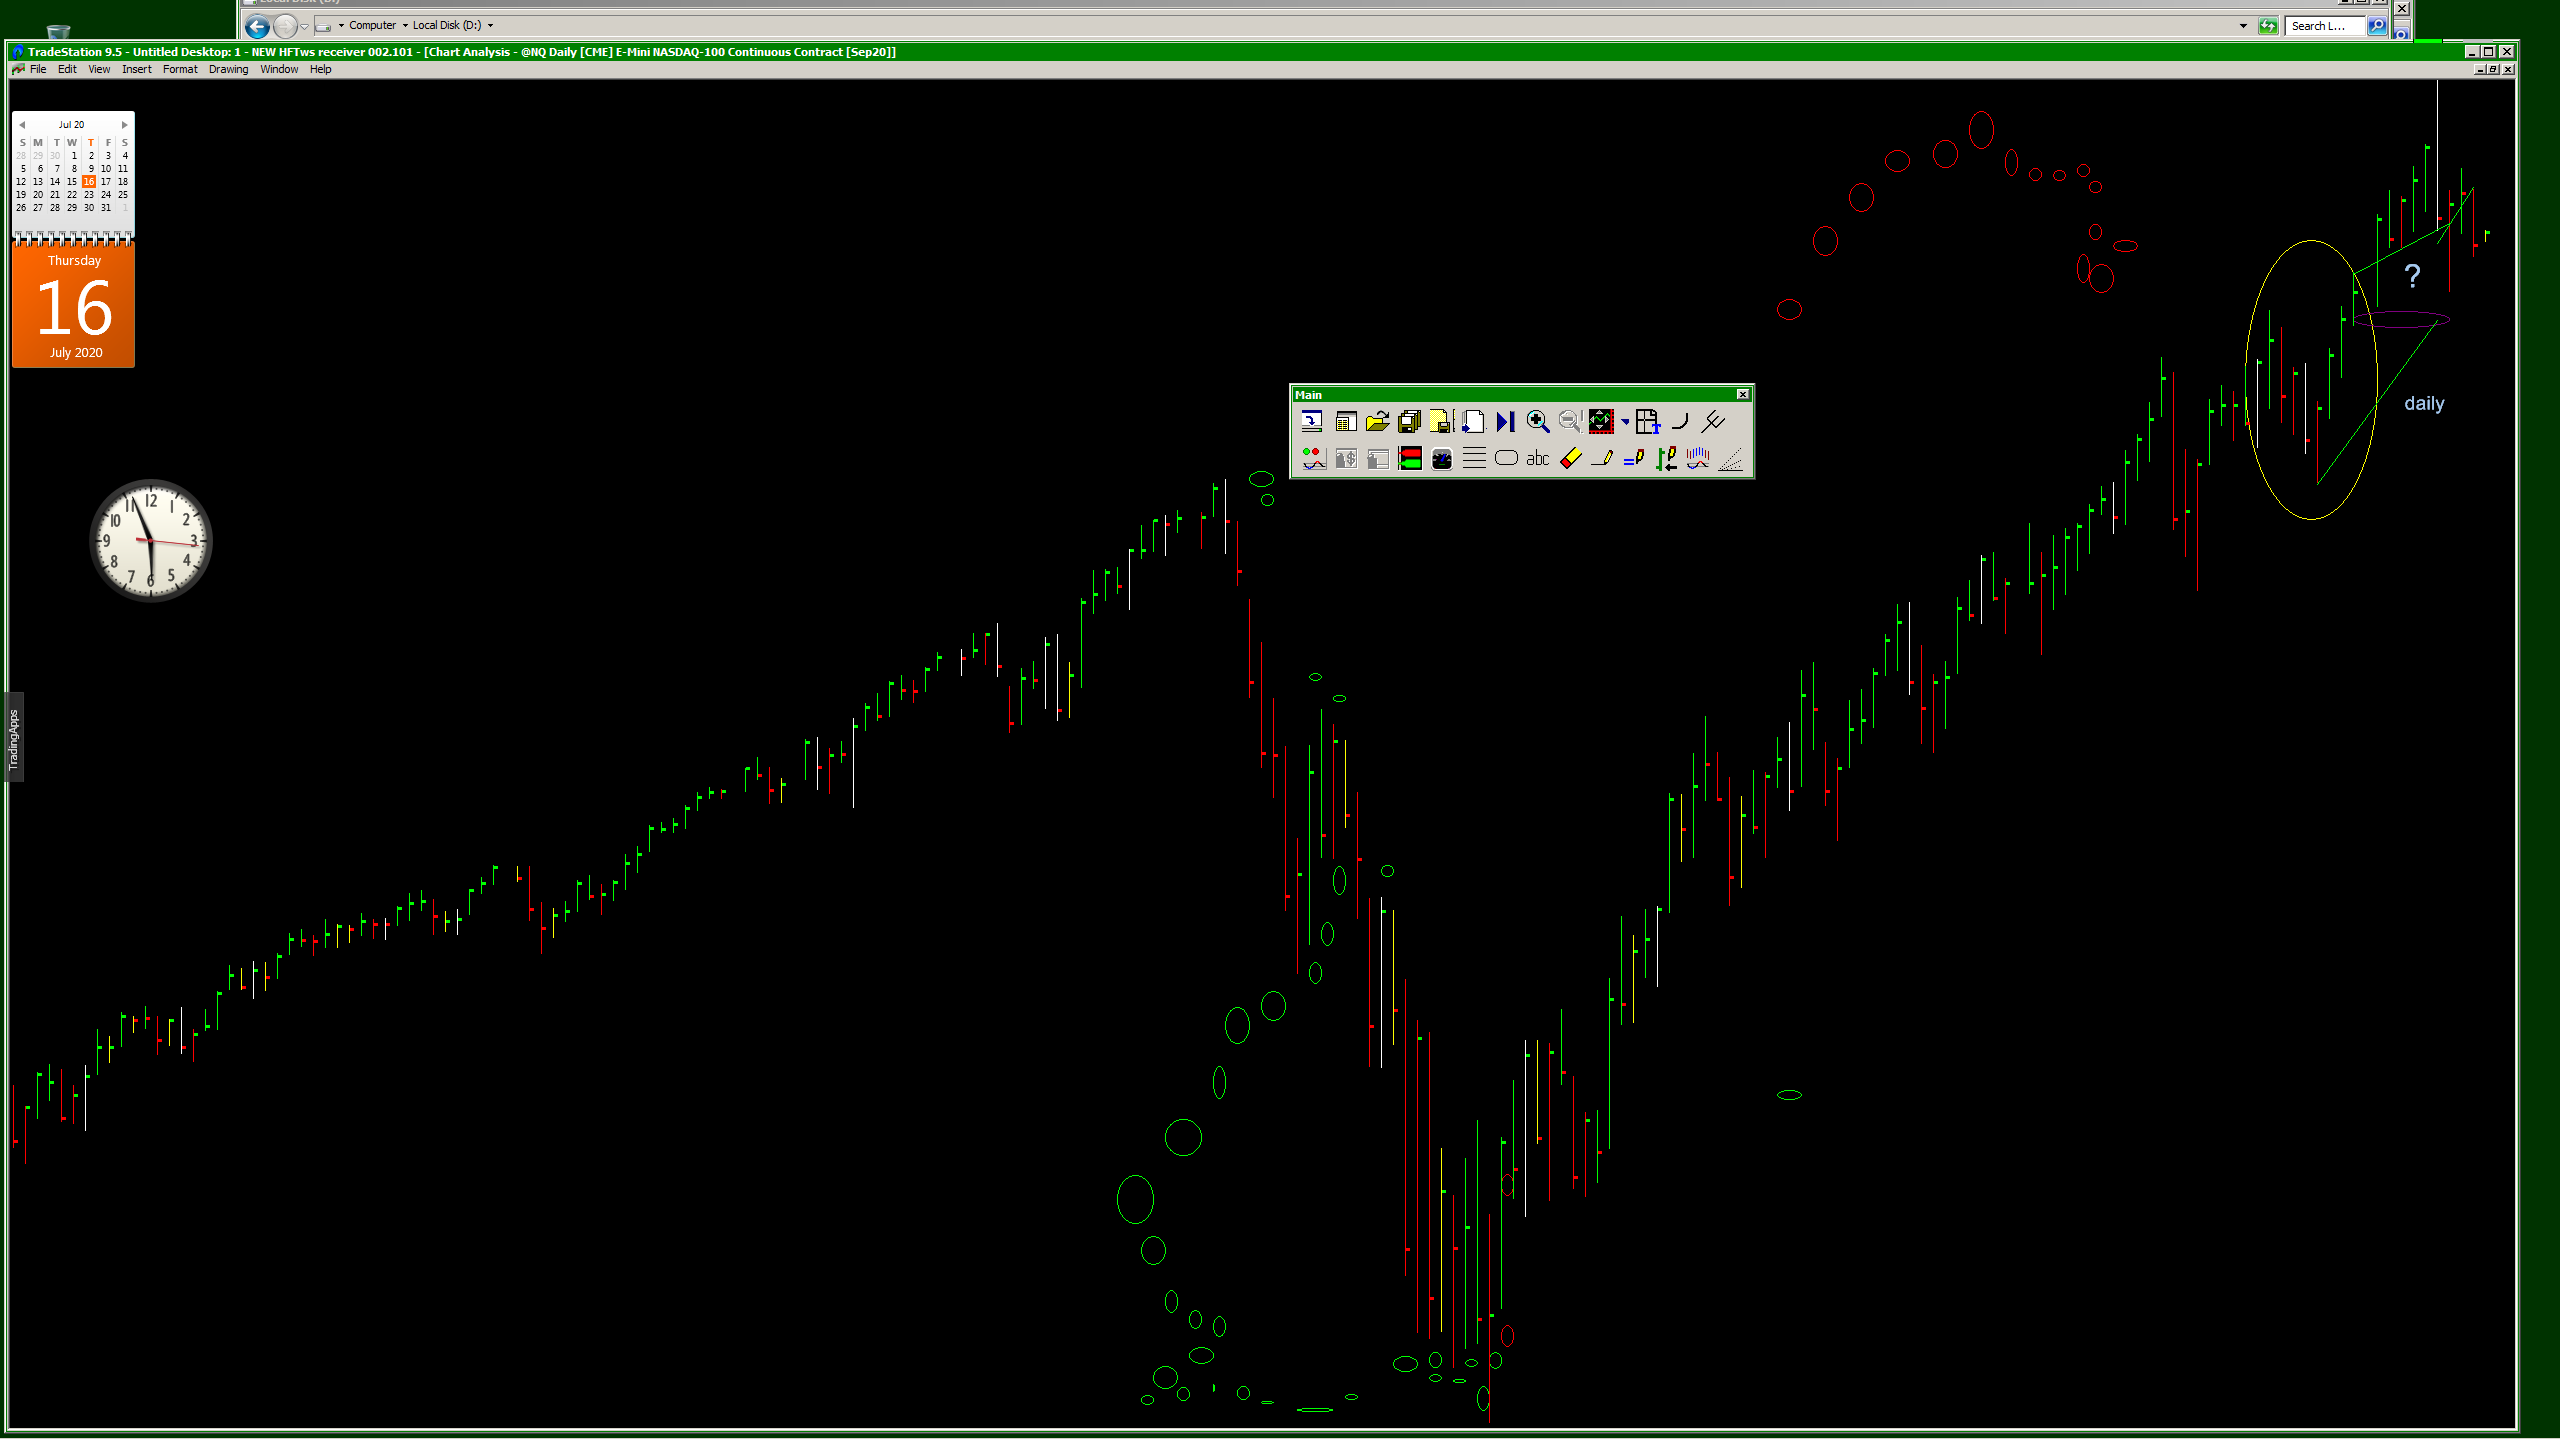
the last message re market info is still valid, no change for now...
http://ragingbull.lycos.com/mboard/boards.cgi?board=CLB01233&read=1990
google index speculation SPX :
http://uk.us.biz.yahoo.com/rb/050930/google_index.html?.v=1
Short Dec. NQ from the 13th @ 1626. I expect the top is in, I hope the PPT don't try to run it up there again! Does anyone know where I can get Daily Historical Prices for the NQ?
TIA,
MG
market direction has not changed and is still sideways / down ,
as previously mentioned. Also prior FOMC Sept-20 equities will
continue drifting sideways....
Sideways to down trading can be viewed either from start of
the year 2005 for the NAZ / NDX and INDU , and from mid August
for the main indices VLE / SPX / RUT until today.....
As mentioned before, only a drastic fall in oil prices will most
probably change the direction of the equity market in the U.S.
Drastic fall in oil prices means at least below $ 60.00
And if the Fed would discontinue increasing interest rates
Sept-20, this would be viewed favorably by investors.
Not to forget the present month September, surely the worst
month if you look at the statistics :
http://bigpicture.typepad.com/.shared/image.html?/photos/uncategorized/september_wsj_cruel_2.gif
http://safehaven.com/images/mchugh/3724_a.png
jwg
market continues to be in a sideways / down trading range, for
various reasons, as previously posted.
jwg
no change the aforementioned, market in a sideways / down mood
yeah, just like i said...sideways /down...that's where we're
heading
JW, thanks for the perspective.
general market :
with almost $67 nymex crude and most probably approaching
$70 the next days / weeks the market will continue to go
sideways / down , as already pointed out in my previous
messages.
to advise otherwise, is just neglecting the facts, with rising
oil prices, rising interest rates, falling consumer sentiment
and eventually rising CPI.....
only with strongly falling crude prices will the general market
guide us higher again.
here are various charts to show the indicators for friday E.O.D.
this indicator has broken support and last time this happened
was from march to mid-may. the ema10 crossed below the ema40
starting august.....
http://stockcharts.com/def/servlet/SC.web?c=$INDU:$CPC,uu[w,a]dallynay[db][pc10!c40!f][iut!Ld20!Li14...
http://stockcharts.com/def/servlet/SC.web?c=$COMPQ:$CPC,uu[w,a]dallynay[dc][pc10!c40!f][iut!Ld20!Li1...
RUT Daily running out of gas :
http://stockcharts.com/def/servlet/SC.web?c=$RUT,uu[w,a]daclynay[da][pc3!b7!f][iut!Ld100!La36,80,24]...
INDU Daily zig-zag and OBV + Acc/Distr falling :
http://stockcharts.com/def/servlet/SC.web?c=$INDU,uu[w,a]daclynay[da][pc3!b7!f][iut!Lf!Lg]&pref=...
NYSE Daily Summation Index shows falling breadth :
http://stockcharts.com/def/servlet/SC.web?c=$NYSI,uu[w,a]daclynay[da][pc3!b7!f][iut!Ld10!Lo5]&pr...
NYSE Daily MCCO continues below 0-line :
http://stockcharts.com/def/servlet/SharpChartv05.ServletDriver?chart=$NYMO,uu[p,a]deolynay[pb200][iu...
BKX Daily shows bearish :
http://stockcharts.com/def/servlet/SC.web?c=$BKX,uu[w,a]daclynay[da][pc3!b7!f][iut!Ld60!La12,26,9]&a...
Nasdaq BPI , the first time since may that this indicator crossed
the ema9 to the downside......
http://stockcharts.com/def/servlet/SharpChartv05.ServletDriver?chart=$BPCOMPQ,uu[g,a]decaynay[dc][pc...
Nasdaq Daily MCCO is still below the 0-line....
http://stockcharts.com/def/servlet/SharpChartv05.ServletDriver?chart=$NAMO,uu[w,a]dallyyay[dc][pc75]...
Nasdaq Daily Summation Index shows bearish breadth :
http://stockcharts.com/def/servlet/SC.web?c=$NASI,uu[w,a]daclynay[da][pc3!b7!f][iut!Ld10!Lo5]&pr...
NDX Daily :
http://stockcharts.com/def/servlet/SC.web?c=$NDX,uu[w,a]daclyiay[da][pc3!b7!f][vc60][iut!La6,10,4!Ld...
http://stockcharts.com/def/servlet/SC.web?c=$NDX,uu[w,a]daclyiay[da][pc3!b7!f][vc60][iut!Lg!Lf]&...
NDX Weekly looks fairly good to me still, thus i'm not
expecting any serious sell-off, but as indicated side-ways to
down trickling....
jwg
google has finally stopped its bleeding the last two weeks, and
reversed on friday with a 2 % gain.
http://stockcharts.com/def/servlet/SC.web?c=GOOG,uu[w,a]daclyiay[da][pc3!b7!f][vc60][iut!La6,10,4!Ld...
http://stockcharts.com/def/servlet/SC.web?c=GOOG,uu[w,a]daclyiay[db][pc20!c50!f][vc60][iut!La6,10,4!...
on coming thursday it is the one-year anniversary of google
and it remains to be seen if this reversal from last friday
will put in a bottom of the stock.
my trade google / long @ $285, but no call option...
jwg
methodibd : unfortunately i do not have a proper answer for your
question, hope you can resolve it, but i wouldn't get too
restless about this subject.
good trading / jwg
Yesterday (Aug. 10) was incredible.
Aug. 9
... bears display clear control after FOMC, albeit a low volume retracement after the bears made their point.
Aug. 10
... I await the "real" bear party.
... Futures up, gap-n-go.
... Tick visits 1100 numerous times, never goes below zero.
... VIX pegged low all morning
... 1MM upvol NYSE before noon vs. 200K dnvol.
... noon everyone goes to lunch expecting a breakout to alltime highs at 1:00 and 2:00.
... 12:20pm massive, violent sell volume slicing 100 ticks from SPY
... 1:00 bulls don't even show up
... 2:00 no bulls
Questions:
1. Who unleashed that sell program at 12:20?
2. Why did the bulls not fight?
I will not rest until I find the answers to these questions.
I will not let myself participate in a business where I don't know the identity of the key players and what they are doing.
It's like watching a football game where all you get to see is the scoreboard and a realtime (and historical) graphic of where the ball currently is and has been. Nobody would watch football if they could not watch the players.
Crude oil doesn't matter, then it does matter.
Is it really bulls vs. bears, or are the bulls really bears?
None of the advisories I pay had anything whatsoever to say about that violent reversal yesterday, except the high level reference to $65 oil, or perhaps they hope I did not get hurt too badly, or perhaps that, although they forgot to mention it earlier, they were fortunately hedged net short so they made a handsome profit.
I feel like such a chump.
re my previous message crude oil prices, this is exactly what is
happening now...crude nymex $65 now....next target $70...this
market will head sideways / lower....
jwg
market : with the PCR commonly crossing up/down the ema10+ema40
at various times the last months, it is the first time since mid
May, the ema10 has crossed below the ema40.
it is a cautionary sign to watch (nasdaq).
http://stockcharts.com/def/servlet/SC.web?c=$COMPQ:$CPC,uu[w,a]dallynay[db][pc10!c40!f][iut!Ld20!Li1...
in this context, the NYSE AD/DE issues 'bear indicator' should be
watched also and ensure, that the ma2 / ma3 do not remain too
long below 0.65
http://stockcharts.com/def/servlet/SC.web?c=$NYADV:$NYDEC,uu[w,a]dallynay[da][pb2!b3!f][iut!Ld20!Lo5...
the BKX won't do any better after the FOMC meeting on Tuesday....
http://stockcharts.com/def/servlet/SC.web?c=$BKX,uu[w,a]daclynay[da][pb200!d20,2!f][iut!Ld20!Li14,3]...
both NYSE + Nasdaq MCCO are below the 0-line and could reverse a
bit back or above the 0-line, and indicate another push up for
the market ( SPX 1253/1254 RT 61.8 is my number ).
and as long as ndx /vxn look like this 'bread-and-butter'
chart, with the ma20 above ma40, we continue to have smooth
sailing (nasdaq / ndx).
http://stockcharts.com/def/servlet/SC.web?c=$NDX:$VXN,uu[w,a]wallynay[df][pb20!b40!f][iut]&pref=...
good trading / jwg
google : attention drawn away from google with the new 'star' on the
nasdaq-horizon...BIDU
google is running out of gas....
http://stockcharts.com/def/servlet/SC.web?c=goog,uu[w,a]daclyiay[da][pc3!b7!f][vc60][iut!La6,10,4!Ld...
http://stockcharts.com/def/servlet/SC.web?c=GOOG,uu[w,a]daclyiay[db][pc20!c50!f][vc60][iut!Li14,3!Lo...
presently no position google....
jwg
market : the upcoming FOMC on Tuesday + Cisco earnings will surely
guide the market, and with interest rates rising further,and
possibly bringing the 10-y treasury yield to 4.5 / 4.6 %, this
market needs liquidity and confident buyers to grind higher.
crude prices between $60/$65 will hold this market down, unless
falling below $60 again.
jwg
methodibd : thx, yeah, good to hear from you, my 'system' works
o.k.
good trading / jwg
general markets / equities :
http://ragingbull.lycos.com/mboard/boards.cgi?board=CLB01233&read=1981
here is an article saying : U.S. equities, insiders are unloading
so only time will tell....
http://www.bcaresearch.com/public/story.asp?pre=PRE-20050726.GIF
jwg
Current Sentiment Readings:
CBOE P/C Ratio Friday Close @ 0.99
CBOE P/C Ratio 5-day SMA: 0.84 (all-time avg. 0.72, @1/20/04 top 0.59)
CBOE P/C Ratio 10-day SMA: 0.88 (all-time avg. 0.72, @1/20/04 top 0.63)
CBOE P/C Ratio 21-day SMA: 0.86 (all-time avg. 0.72, @1/20/04 top 0.68)
NYSE SSR/PSR:
NYSE SSR 10-w SMA: 19% (all-time avg. 47%)
NYSE PSR 10-w SMA: 50% (all-time avg. 29%)
NYSE Odd-Lot Short Sales Ratio: this week reading 14.1%
5-w SMA: 13.5% (all-time avg. 5.8%)
10-w SMA: 13.8% (all-time avg. 5.8%)
21-w SMA: 14.5% (all-time avg. 5.8%)
In historic terms, the Small Specs have NEVER been this bearish, and are shorting the heck out of this market.
google E.O.D. chart :
http://ragingbull.lycos.com/mboard/boards.cgi?board=GOOG&read=1342
google : this volume chart shows good support for now :
http://thomson.finance.lycos.com/lycos/iwatch/cgi-bin/iw_ticker?ticker=goog" target="_blank">http://www.tradingday.com/fli.html?http://thomson.finance.lycos.com/lycos/iwatch/cgi-bin/iw_ticker?t...
looks to me nyse /indu / spx are still preparing for the real
sell-off coming today....ah
closed my google long position ($292) eom
as mentioned yesterday, a bit of a sell-off is looming for
today..........
i saw weakness creeping up in the naz /ndx / sox yesterday
jwg
google today consolidating, see chart :
http://stockcharts.com/def/servlet/SC.web?c=GOOG,uu[w,a]daclyiay[db][pc20!f][vc60][iut!Li14,3!Ld20]&...
naz / ndx breadth / momentum charts :
http://ragingbull.lycos.com/mboard/boards.cgi?board=CLB01233&read=1969
jwg
re ndx / naz :
http://ragingbull.lycos.com/mboard/boards.cgi?board=CLB01233&read=1968
jwg
presently 'long' google with SL = $250 , no option trading at the
moment.
http://ragingbull.lycos.com/mboard/boards.cgi?board=CLB01233&read=1967
jwg
google continues to consolidate :
http://ragingbull.lycos.com/mboard/boards.cgi?board=CLB01233&read=1966
jwg
btw - I agree with your target for NDX/NQ of NDX 1635-1650:
http://www.investorshub.com/boards/read_msg.asp?message_id=7048878
hey jwg, good to see you around again - and pls. stop by our board when you have a chance (btw - ziggy was banned from our board):
http://www.investorshub.com/boards/board.asp?board_id=2593
all the best,
cash
as mentioned consolidation / correction always can happen any day,
well, we had one yday.......but the trend is still up for the
indices.
ndx target remains 1630 / 1640......
jwg
here some ndx/naz breadth and momentum charts :
naz bpi daily :
http://stockcharts.com/def/servlet/SharpChartv05.ServletDriver?chart=$BPCOMPQ,uu[g,a]decaynay[dc][pc...
naz mcco daily :
http://stockcharts.com/def/servlet/SharpChartv05.ServletDriver?chart=$NAMO,uu[w,a]dallyyay[dc][pc75]...
naz nyse ratio daily chart :
http://stockcharts.com/def/servlet/SharpChartv05.ServletDriver?chart=$COMPQ:$NYA,uu[w,a]dhlannay[de]...
naz sum idx daily :
http://stockcharts.com/def/servlet/SC.web?c=$NASI,uu[w,a]daclynay[da][pc3!b7!f][iut!Ld10!Lo5]&pr...
naz sum idx weekly :
http://stockcharts.com/def/servlet/SharpChartv05.ServletDriver?chart=$NASI,uu[p,a]wacayyay[pb10!b40]...
ndx vxn ratio weekly :
http://stockcharts.com/def/servlet/SC.web?c=$NDX:$VXN,uu[w,a]wallynay[df][pc50!c200!f][iut]&pref...
ndx vxn ratio daily :
http://stockcharts.com/def/servlet/SC.web?c=$NDX:$VXN,uu[w,a]dallynay[da][pc3!b7!f][iut!Lb2!Ld100]&a...
ndx vxn ratio weekly, last 10 years :
http://stockcharts.com/def/servlet/SC.web?c=$NDX:$VXN,uu[w,a]wallynay[pc50!c200!f][iut]&pref=G
ndx vxn ratio daily 'horizontal' :
http://stockcharts.com/def/servlet/SharpChartv05.ServletDriver?chart=$ndx:$vxn,uu[w,a]dallynay[dc][p...
conclusion :
breadth / momentum charts looking very bullish still, and cash
prices remaining a bit behind....
tells me, more upside potential left, however, a few correction
and/or consolidation days may always come in between....
good trading
jwg
re general market and in particular NQ / NDX / SMH i remain kind of
bullish with a minimum price target NDX 1630 / 1640 the next weeks
to come. consolidations / corrections are always possible and
prudent day traders know how to handle intermediate trend changes
or zig-zag trading, switching from scalping to position trading
vice versa.....
daily and weekly NDX charts :
http://stockcharts.com/def/servlet/SC.web?c=$NDX,uu[w,a]daclyiay[da][pc3!b7!f][vc60][iut!La6,10,4!Ld...
http://stockcharts.com/def/servlet/SC.web?c=$NDX,uu[w,a]waclyiay[db][pc3!b7!f][vc60][iut!La6,10,4!Ld...
http://stockcharts.com/def/servlet/SC.web?c=QQQQ,uu[w,a]daclyiay[da][pb50!d20,2!f][vc60][iut!Ld20!Lb...
jwg
some google info to study thru the weekend :
http://ragingbull.lycos.com/mboard/boards.cgi?board=CLB01233&read=1961
http://ragingbull.lycos.com/mboard/boards.cgi?board=CLB01233
jwg
riding google into 2006 :
http://www.marketwatch.com/news/story.asp?guid=%7BA9247824%2D430A%2D430B%2DA7BA%2D265C90524542%7D&am...
jwg
as you can see, i have re-opened this board because now i have some
more free time to spend on-line. the last few months i was very
busy sailing around the world.....
also the raging bull board has been re-opened
http://ragingbull.lycos.com/mboard/boards.cgi?board=CLB01233
i have added on both boards for trading also the google stock,
which is a momentum/volatility stock to trade daytrade/shortterm
and longterm.....
jwg
re google earnings and oex finally are behind us, and starting
next week this stock should stabilize around $300, and if the
general market continues to move up, then google will follow.....
http://ragingbull.lycos.com/mboard/boards.cgi?board=CLB01233&read=1959
jwg
| Volume | |
| Day Range: | |
| Bid Price | |
| Ask Price | |
| Last Trade Time: |


