 News
News  Market Data
  Discover
Support: 888-992-3836
Copyright © 2023 InvestorsHub Inc.


Register for free to join our community of investors and share your ideas. You will also get access to streaming quotes, interactive charts, trades, portfolio, live options flow and more tools.
PXYN Chart for June 25

Descending Wedge explained:

(The 'Percentage Meeting Price' is .79.)
Click on images to enlarge.
Eagle, I will a bit later...got a 'chat' going on at the moment. I noticed today though that the 'arc' was pretty close re: the 100% Fib, somewhere over 1.70, I recall. Take a look. See if you can make it out. If you send me an email address I can email and it will be larger than IH permits. TY. clearlake.ca@gmail.com
Hi Sharpei! TPIV continues! Please comment on your chart sir!
Thank you!
Here is my baby TPIV Chart!
Eagle1
!!!PXYN...20 to 80 employees and 1 to 30 States in just one year!
http://www.mesapharma.com/our-team/

Click in image to enlarge.
Listen to Jeremy Siegel (It is good for your pocketbook.)
The U.S. stock market will survive the turmoil coming out of Greece, with the Dow Jones industrial average still hitting 20,000 by December or January as long as the Federal Reserve raises interest rates, longtime stock bull Jeremy Siegel said Monday.
'He thinks that rate hike will come in September.
If so, "I think the fourth quarter could be the best of the four quarters that we have this year in the stock market," the Wharton School finance professor said in an interview with CNBC's "Power Lunch."
"When I look at all the factors and even interest rates going up, I still think this market is worth 5 to 10 percent more than what we're seeing it sell at today."
About six months ago, Siegel made his call that the Dow could hit 20,000 by the end of 2015. He believes that's where the market should be based on fundamentals, interest rates and projected earnings. However, he noted Monday that "we don't always get there right away."
His prediction that the Dow would hit 18,000 by the end of 2014 came true in December.' -Jeremy Siegel, CNBC June 22,2015
........
............................http://www.cnbc.com/id/102778500
GPL...Although I believe it is far too early to get into gold stocks, here is a silver play that looks ready for picking:

Click to enlarge image.
ELTP 6 mos chart: June 22

Fib Arc/Gann Angles mark areas of resistance.
Money Flow, Volume, Momentum languish as investors await news.

Click to enlarge image.
PXYN June 22 3 Month Daily Chart

Ascending triangle from June 12; macd, stochs, rsi all going higher...near term target .245 (+/-). (See: Ascending
Triangle www.thepatternsite.com)
Click image to enlarge.
No warranty is given as to accuracy, real or implied.
ELTP Eight Year Chart June 21 Fibonacci Arc and Gann Angles:

Click to enlarge image.
Moving Average Envelopes and How they will help you determine liftoff and landing points:
' Trends often start with strong moves in one direction or another. A surge above the upper envelope shows extraordinary strength, while a plunge below the lower envelope shows extraordinary weakness. Such strong moves can signal the end of one trend and the beginning of another.'

Click on image to enlarge.
PXYN 6 mos. Daily Chart, June 19.
This is a chart I have followed for a year (If you area unable to locate how I came up with .0124 please pull a 60 mins, 10 wks chart.):

Click image to enlarge.
I've checked RSI(below 30), ADX/DMI (below 10) and MACD (crossed signal line on 06/09) and all have hit bottoms and are on the rise.
Disclosure: This is not an inducement to purchase, nor is there a warranty of accuracy accompanying this information.
re Reverse Splits: This is a warning to all investors in small caps whose CEO's are doing reverse splits. I am seeing many being done each day and eventually they all seem to fall apart, due to the lack of substance within the stock to give the price support. This practice is akin to building a 'house of sand'. Please, please if your CEO announces that he will be doing a RS in order to get on Nasdaq (or just out of OTC) please get the hell out of that stock Unless you have a firm foundation under the stock, the price will crumble due to no support beneath it!!!!!!!
TPIV for Eagle1 June 18:
Let me know if you have a specific ? that is not addressed. Continued good fortune with TPIV!

Click on image to enlarge.
If you reference the diagonal line w/Fibonacci #s plotted the nexus should be close (may not be precisely accurate as I place it manually) but you should have a small range with which to work!
No warranties of accuracy accompany this analysis and there is no inducement to buy or sell this or any stock.
Not a problem, E...I will get it anyway. Be in touch.
Hi Sharpei! Meant to post here. TPIV update chart please!
Looking good here! Whatcha think?
Thanks buddy!
Eagle1
Yes Moose, Pay...cience. It doesn't come without doing then work.
It will happen. Patience is key.
Hi Moose: Take a look at the chart and tutorial I just posted and thanks for being an 'ELTP' Long(suffering!). S.
Bulkowski's Inverted Roof Pattern as seen in today's chart:

Click on image to enlarge.
The 'Inverted Roof' Pattern from thepattersite.com and how to calculate using it:

Click on image to enlarge.
Looking at the 15 and 30 min ELTP chart it looks like it is taking a turn North. I am very long on this stock but ready for it to move up some. Would love a close above .225!
ELTP 2 years daily chart, June 17, 2015:

Technical Indicators:

Click on image to enlarge.
Sharp, where do you get your charts from? I like the layout coloration etc?
How can I make one that looks like yours for other stocks Im interested in. Thanks in advance
Mornin' toofun, Okay, we're gonna do this step by step: 1) Google Bulkowski 'Big W' formation. The formula (easy) is there. These are the numbers to use (You may double check my numbers which could be off very slightly.) Top of Big W (S&P one year chart) about 2127...bottom 2072(should be 55) times .42 = 23 plus top of 'W' = 2150. (Some of my models are at 2160...so will update from time to time. This is not far from where we are and I do not believe we have seen the high for the year yet.)
Delete the following from the earlier text re SPX target: 'If I use 2157 and divide by 1921, our former record high I am at a ratio of 1.12, therefore I am going to multiply 1921 X 1.123 (my Fibonacci#) and the results are: 2151.5.'
Take care, COO!
Thanks, Sharpei. I have not placed my bet yet but definitely taken note of your kind advice.
K, keep up the good work, thank you.
toofun: More than happy to but it will be tomorrow. Brain, eyes really tired now. (On this board.)
Wow, now I really feel dumb. Could you please put that in english so the uninitiated can understand. I love your work but this time you lost me.
To All READERS of this board, please read the following:
Periodically I have been watching the SPX (s&p) and today it has come to my attention that there are red flags ahead that bear close watching:
So I have been running numbers based off the spx 12 month daily chart and have come to at least a sound trial topping number of approx. 2151.5. Stochastics on this one year chart (Pull up the chart and see for yourself.) Has topped out in the area around 100 four times now and demonstrates lower highs each time.
Using Bulkowski's calculations for his 'Big W formation', with our present recent low of 2072 (You will have to go to his page and read how to do the calculation.)I arrive at a number very close to 2151. If I use the low, 2072.5 and multiply it by 1.0382 (Fibonacci#), I am at 2151.66. If I use 2157 and divide by 1921, our former record high I am at a ratio of 1.12, therefore I am going to multiply 1921 X 1.123 (my Fibonacci#) and the results are: 2151.5. Some of the disparity is the difficulty in reading the exact prices on the chart...so we must allow for a minimum of flexibility. I am more inclined toward the 2151 # and will update this board from time to time. Thank you. S.
Please contact me on this page only for further clarification if needed.
Periodically I have been watching the SPX (s&p) and today it has come to my attention that there are red flags ahead that bear close watching:
So I have been running numbers based off the spx 12 month daily chart and have come to at least a sound trial topping number of approx. 2151.5. Stochastics on this one year chart (Pull up the chart and see for yourself.) Has topped out in the area around 100 four times now and demonstrates lower highs each time.[color=red][/color]
Using Bulkowski's calculations for his 'Big W formation', with our present recent low of 2072 (You will have to go to his page and read how to do the calculation.)I arrive at a number very close to 2159. If I use the low, 2072.5 and multiply it by 1.0382, I am at 2151.66.
C00: I just wanted to add to be cautious around the 6.50 area; and no, it is not a true cup and handle but it is a 'shallow' bowl which will give you somewhat, but not as powerful an effect as C&H. Watch the Stochastics very carefully as they are at 94 now with a ceiling at 100 you can see there may not be a huge upside, but you can make some money. Pls keep in touch.
Welcome utamaro! Here I am able to help investors (hopefully) with other stocks they may have. So feel free to take advantage and please pass the info along to your friends.
ELTP: June 16 4:00PM
This is what we see: the close was a couple of ticks above our resistance line on the Bear Channel. Things are not falling apart at all. And watching the MMs was instructive; CDEL actually won...but interesting, at the last of the day he was playing against himself...keeping the price from going to .24, but not allowing .236. This leaves me to believe that there are some powerful forces wanting to keep this down. Keep that in mind as it seems some heavy hitters may be buying large blocks of ELTP in very small increments which is why you are not seeing much movement and they know they are encouraging weak Longs to sell. Nasrat knows this game which, once again, is why he put the PP in place. Someone who understands, tell me if I am wrong please. It reminds me of the old smoky back rooms where deals got made.

Click on image to enlarge.
You are most welcome, Nasdaq.
Thanx for the update.
ELTP Chart for June 16:

Technical Indicators [b[color=green]](All looking good! We are still above our Bear Channel): [/color]

Click on image to enlarge.
Looks like it will be a creeper, much like its namesake.
The Little Engine that could...will!
Hey! That ascending triangle looks a lot like a Bear Flag!
ONVO...Hi old friend, C00! Here is your Chart. Looking great!!!!

ONVO 6 mos Stochs...macd:

Click to enlarge.
SNSS for reidtarb. Very nice!!! June 16 Chart (6 mos):

Click to enlarge image.
ONVO is under my radar. The chart looks interesting to me. Is it a cup and handle formation?
BIOS for reidtarb June 15:

Although the other indicators look promising, I don't see the ADX at or below 10 in over 6 mos and therefore cannot recommend this' and the 50 and 200 da's are moving down. This is a 'No'.
No warranties of accuracy or inducement to buy or sell is implied.
Spicknspan: Send some requests our way!!! Looking forward to seeing you. ELTP gonna have a grrrreat week! Good week for bios!
PFMT for reidtarb: June 15 Fibonacci Arc, Gann Angles, RSI, MACD, ADX/DMI, Stochastics
(Adjustments will need to be made to horizontal line/fib points due to Arc being manually, not digitally manipulated.
Click on image to enlarge.

Technical Indicators (All in steady up mode)

ELTP: Fibonacci Targets using the Fibonacci Arc as well as mathematical calculations for confirmation.
Note: The chart published earlier on June 14 was erroneously posted as the ELTP chart. The corrected chart is now shown.

Click on image to enlarge.
As we embark on this incredible journey with ELTP, the chart with critical price points becomes more relevant.
As you know, the target of 1.33/1.34 has been noted here on several occasions, but we don't know when we will hit that number, or what the resistance points should be until now...at least that is the hope.
What we do know is that .97 is our most recent all time high; I have pegged .1201 as a bottom point of that rise. If you note, .97 / by .1201 is '8'. Let it be also noted that a calculation of .20 X '8' is 1.60, our target for the Fib #1.62, referred to as the 'golden ratio'.
From .97 (or .9703) I will use Fibonacci #s to target stops along the way to our ultimate (at this time) $2 (100%).
.9703 X 1.08 = 1.05;
.9703 X 1.382 = 1.34;
.9703 X 1.5 = 1.455;
.9703 X 1.618 = 1.57;
.9703 X 2 = 1.9406.
There is no warranty as to the accuracy, real or implied, of information.
The chart I posted is the incorrect chart, however the numbers are correct. I mistakenly pulled the wrong chart out of IHUB gallery. The Correct chart will be posted immediately.
Exciting, isn't it, GMan.
Sharpei Diem!...You, too can learn to determine price direction without having to struggle through numerous online studies. |

'Keep It Simple Stupid' in the Complicated World of Stock Trading and Investment.
Thinking about where to best get in or out of your targeted stock? When you doubt where to put in a 'buy' order, go for the lower price even if means waiting -and you are chomping at the bit . Fibonacci numbers are most helpful as are technical indicators: moving averages, long term as well as short term chart assessments, Elliott Wave, rsi, macd, slow stochastics, adx/dmi, Donchian Channels, etc. in conjunction with Fundamentals to include the latest Q's, paying particular care to net assets.
(When considering small caps, I tend to pay particular attention to and avoid those that show reserves out of balance when compared to future requirements to operate, low floats, possible bk or 'lawsuits' mentioned on message boards and heavy finger-pointing at management found on message boards. (This last can be unreliable if there is an unusually high complement of postings of questionable or malicious intent.)
| Some believe technical analysis works, while others feel it's akin to reading tea leaves. Judging by the feedback comments on this column, reader opinions are sharply divided too. The fundamental analysts who didn't see the fall in the oil price, or who told us that gold was going back to $1,500, or that the DOW would collapse didn't seem to attract as much trenchant criticism as those of us involved in technical analysis. In 2014 we produced weekly CNBC blogs providing trading outlooks based on technical and chart analysis. We use chart analysis to establish the probability of trend change and to set price targets and objectives. In 88 percent of analysis notes in 2014 the price targets were achieved or exceeded. That's around the same percentage of correct calls in 2013 and 2012. The analysis methods we use are not complex; they can be applied by anyone without the need for a Master's degree in finance. These methods are covered in my books, including Guppy Trading. Charting analysis provides both the calculated price targets and the price levels that indicate the trade has failed. In 12 percent of cases, the analysis is not correct, but chart analysis provides exact price levels that signal this decision in real time. 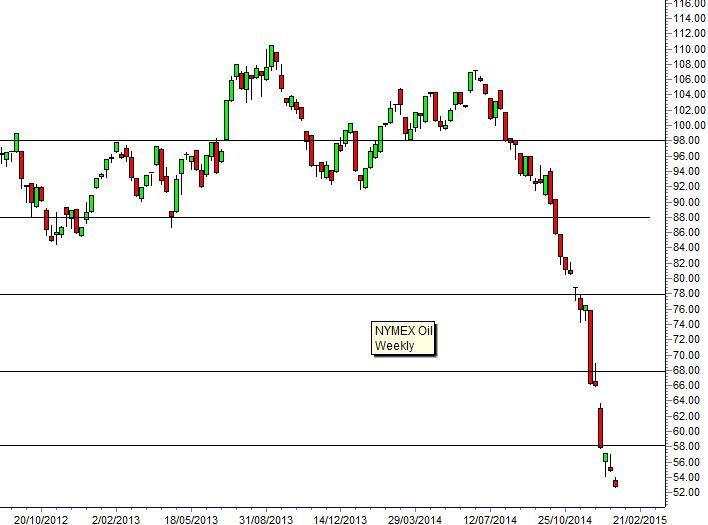 Our best calls for 2014 included the January 2013 DOW target of 17,000, NASDAQ at 4600 and S&P at 2000. They also included oil at $88, and then later $68 and $58. The next downside support target for NYMEX oil is $48. Gold support near $1,180 and the Shanghai Index upside targets above 3000 were also other correct analysis calls. Our worst call was the NIFTY where we expected the parabolic trend to develop into a 50 percent or greater retracement. There was a correction, but it was not a major change in the trend. Two bullish calls on the Australian dollar were also incorrect, with the market failing to break through resistance levels. Chart analysis is designed to identify situations where high probability outcomes are expected. Often chart analysis can be used to set exact price targets. The CNBC notes apply the same analysis methods we use in our personal trading and we use them because they work. Daryl Guppy Contributor This site is not intended to be a full course of study as there would be no time to process members' charts and questions, but there will be an attempt to encapsulate the oft-asked critical issues with TA as they apply to most of you. For more in depth study I have noted above under 'Author's Sources' and highlighted text quality sites that can be accessed online. (If you have a particular question regarding the action of an indicator or related to this process, just post it and I will answer to the best of my ability. Thanks for your patience with the limitations of this site. Using Technical Indicators The following is a short cut to finding an entry point but if you use most or all these 'tests' before jumping in, you should have some protection from overpaying a stock. (It is imperative that you use these in conjunction with the following time charts: Weekly one year, two year, five year, twenty (not all necessarily but use about three); AND. also do the same with the daily _ and even take a look at a couple of monthly charts (one to twenty years depending on how long its been listed, of course); then the final critical data to cement your decision should come from very short term - from six months daily to 60, 30, 10, 05 mins (in multiple time frames - two to 20 days, for example). Moving Averages: 50 DMA... Does this support a current price or are you looking forward to resistance at this MA? Same with 200 DMA. It's a happy chart that shows an upward cross over the 200 DMA by the 50. Use these in conjunction with the other Tech Indicators.
***Notice: I would like to welcome aboard one other chartist, Conix from the IHUB family of contributors. He, too will be adding his expertise in this area to those who wish help in their investment choices and approaches. Rules of Investing 1-10 are Keep It Simple Stupid X 10.  |
| Volume | |
| Day Range: | |
| Bid Price | |
| Ask Price | |
| Last Trade Time: |


