 News
News  Market Data
  Discover
Support: 888-992-3836
Copyright © 2023 InvestorsHub Inc.


Register for free to join our community of investors and share your ideas. You will also get access to streaming quotes, interactive charts, trades, portfolio, live options flow and more tools.
$TPAC - Does this look like a "Cup and Handle" chart?
IFXY 10 mins ,two days chart:

This will go (again) today to .0003; possible .0002, but that is a big risk due to # shares that might be traded at that price.
Click on image to enlarge.
Thanks, Ragin'....
The following is an excerpt from a Zach's Research article: '... one of the tenets of investing -- that the price of a stock, index, or commodity is a reflection of everything that is known about the security at a given time. In this context, combining the intelligence derived from technical analysis and fundamental analysis -- instead of basing an investment decision on a single set of data points -- can present a more complete picture of the factors that drive a security’s future price movement ..'
In full disclosure this was presented after a lengthy explanation of why TA does not work for sub pennies. The first premise, imo is absolutely and unequivocally the correct one. There is no area of technical analysis that does not lend itself to a higher understanding of a sub penny stock's past, present and future. S
Mike Ser of data provider Alphatrade.com said in an interview: 'Trading these types of stocks is like throwing darts. Place your order and hope you hit the bull's-eye.'
Who knew ?
Thanks, Bucky. Will keep building with info people want. Questions about the world of TA or investing small caps/micro caps/pennies answered here.
I have marked the top: 1921, critical pt 1438.4 from which I would like you to divide by 1.5, which you recognize as a (Fibonacci) 50% retracement. You should come up w/958.53 as a target zone for the bottom in the gold market. I have long held that 960.5 is the bottom. We won't quibble about a couple of dollars. Lara, a highly respected Elliott Wave chartist has targeted 957 on her chart that I discovered this am. I will post her chart as well (#2 chart).
Gold monthly chart w/critical areas marked for discussion:

Gold Chart by expert chartist Lara (online):

She targets the same (or very near same) bottom in gold as I:
957 (Lara)..960.5 (Sharpei).
Click on images to enlarge.
RMRK Charts for Lone Wolf and RajinCajun:
Daily Two Months Chart:

Monthly 10 Years Chart:

One Month Daily Chart:

Click on images to enlarge.
If you will contact me we can discuss other target areas for flipping.
Thanks RC: Will try to keep watch RMRK; btw, this am I will be charting GLD for Lone Wolf. As silver and gold are somewhat linked it may be interesting for you to see. I have some hard data (in my head, only) about where I think PM, especially gold is going and when. Nothing too scientific, but fun. Have a great w/e!
Sharpie awesome charting my friend! I'm hoping for a large uptick on wave 5 lol. Love your site and hope to learn soon much more. Thanks.
I've got a short term chart for you up now. Sorry for the error.
Ragin', I did make a mistake. Here is a two mo chart RMRK Let me know what specifically you need:

Click on image to enlarge. Can you read the text?
When it says overbought on the two months chart, it is an alert to go check the six months chart as it will have a very different meaning. Sorry about the IGEX error, been charting all day into the night and eyes and brain slowing.
Just let me know what you need. We need to talk about this some more so contact me. I'm always around. S.
Went back thru the room post you posted IGEX twice. RMRK when ever you get time.thanks.
Dang all I saw was IGEX.
Ragin', I'd be happy to do it again; it was posted on tonights thread for KB. I will do another for you on Saturday. Okay?
GBGM: Chart July 10
Not a bad thing when a stock spends two weeks+ accumulating/consolidating.

Click on image to enlarge.
ELTP: One Year Chart...signs of a pull back ahead?

Click on image to enlarge.
PXYN: Two charts; one two year chart and one one year chart...
Two Year chart:

Click on image to enlarge.
One Month Chart:

Click on image to enlarge
Great advice..!!!... Keep up the good work here Sharpei... You sacrifice to help others. What goes around. Comes around. GLTY
Sharpei's 'Rules for Trading the OTC':
1) Check for rsi having hit the 30 (or below, even better) w/i 6 mos at THE VERY LEAST!!!)'
2) Check 2 yrs up to 5 yrs charts (Daily and Wkly) to see the price trajectory and where the lowest low is. If currently it is lowest in history, be CAUTIOUS; then check the 30 mins, 60 mims, 5 mins, etc. You will see an entirely different picture with each timeframe...ALL ARE NECESSARY!!!
3)Check the latest 10Q and read carefully; it won't be a positive income almost assuredly, but be sure they have fewer than 1B shares outstanding and enough cash on hand to operate for six months between dilutions!! So check to see when they last diluted shares.
4) If they don't report as some in the 000's do not, read the mb closely and learn to discern between the BSr's on both sides and look for the sound, mature objective posts on the board...if there are any! Check website; make sure it is professionally done as is the IHUB home page.
5) Look at the 50da and the 200da. Check BBs; if it shows the lower band off the bottom of your chart, stay the hell away!!!
6) Learn Elliott Wave and Fibonacci #s!!! this practice has saved my butt so many times and when you trade in the OTC, you need all the education you can muster...AND THESE SKILLS ARE CRITICAL!!!
As I think of others I will add to this list...GLTA!!!
'Never short a dull market.' Natural instinct would tell us it's time to 'get out' when the market goes on and on in a trading range with low volume; however, the market generally works in contradiction to human nature; therefore when you see a lack of trading action and no pricing progress, reject the natural inclination to get out and move on and remember the 'old saw', 'Never short a dull market.' Most often patience will be rewarded.
EQLB 6 mos chart July 06...ParaSar indicating a turn from the bottom:

Click to enlarge image.
PXYN Chart 9:30 am July 07:

Click on image to enlarge.
GBGM Chart w/Elliott Wave pattern...about to spike into Wave 5.

Click on image to enlarge.
The Real Reason Gold Continues to Fall:
CHAPEL HILL, N.C. (MarketWatch) — There is too much bullishness among gold market timers, and that’s why the yellow metal has failed to respond to the macroeconomic factors that otherwise should have caused it to rally.
Imagine being told a month ago how the Greek debt crisis would unfold over the next few weeks. If you knew then that the country would default on its debt, you probably would have forecast that gold would rally. That’s because bullion is a safe haven in times of geopolitical and economic crisis, and Greece’s default threatens the economic stability of the entire eurozone.
Another reason you’d have been bullish is that gold is an inflation hedge, and it would have been a good bet that, if Greece did default, the European Central Bank would flood the eurozone with monetary stimulus in an effort to keep the Greek crisis from spreading.
As fate would have it, however, gold has fallen to a three-month low.
Contrarian analysis helps explain why. As I noted in an early June column on the prevailing sentiment among gold timers, the gold market rested “on a shaky sentiment foundation” because there were too many bulls to support a new bull market or even a sustainable rally.
Unfortunately, gold’s short-term prospects are no better today than they were in early June. Consider the average gold timer’s recommended gold exposure level (as represented by the Hulbert Gold Newsletter Sentiment Index, or HGNSI). It currently stands at minus 10%, barely lower than the minus 6.7% that prevailed a month ago.
That is noteworthy, since the normal pattern is for bullishness to rise and fall along with the market itself. Given that bullion is now at a three-month low, you’d expect the HGNSI to also be at or close to its lowest level of the past three months. In fact, however, the HGNSI currently is 23.3 percentage points higher than its three-month low.
This suggests that there is a strong undercurrent of eagerness to believe that gold will soon rally. And that is not a good sign, according to contrarian analysis, since contrarians believe that sustainable rallies begin when pessimism, despair and disbelief are more widespread and stubbornly held.
As always, however, contrarian analysis — to the extent it is a good forecasting model — applies only to the shorter term and therefore tells us nothing about where gold might be trading in several years’ time. So there is nothing necessarily inconsistent about the contrarians’ current skepticism and the gold bugs’ belief that the precious metal will be trading at much higher prices later this decade.
But if the contrarians are right, gold won’t begin its climb to those higher levels for a minimum of several months and very possibly from lower levels.'
http://www.marketwatch.com/story/the-real-reason-gold-has-been-falling-2015-07-02

The 200dma and Fib 2.382 indicate a bottom @ 806; however my belief has been 960.5, a 50% retracement...?
Click on image to enlarge.
'
SPX Monthly 10 year chart:
The S&P is still in a bull channel since March 09, 2009. Chartist's opinion as to the top of the bull market: 2335.5.

Click to enlarge image.
EGO: It's been a long time since I've given any serious thought to GOLD Miners; however, the time is upon us in the next six to eight months, I believe.
My favorite gold miner has always been EGO. I owner it back in 2010/11 at $8.05. Did I ever think it would one day be almost a quarter of that price? Heck, no!

Click on image to enlarge.
Thank you, Conix!
Geez, I sure as heck hope so, Nasdaq. But, Nasrat needs to start some PR! It wouldn't hurt and it sure could help. All the good stuff we talk about on the board is fodder for investors who are looking for a solid OTC stock (Have you looked at what is out there that is a heck of a lot higher than ELTP?), the OXYMORON of markets.
Bottoms in !!!
ERB, STWS, ELTP--Bottom Fishing
STWS
ELTP
Eltp's seven year long .20 support is likely to come under its heaviest threat in days/weeks to come.
ELTP Chart for Monday, June 29:

(This is not a prediction, but a warning that this chart formation can allow this area to be highly vulnerable.)
Click on image to enlarge.
Watch for S&P 2160 over the coming weeks as well. This is an area at which a pull back in major markets is likely to occur.
PXYN chart going into Monday, July 29:
Using Gann Angles and Fibonacci Arc, 50DMA.

Shows 50% retracement off low of .007 right at high of .026.
Click on chart to enlarge.
Spicknspan: PXYN, it is either going to bounce off the middle line of the BBs around .019 or, .014 is possible. ELTP going down...my best for now is possible .18. If you need anything else just ask and welcome to the board. Charts, technical explanations...for the asking. TY, Sharpei
Looking for a bottom play. Short term. Any ideas?
Best advice ever (as seen on ADMD June 26):
'I got out when the first 120 day count was in effect, Got out at the 119th day or so calender days. And you are right pennies are for flipping.. I actually flip everything even Nasdaq stocks. I got burned by FREESEAS back in February so I learned not to trust anything. Read the candle sticks, CCI, RSI, 20/50 day movimg average on a daily chart...watch the intraday 15 minute charts..look for bullish reversals or bearish reversals depending if you are bull or a bear or maybe both..and flip these stocks with no emotion.MOST important rule LOCK profits...I just rode DNRG from 0.01 to 0.20. Got out at 0.18 some people would say let it ride but a 7k profit in 2 days is good enough for me, and Im waiting for the RSI to retrace bullish runs dont last forever. I wish everyone the best in ADMD. Everyone experiences losses its knowing how to get back up and learn to not repeat your mistakes is the key to surviving this beautiful career as a trader...oh and be sure you use L2 EquityFeeder is pricey but the gains you make can pay for it....LOCK those profits and trade with no emotions... Some people may say technical analysis dont work in the OTC thats bullshit..I have my profits to prove otherwise and Im new to trading lol 6 months lol..well this my free one post. I truly wish everyone the best here. GLTA.'
PXYN Chart for June 25

Descending Wedge explained:

(The 'Percentage Meeting Price' is .79.)
Click on images to enlarge.
Sharpei Diem!...You, too can learn to determine price direction without having to struggle through numerous online studies. |

'Keep It Simple Stupid' in the Complicated World of Stock Trading and Investment.
Thinking about where to best get in or out of your targeted stock? When you doubt where to put in a 'buy' order, go for the lower price even if means waiting -and you are chomping at the bit . Fibonacci numbers are most helpful as are technical indicators: moving averages, long term as well as short term chart assessments, Elliott Wave, rsi, macd, slow stochastics, adx/dmi, Donchian Channels, etc. in conjunction with Fundamentals to include the latest Q's, paying particular care to net assets.
(When considering small caps, I tend to pay particular attention to and avoid those that show reserves out of balance when compared to future requirements to operate, low floats, possible bk or 'lawsuits' mentioned on message boards and heavy finger-pointing at management found on message boards. (This last can be unreliable if there is an unusually high complement of postings of questionable or malicious intent.)
| Some believe technical analysis works, while others feel it's akin to reading tea leaves. Judging by the feedback comments on this column, reader opinions are sharply divided too. The fundamental analysts who didn't see the fall in the oil price, or who told us that gold was going back to $1,500, or that the DOW would collapse didn't seem to attract as much trenchant criticism as those of us involved in technical analysis. In 2014 we produced weekly CNBC blogs providing trading outlooks based on technical and chart analysis. We use chart analysis to establish the probability of trend change and to set price targets and objectives. In 88 percent of analysis notes in 2014 the price targets were achieved or exceeded. That's around the same percentage of correct calls in 2013 and 2012. The analysis methods we use are not complex; they can be applied by anyone without the need for a Master's degree in finance. These methods are covered in my books, including Guppy Trading. Charting analysis provides both the calculated price targets and the price levels that indicate the trade has failed. In 12 percent of cases, the analysis is not correct, but chart analysis provides exact price levels that signal this decision in real time. 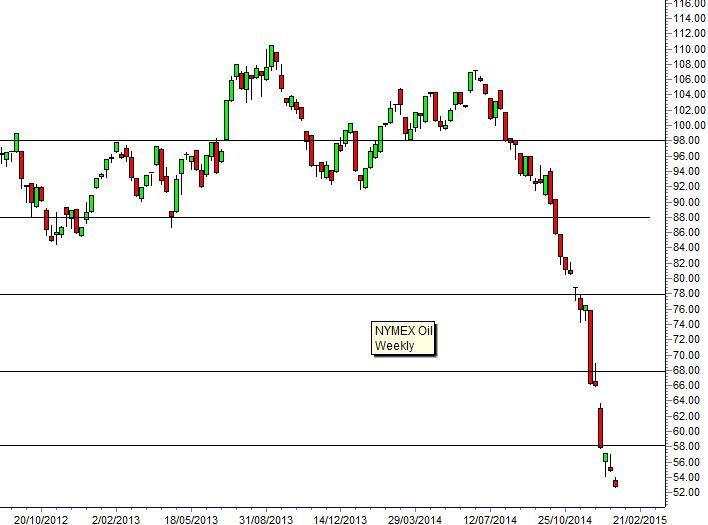 Our best calls for 2014 included the January 2013 DOW target of 17,000, NASDAQ at 4600 and S&P at 2000. They also included oil at $88, and then later $68 and $58. The next downside support target for NYMEX oil is $48. Gold support near $1,180 and the Shanghai Index upside targets above 3000 were also other correct analysis calls. Our worst call was the NIFTY where we expected the parabolic trend to develop into a 50 percent or greater retracement. There was a correction, but it was not a major change in the trend. Two bullish calls on the Australian dollar were also incorrect, with the market failing to break through resistance levels. Chart analysis is designed to identify situations where high probability outcomes are expected. Often chart analysis can be used to set exact price targets. The CNBC notes apply the same analysis methods we use in our personal trading and we use them because they work. Daryl Guppy Contributor This site is not intended to be a full course of study as there would be no time to process members' charts and questions, but there will be an attempt to encapsulate the oft-asked critical issues with TA as they apply to most of you. For more in depth study I have noted above under 'Author's Sources' and highlighted text quality sites that can be accessed online. (If you have a particular question regarding the action of an indicator or related to this process, just post it and I will answer to the best of my ability. Thanks for your patience with the limitations of this site. Using Technical Indicators The following is a short cut to finding an entry point but if you use most or all these 'tests' before jumping in, you should have some protection from overpaying a stock. (It is imperative that you use these in conjunction with the following time charts: Weekly one year, two year, five year, twenty (not all necessarily but use about three); AND. also do the same with the daily _ and even take a look at a couple of monthly charts (one to twenty years depending on how long its been listed, of course); then the final critical data to cement your decision should come from very short term - from six months daily to 60, 30, 10, 05 mins (in multiple time frames - two to 20 days, for example). Moving Averages: 50 DMA... Does this support a current price or are you looking forward to resistance at this MA? Same with 200 DMA. It's a happy chart that shows an upward cross over the 200 DMA by the 50. Use these in conjunction with the other Tech Indicators.
***Notice: I would like to welcome aboard one other chartist, Conix from the IHUB family of contributors. He, too will be adding his expertise in this area to those who wish help in their investment choices and approaches. Rules of Investing 1-10 are Keep It Simple Stupid X 10.  |
| Volume | |
| Day Range: | |
| Bid Price | |
| Ask Price | |
| Last Trade Time: |


