 News
News  Market Data
  Discover
Support: 888-992-3836
Copyright © 2023 InvestorsHub Inc.


Register for free to join our community of investors and share your ideas. You will also get access to streaming quotes, interactive charts, trades, portfolio, live options flow and more tools.
Now Is The Perfect Time To Play The Shanda Game
Apr 23 2013, 18:46
by: Charlie You
http://seekingalpha.com/article/1364031-now-is-the-perfect-time-to-play-the-shanda-game?source=yahoo
Shanda Games Limited (GAME) is not doing well lately. Over the last year, its stock price went down from over $5 in May 2012 to the recent 52-week low of $2.68.
This is because GAME's business is struggling. Since Q2 2012, its monthly active user base and average paying accounts have been shrinking. As a result, both its revenue and profits declined three quarters in a row.
However, I believe the stock market overreacted to GAME's poor business performance. At the current price of $2.68, GAME offers a great risk/reward profile for those investors who have the courage to take advantage of this opportunity.
Dirt Cheap
At the current price, GAME carries a P/E ratio of about 4 and P/B ratio of about 1. Its market cap is about $740 million. At the end of 2012, GAME had over $600 million in cash and cash equivalents on its balance sheet. That means if we net out the cash, GAME's market cap is only $140 million.
Last year, GAME's net profit was $177 million. That's more than its market cap, excluding cash. In other word, an investor can recover all his money in less than one year if he buys the stock now. I believe this ridiculously low valuation offers the investor a huge safety margin.
Yes, GAME's business is struggling, but it's still making good money. And, it will continue to do so for quite some time even assuming there will be no hit game in its game pipeline.
Growing Industry
Is the industry that GAME operates in collapsing? Quite the contrary. In 2012, China's total video game sales reached RMB60.3 billion, with a growth rate of 35%. This growth is expected to continue, albeit at a slower rate. Total video game sales are forecast to grow more than 12% per year in the next five years and hit RMB130 billion by 2017.
Revenue Source
Unlike other online gaming companies such as Changyou.com Limited (CYOU) or Giant Interactive Group, Inc. (GA), which rely on only one game or one series of games, GAME's revenue source is more spread out. Currently, its top game Mir II contributed 32% of total revenue, while the other two games, Dragon Nest and Woool, contributed 16% and 15%, respectively. Mobile games and overseas revenues contributed another 10%.
Strong Pipeline
GAME has a solid new game pipeline that may become the catalyst for the stock. Its upcoming title, Rift, has ranked among the top five most anticipated games on several major Chinese game portals. In addition, GAME will launch many other games such as AION 4.0 expansion pack, World Zero, Final Fantasy XIV, and Dungeon Striker in 2013. GAME will launch several mobile games as well.
Strength in Mobile
Compared to other big players in the online gaming industry, GAME is better positioned to compete in the mobile game area. In Q4 2012, its other revenues (mainly mobile revenues) grew more than 60%, thanks to the superb performance of its mobile game called "Million Arthur." In 2013, GAME will launch more mobile games in Taiwan, Hong Kong, and Mainland China to capitalize on its strength and expertise in mobile gaming.
Dividends and Buyback
GAME has been busy buying back company shares. In the past three years, GAME has bought back over 23 million shares of company stock at a total cost of $107 million. This translated into an average cost of $4.65 a share. The share buyback amounted close to 9% of current total shares outstanding. Currently, GAME still has an ongoing stock repurchase program to buy back an additional $60 million worth of shares.
In 2012, GAME issued a massive dividend payout. It paid $290 million or $1.02 per share to investors. This kind of dividend payout may continue in the future since GAME generates a lot of cash year after year.
Portfolio Approach
I believe China's online gaming industry offers a low risk, high reward opportunity for investors who have the courage to step in. The single most important factor is valuation. Some stocks in this industry have been priced so low that investors can enjoy a huge safety margin buying at such a depressed price. Secondly, this industry is somewhat recession proof. People play online games in good times and bad. Some people even argue that people play more games in bad times because of high unemployment and the fact that online gaming is the cheapest form of entertainment in China. Finally, online game companies generate a tremendous cash flow. For example, GAME's cash flow from operating activities was $237 million in 2012, or 32% of its current market cap.
However, it's quite difficult to predict which new game will be a hit and which company will prosper going forward. For example, CYOU's game "Tian Long Ba Bu" turned out to be a huge success, but the game had a very shaky start. Conversely, another game, "Lu Ding Ji," also launched by CYOU, started very strong but ended up as a dud.
So how do you deal with this situation? I believe the best way is to use a portfolio approach. The investor should invest in several different companies within this industry. The key is to buy them "on the cheap."
Right now, I have invested in three online gaming companies. Perfect World Co., Ltd. (PWRD) is my largest holding, followed by NetEase, Inc. (NTES). I bought NTES at the end of 2012 when it fell below $40. Recently, I started to accumulate GAME at around $2.70. I will keep an eye on CYOU and GA and will step in should their prices fall.
Chinese Web Gamers at 51% Discount a Buy to Opennheimer
By Victoria Stilwell & Belinda Cao - Jan 4, 2013 2:28 PM MT.
http://www.bloomberg.com/news/2013-01-03/chinese-web-gamers-at-51-discount-a-buy-to-opennheimer.html?cmpid=yhoo
Chinese online gaming stocks trading at a 51 percent discount to the nation’s equities listed in the U.S. is a signal to buy the shares on prospects the companies will use cash to pay dividends, according to Oppenheimer & Co.
Web game developers Shanda Games Ltd. (GAME), Changyou.com Ltd. (CYOU), Giant Interactive Group Inc. (GA), NetEase Inc. (NTES) and Perfect World Co. Ltd. traded at an average 6.7 times estimated earnings yesterday, compared with a multiple of 13.7 for stocks on the Bloomberg China-US Equity Index. (CH55BN) This gives them one of the most enticing valuations in the technology and Internet sector, Andy Yeung, a New York-based analyst at Oppenheimer, said by phone yesterday.
“Valuations are getting very low, and very attractive to investors,” said Yeung, whose ratings on the companies range from market perform to outperform. “These companies are becoming value stocks.”
Once the companies have developed the games they face low costs to offer them to players, helping boost their cash piles, according to Jeff Papp, an analyst at Oberweis Asset Management. That leaves the companies open to paying out shareholders through dividends and share buybacks, he said by phone from Lisle, Illinois yesterday.
Changyou boosted its cash from operations to $276.6 million in the fiscal 2011 year, from the $1.7 million in 2006. The Beijing-based company declared a special cash dividend of $3.80 in August for each American depositary receipt, following 14 percent growth in second-quarter profit that beat analysts’ estimates.
‘Shareholder Value’
NetEase authorized a share repurchase program of as much as $100 million in November, as well as a special cash dividend of $1 per American depositary share. The Beijing-based company more than tripled cash from operations through September last year from 2007.
“They can extract more shareholder value by paying out more recurring dividends,” Papp said. “That’s something that’s going to happen more often and that can help attract more attention to the names.” Oberweis holds shares of Giant Interactive, Changyou and NetEase.
Shares of Shanghai-based Shanda Games are trading 4.7 times its estimated profit, the lowest level among the five online game operators. The valuation of Beijing-based NetEase is 10.2 times its earnings, the highest among the five.
Online game operators are exposed to product-cycle risk and have come under scrutiny from the Chinese government, which has restricted the number of hours the games can be played by minors, Oppenheimer’s Yeung said. These factors have made investors cautious on the sector, depressing valuations, he said.
Prices Gain
Perfect World (PWRD) surged 6.4 percent in New York to $12.68, the highest level since April 27, after adding 2 percent in 2012, less than the China-US gauge’s 10 percent advance last year. Giant Interactive extended its rally to a sixth day, gaining 4 percent to $6.48, after climbing 33 percent last year.
Changyou.com jumped 3 percent to $29.12, the highest price since October 2011. Shanda advanced 0.6 percent in its third day of gains to $3.12, while NetEase added 1.4 percent to $43.4. After today’s close, the stocks were trading at 6.9 times estimated earnings on average, shrinking their discount to the Bloomberg China-U.S. gauge to 50 percent.
GAME Video Chart 12/21/12
http://www.qualitystocks.net/videocharts.php
This Gaming Company Might be Down, but it’s Not Out
By Harsh Chauhan - November 28, 2012|
http://beta.fool.com/techjunk13/2012/11/28/gaming-company-might-be-down-its-not-out/17507/?logvisit=y&source=eednaslnk0000001&published=2012-11-28
It isn’t good news when a company’s top line is shrinking while the industry it operates in is growing. Shanda Games (NASDAQ: GAME), the third largest online gaming company in China, is witnessing a similar decline. In its recently-reported third-quarter, Shanda’s revenue declined 20% from last year to $170.4 million.
I was of the opinion that Shanda might make for a good long-term investment, but now I believe that it would make sense to wait and watch till it registers decent revenue growth. There’s huge opportunity in the Chinese online gaming market, but it seems like Shanda is unable to make the most of it at the moment.
Moreover, there’s stiff competition from both upcoming companies and established players for Shanda to contend with. For instance, the emergence of Giant Interactive (NYSE: GA) with its portfolio of impressive games such as ZT Online is a serious threat for Shanda. Giant Interactive has witnessed solid top line growth this year, and its earnings have also followed suit. Hence, it’s not surprising that Giant has appreciated more than 25% this year while Shanda is in the red.
Going Slow, but Steady
But Shanda is intent on fighting back through its games, and there are some positive indicators. The company’s average monthly active user count went up by 6.2% sequentially, driven by release of expansion packs and new games. However, the number of average monthly paying users did go down 7.9% from the previous quarter as the new content updates had many free features. Thus, it remains to be seen how Shanda would be able to monetize its games and arrest its revenue decline.
The company might not be able to deliver quantitative results now, but management is highly focused on the qualitative part. Shanda is moving in the right direction by improving the life of its games through expansion packs, as these games would turn into constant revenue streams in the future.
Shanda is trying to develop an array of addictive games through its All-Star strategy, and the extension of life cycle of games such as Mir II and Woool is important as these might become its biggest revenue drivers. For example, Activision Blizzard’s (NASDAQ: ATVI) World of Warcraft has been out for seven years now and the company is still extending the title’s life cycle.
The reason behind this is simple – WoW brings in nearly 30% of Activision’s revenues and hence, the company has kept this game alive through expansion packs. Shanda is also following a similar strategy but it looks like the company is taking a lot of time in introducing games. It launched Age of Wushu in the previous quarter and the game has contributed well to Shanda’s coffers.
A Mix of Catalysts
But, most of Shanda’s games are in development and this is one of the reasons why it has seen a sharp drop in top line this year. RIFT, World Zero, Final Fantasy XIV 2.0 and Dungeon Striker are games that are currently under development and could help Shanda revive its revenue.
In addition, Shanda is looking overseas to diversify its revenue streams. It will launch Dragon Nest, one of its most famous games, in Europe next year. Also, Shanda would be launching its other existing games in the international market as well.
Moreover, Shanda is also entering the fray in mobile gaming, which is indeed a smart move. It is developing the mobile versions of Woool and Dragon Nest, along with the Final Fantasy series. These games should help Shanda get into mobile gaming, which is again a very lucrative market considering the number of smartphones and tablets being sold nowadays.
The Takeaway
Shanda is working hard in a number of areas to bring itself back to life. It has a good number of games in the works, is expanding internationally, and is also focused on tapping the opportunity in mobile gaming. I still believe in the company’s long-term prospects, and also like the fact that it’s trading cheaply at a P/E of 4.52 as compared to peers.
However, I think it would make sense to wait and watch this stock from the sidelines and check whether its upcoming games and strategies can help it record revenue growth once again. Till then, you can add Shanda Games to your Watchlist by clicking here and stay on top of the latest news and analysis on this potential turnaround story.
Shanda Games Limited Stock Upgraded (GAME)
By TheStreet Wire 11/29/12 - 04:00 AM EST
http://www.thestreet.com/story/11778625/1/shanda-games-limited-stock-upgraded-game.html?puc=yahoo&cm_ven=YAHOO
NEW YORK (TheStreet) -- Shanda Games (Nasdaq:GAME) has been upgraded by TheStreet Ratings from sell to hold. (lol) The company's strengths can be seen in multiple areas, such as its notable return on equity, attractive valuation levels and expanding profit margins. However, as a counter to these strengths, we also find weaknesses including deteriorating net income, weak operating cash flow and a generally disappointing performance in the stock itself.
Highlights from the ratings report include:
¦ The return on equity has improved slightly when compared to the same quarter one year prior. This can be construed as a modest strength in the organization. Compared to other companies in the Software industry and the overall market, SHANDA GAMES LTD -ADR's return on equity significantly exceeds that of both the industry average and the S&P 500.
¦ GAME's debt-to-equity ratio of 0.81 is somewhat low overall, but it is high when compared to the industry average, implying that the management of the debt levels should be evaluated further. Despite the fact that GAME's debt-to-equity ratio is mixed in its results, the company's quick ratio of 1.61 is high and demonstrates strong liquidity.
¦ The company, on the basis of change in net income from the same quarter one year ago, has underperformed when compared to that of the S&P 500 and the Software industry average. The net income has decreased by 24.5% when compared to the same quarter one year ago, dropping from $55.00 million to $41.50 million.
¦ Net operating cash flow has decreased to $34.68 million or 45.81% when compared to the same quarter last year. In addition, when comparing the cash generation rate to the industry average, the firm's growth is significantly lower.
.
Shanda Games Limited, an online game company, develops, sources, and operates online games in the People's Republic of China. It also licenses its games to third parties. The company has a P/E ratio of 9.1, below the S&P 500 P/E ratio of 17.7. Shanda Games has a market cap of $896.3 million and is part of the technology sector and computer software & services industry. Shares are down 18.2% year to date as of the close of trading on Wednesday.
Shanda Games Hits Estimates, But GAAP Results Lag Last Year's
By Seth Jayson
November 27, 2012
http://www.fool.com/investing/general/2012/11/27/shanda-games-hits-estimates-but-gaap-results-lag-.aspx
Shanda Games (Nasdaq: GAME ) reported earnings on Nov. 26. Here are the numbers you need to know.
The 10-second takeaway
For the quarter ended Sep. 30 (Q3), Shanda Games met expectations on revenues and met expectations on earnings per share.
Compared to the prior-year quarter, revenue shrank significantly and GAAP earnings per share contracted significantly.
Gross margins grew, operating margins dropped, net margins shrank.
Revenue details
Shanda Games reported revenue of $170.4 million. The nine analysts polled by S&P Capital IQ wanted to see revenue of $170.3 million on the same basis. GAAP reported sales were 19% lower than the prior-year quarter's $211.9 million.
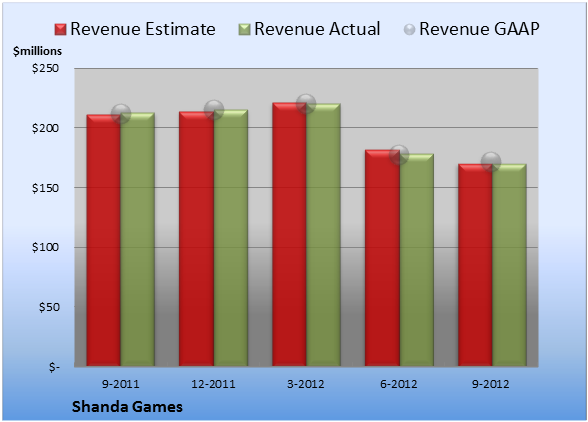
Source: S&P Capital IQ. Quarterly periods. Dollar amounts in millions. Non-GAAP figures may vary to maintain comparability with estimates.
EPS details
EPS came in at $0.17. The six earnings estimates compiled by S&P Capital IQ averaged $0.17 per share. GAAP EPS of $0.15 for Q3 were 21% lower than the prior-year quarter's $0.19 per share.

Source: S&P Capital IQ. Quarterly periods. Non-GAAP figures may vary to maintain comparability with estimates.
Margin details
For the quarter, gross margin was 63.4%, 210 basis points better than the prior-year quarter. Operating margin was 26.0%, 70 basis points worse than the prior-year quarter. Net margin was 23.5%, 180 basis points worse than the prior-year quarter.
Looking ahead
Next quarter's average estimate for revenue is $177.6 million. On the bottom line, the average EPS estimate is $0.19.
Next year's average estimate for revenue is $747.7 million. The average EPS estimate is $0.76.
Investor sentiment
The stock has a three-star rating (out of five) at Motley Fool CAPS, with 312 members out of 322 rating the stock outperform, and 10 members rating it underperform. Among 47 CAPS All-Star picks (recommendations by the highest-ranked CAPS members), 40 give Shanda Games a green thumbs-up, and seven give it a red thumbs-down.
Of Wall Street recommendations tracked by S&P Capital IQ, the average opinion on Shanda Games is outperform, with an average price target of $4.73.
Shanda Games Reports Third Quarter 2012 Unaudited Results
http://ih.advfn.com/p.php?pid=nmona&article=55186891&symbol=GAME
Today : Tuesday 27 November 2012
HONG KONG, Nov. 26, 2012 /PRNewswire/ -- Shanda Games Limited ("Shanda Games" or the "Company") (NASDAQ: GAME), a leading online game developer, operator and publisher in China, today announced its unaudited consolidated financial results for the third quarter ended September 30, 2012.
Non-GAAP Financial Highlights
•Net revenues were RMB1,080.5 million (US$170.4 million), down 20.1% YoY and 4.4% QoQ.
•Gross profit was RMB705.4 million (US$111.2 million), down 17.9% YoY and 2.9% QoQ. Gross margin was 65.3%, up from 63.5% in Q3 2011 and 64.2% in Q2 2012.
•Operating income was RMB324.2 million (US$51.1 million), down 25.1% YoY and 17.0% QoQ. Operating margin was 30.0%, compared with 32.0% in Q3 2011 and 34.6% in Q2 2012.
•Net income attributable to ordinary shareholders was RMB289.9 million (US$45.7 million), down 28.2% YoY and 13.9% QoQ.
•Earnings per diluted American Depositary Share ("ADS") were RMB1.04 (US$0.17), compared with RMB1.42 in Q3 2011 and RMB1.20 in Q2 2012.
GAAP Financial Highlights
•Net revenues were RMB1,080.5 million (US$170.4 million), down 20.1% YoY and 4.4% QoQ. •Online game revenues generated in China were RMB1,015.1 million (US$160.1 million), down 20.7% YoY and 2.4% QoQ.
•Other revenues were RMB65.4 million (US$10.3 million), down 9.3% YoY and 27.4% QoQ.
•Gross profit was RMB684.5 million (US$107.9 million), down 17.5% YoY and 2.9% QoQ. Gross margin was 63.4%, up from 61.3% in Q3 2011 and 62.4% in Q2 2012.
•Operating income was RMB280.6 million (US$44.3 million), down 22.4% YoY and 20.8% QoQ. Operating margin was 26.0%, compared with 26.7% in Q3 2011 and 31.4% in Q2 2012.
•Net income attributable to ordinary shareholders was RMB253.9 million (US$40.0 million), down 25.9% YoY and 17.7% QoQ.
•Earnings per diluted ADS were RMB0.92 (US$0.15), compared with RMB1.20 in Q3 2011 and RMB1.10 in Q2 2012.
Operating Highlights
•Average Monthly Active Users (average MAUs) for all games operated in China increased 6.2% QoQ to 18.4 million, mainly due to the release of content updates for certain major games during Q3 2012.
•Average Monthly Paying Users (average MPUs) for all games operated in China decreased 7.9% QoQ to 3.5 million. The sequential decrease was mainly due to the content updates released for major games which introduced a number of free functions and game play to users, resulting in a decline in low-spending paying accounts in Q3 2012.
•Monthly Average Revenue per Paying User (ARPU) for all games operated in China increased 6.0% QoQ to RMB95.7. The increase was primarily due to a decline in paying accounts during the quarter caused by reasons mentioned above.
"During the third quarter, we continued our strategy to decelerate monetization activities and enhance game play in order to lengthen the lifecycle of our games and pushed through a number of other initiatives to help revive our performance going forward," said Mr. Xiangdong Zhang, Chief Executive Officer of Shanda Games. "As a result, we have already started to see some traction as monthly active users rose 6.2% compared with the prior quarter. With an increasing number of users being introduced to our games, we believe that our growing portfolio of games and promising pipeline will continue to deliver sustainable growth over the long-term."
"In addition, we also look forward to the launch of a series of new games including 'RIFT,' 'World Zero,' 'Final Fantasy XIV 2.0' and 'Dungeon Striker,' which are progressing in various stages of development. The strong pipeline demonstrates our commitment to investing in our game portfolio and the efforts we have gone through to diversify our revenue streams and improve the health of our business overall."
"As we develop new content, we continue to expand resources to bring them overseas. We will launch 'Dragon Nest' in Europe soon and are leveraging the success it has had abroad to build our brand name globally, including the export of new titles such as 'Dungeon Striker.' Overseas revenue is critical to our long-term growth and the sustainability of our business."
"In recognition of the constantly changing gaming market, we are expanding our presence in the mobile game field, where we believe our brand name, operational expertise, distribution channels and financial strength will continue to serve as a core competitive advantage. By providing new ways to access our content, we hope to take our expertise to mobile and further broaden our reach."
"Looking ahead, we are confident that our 'All-Star, All-Region and All-Platform', or 'Triple-A', strategy will position us well for long-term growth. With our pipeline development, global expansion and mobile innovation on track, we expect the financial results to start to reflect the progress we have made in the coming quarters."
Third Quarter 2012 Unaudited Financial Results (GAAP)
Net Revenues. In the third quarter of 2012, Shanda Games reported net revenues of RMB1,080.5 million (US$170.4 million), compared with RMB1,352.8 million in the third quarter of 2011 and RMB1,130.5 million in the second quarter of 2012. Online game revenues generated in China and other revenues accounted for 93.9% and 6.1% of total net revenues, respectively.
Net revenues from online games operated in China declined 20.7% year-over-year and 2.4% quarter-over-quarter to RMB1,015.1 million (US$160.1 million) in the third quarter of 2012. The sequential decrease was primarily due to a decline in revenue from "AION" as the initial attraction surrounding the launch of its 3.0 expansion pack in March 2012 subsided, and a decline in revenue from "Woool" as the Company continued last quarter's strategy to decelerate the monetization of the game to ensure a longer and healthier lifecycle. This was partially offset by the first full quarter of revenue contribution from "Age of Wushu," an increase in revenue from "Dragon Nest" following the launch of an expansion pack in August, and positive seasonal effects on games during the third quarter of 2012.
Other revenues, which primarily represent net overseas revenues generated from game licensing, game operations, and advertising, were RMB65.4 million (US$10.3 million) in the third quarter of 2012, compared with RMB72.1 million in the third quarter of 2011 and RMB90.1 million in the second quarter of 2012. The quarter-over-quarter decrease in other revenues was primarily due to a decrease in advertising revenues related to cross-marketing activities in China during the third quarter of 2012.
Cost of Revenues. Cost of revenues for the third quarter of 2012 was RMB396.0 million (US$62.5 million), a decrease of 24.3% from RMB523.0 million in the third quarter of 2011 and 6.9% from RMB425.3 million in the second quarter of 2012. The quarter-over-quarter decrease was mainly attributable to a decrease in royalty fees paid to third parties as a result of lower revenues from licensed games and a decrease in platform fees, which are calculated based upon the Company's revenues, paid to Shanda Online. Cost of revenues represented 36.6% of net revenues, compared with 38.7% in the third quarter of 2011 and 37.6% in the second quarter of 2012.
Gross Profit. Gross profit for the third quarter of 2012 was RMB684.5 million (US$107.9 million), representing a decrease of 17.5% from RMB829.8 million in the third quarter of 2011 and 2.9% from RMB705.2 million in the second quarter of 2012. Gross margin was 63.4% in the third quarter of 2012, up from 61.3% in the third quarter of 2011 and 62.4% in the second quarter of 2012.
Operating Expenses. Total operating expenses for the third quarter of 2012 were RMB403.9 million (US$63.6 million), representing a decrease of 13.8% from RMB468.4 million in the third quarter of 2011 and an increase of 15.2% from RMB350.7 million in the second quarter of 2012. Operating expenses represented 37.4% of net revenues, compared with 34.6% in the third quarter of 2011 and 31.0% in the second quarter of 2012.
Product development expenses decreased 13.0% year-over-year and increased 8.2% quarter-over-quarter to RMB161.5 million (US$25.4 million) in the third quarter of 2012. The sequential increase in product development expenses was primarily due to an annual salary increase for research and development personnel during the third quarter of 2012. Product development expenses represented 14.9% of net revenues, compared with 13.7% in the third quarter of 2011 and 13.2% in the second quarter of 2012.
Sales and marketing expenses decreased 6.2% year-over-year and increased 17.2% quarter-over-quarter to RMB152.5 million (US$24.0 million) in the third quarter of 2012. The sequential increase was primarily due to an increase in service fees for distributing and marketing prepaid cards and a seasonal increase in marketing and promotional expenses for the summer holidays which occurred during the third quarter. Sales and marketing expenses represented 14.1% of net revenues, compared with 12.0% in the third quarter of 2011 and 11.5% in the second quarter of 2012.
General and administrative expenses decreased 25.2% year-over-year and increased 25.9% quarter-over-quarter to RMB89.9 million (US$14.2 million) in the third quarter of 2012. The sequential increase in general and administrative expenses was primarily due to (i) an impairment of certain assets as the Company initiated a series of restructuring measures and streamlined its previous investments during the third quarter of 2012, (ii) a net increase in bad debt expense due to the second quarter reversal of the bad debt provision previously recorded as a result of subsequent repayment of a loan, and (iii) an increase in share-based compensation expenses. The increases were partially offset by a decline in sales tax expenses associated with inter-company transactions during the third quarter of 2012. General and administrative expenses accounted for 8.3% of net revenues, compared with 8.9% in the third quarter of 2011 and 6.3% in the second quarter of 2012.
Share-based compensation expenses were RMB11.5 million (US$1.8 million) in the third quarter of 2012, compared with RMB30.4 million in the third quarter of 2011 and RMB3.9 million in the second quarter of 2012. The quarter-over-quarter increase was primarily a result of the repricing of underwater share options held by Company's officers and employees, which was partially offset by a decline in share-based compensation expenses due to the departure of senior executives during the third quarter of 2012.
Operating Income. Operating income for the third quarter of 2012 was RMB280.6 million (US$44.3 million), a decrease of 22.4% from RMB361.4 million in the third quarter of 2011 and 20.8% from RMB354.5 million in the second quarter of 2012. Operating margin was 26.0% in the third quarter of 2012, compared with 26.7% in the third quarter of 2011 and 31.4% in the second quarter of 2012.
Government Financial Incentives. Government financial incentives totaled RMB69.5 million (US$11.0 million) in the third quarter of 2012, compared with RMB43.6 million in the third quarter of 2011 and RMB16.9 million in the second quarter of 2012. The Company's receipt of government financial incentives is subject to time lags and inconsistent government administrative practices relating to the timing of payments.
Other Income (Expense), Net. Other expense for the third quarter of 2012 was RMB28.1 million (US$4.5 million), compared with other income of RMB3.0 million in the third quarter of 2011 and other income of RMB15.2 million in the second quarter of 2012. The quarter-over-quarter change was mainly due to a foreign exchange loss of RMB21.6 million (US$3.4 million) recognized in the third quarter of 2012, compared with a foreign exchange gain of RMB19.3 million in the second quarter of 2012. The change in foreign exchange gains and losses were mainly due to the unrealized exchange gains and losses related to the foreign currency forward contracts.
Income Tax Expense. Income tax expense for the third quarter of 2012 was RMB92.1 million (US$14.5 million), compared with RMB94.2 million in the third quarter of 2011 and RMB99.3 million in the second quarter of 2012.
Net Income Attributable to Ordinary Shareholders. Net income for the third quarter of 2012 was RMB253.9 million (US$40.0 million), a decrease of 25.9% from RMB342.6 million in the third quarter of 2011 and 17.7% from RMB308.4 million in the second quarter of 2012. Earnings per diluted ADS in the third quarter of 2012 were RMB0.92 (US$0.15), compared with RMB1.20 in the third quarter of 2011 and RMB1.10 in the second quarter of 2012.
Net Cash. In the third quarter of 2012 the Company generated RMB207.7 million (US$32.7 million) in cash flows from operating activities. The Company's cash and cash equivalent, short-term investments, restricted cash and time deposits, net of loans and dividend payable, increased from RMB3,036.6 million as of June 30, 2012 to RMB3,072.6 million (US$484.6 million) as of September 30, 2012.
Nine Months 2012 Unaudited Financial Results
Net Revenues. Net revenues for the first nine months of 2012 totaled RMB3,600.5 million (US$567.8 million), a decrease of 8.3% from RMB3,925.9 million in the first nine months of 2011.
Gross Profit. Gross profit for the first nine months of 2012 was RMB2,263.3 million (US$356.9 million), a decrease of 5.4% from RMB2,391.7 million in the first nine months of 2011. Gross margin was 62.9%, an increase from 60.9% in the first nine months of 2011.
Operating Income. Operating income for the first nine months of 2012 was RMB1,071.4 million (US$169.0 million), a decrease of 0.2% from RMB1,073.1 million in the first nine months of 2011. Operating margin was 29.8%, an increase from 27.3% in the first nine months of 2011.
Non-GAAP Operating Income. Non-GAAP operating income for the first nine months of 2012 was RMB1,208.0 million (US$190.5 million), a decrease of 6.1% from RMB1,285.8 million in the first nine months of 2011. Non-GAAP operating margin was 33.6%, an increase from 32.8% in the first nine months of 2011.
Net Income Attributable to Ordinary Shareholders. Net income for the first nine months of 2012 was RMB899.1 million (US$141.8 million), a decrease of 6.4% from RMB960.6 million in the first nine months of 2011. Net margin was 25.0%, increased from 24.5% in the first nine months of 2011. Earnings per diluted ADS were RMB3.22 (US$0.51), compared with RMB3.38 in the first nine months of 2011.
Non-GAAP Net Income Attributable to Ordinary Shareholders. Non-GAAP net income for the first nine months of 2012 was RMB1,008.6 million (US$159.1 million), a decrease of 11.7% from RMB1,142.0 million in the first nine months 2011. Non-GAAP net margin was 28.0%, compared with 29.1% in the first nine months of 2011. Non-GAAP earnings per diluted ADS were RMB3.62 (US$0.57), compared with RMB4.02 in the first nine months of 2011.
Net Cash. In the first nine months of 2012 the Company generated RMB1,172.8 million (US$185.0 million) in cash flows from operating activities. The Company's cash and cash equivalent, short-term investments, restricted cash and time deposits, net of loans and dividend payable, increased from RMB2,160.1 million as of December 31, 2011 to RMB3,072.6 million (US$484.6 million) as of September 30, 2012.
Recent Business Highlights
•August 30, 2012 - Shanda Games began unlimited closed-beta testing for the web version of "Woool of Paladin" (Han Jiang Chuan Shi), an in-house developed fantasy web game based on the Company's Woool franchise.
•August 31, 2012 - NHN Korea began a second round of closed-beta testing for "Dungeon Striker," an action MMORPG developed by Eyedentity Games, a Korea-based game studio under Shanda Games.
•September 14, 2012 - Shanda Games' board of directors approved to adjust the exercise price for the share options held by the officers and employees of the Company and its subsidiaries and operating companies in China. The new exercise price for these options is US $1.835 per Class A ordinary share, representing the average closing price of the Company's ADSs during the 15 consecutive trading days prior to September 14, 2012 divided by two.
•September 25, 2012 - Mail.Ru Group, a leading internet company in Russia, began commercial operation of Shanda Games' 3D MMORPG "Dragon Nest" in Russia.
•October 7, 2012 - Eyedentity Games signed a publishing agreement for "Dungeon Striker" with NHN Japan, a leading Japanese online game company. Pursuant to the agreement, NHN Japan will be the exclusive operator of "Dungeon Striker" in Japan.
•October 16, 2012 - Shanda Games and Square Enix, a leading game developer based in Japan, announced a mobile game partnership under which the two companies will share their resources and expertise in developing and operating mobile games. The partnership includes joint development for the mobile versions of "Final Fantasy I," "Final Fantasy II," "Final Fantasy III" and "Diffusion Million Arthur" for distribution in China, Taiwan, Korea, and Southeast Asia.
•October 16, 2012 - Eyedentity Games announced its first mobile game "Dragon Nest: Labyrinth." Based on the popular PC-based MMORPG "Dragon Nest," "Dragon Nest: Labyrinth" has adopted the same fast-paced action and battle system of the original PC game. New features such as real-time multiplayer, leveling system and player community have been added in order to enhance the gaming experience on mobile platforms. The game is expected to launch in 2013.
•October 23, 2012 - Shanda Games began the first round of closed-beta testing in Mainland China for "RIFT," a 3D MMORPG licensed from Trion World.
Share Repurchase
In June 2012, the Company's Board of Directors approved a share repurchase program under which the Company is authorized to repurchase up to $100 million worth of its outstanding ADSs during the next twelve (12) months. As of November 23, 2012, the Company has repurchased approximately 10.9 million ADSs for an aggregate consideration of US$40 million
GAME 3Q earnings 11-26-12 AMC
Shanda Games to Report Third Quarter 2012 Financial Results on November 27, 2012 (Beijing/Hong Kong Time)
Tuesday , November 20, 2012 09:00ET
HONG KONG, Nov. 20, 2012 /PRNewswire/ -- Shanda Games Limited ("Shanda Games") (NASDAQ: GAME), a leading online game developer, operator and publisher in China, will announce its unaudited financial results for the third quarter ended September 30, 2012 on Tuesday, November 27, 2012 Beijing/Hong Kong Time.
The earnings release will be available on Shanda Games' investor relations website at http://ir.shandagames.com/.
Shanda Games' management team will host a conference call on Tuesday, November 27, 2012 at 9:00 am (Beijing/Hong Kong Time) / Monday, November 26, 2012 at 8:00 pm (Eastern Time) to present an overview of the Company's financial performance and business operations.
Here's a mystery:
This Online Gaming Stock Looks Good for the Long Run
By Harsh Chauhan - September 4, 2012
http://beta.fool.com/techjunk13/2012/09/04/online-gaming-stock-looks-good-long-run/10966/?ticker=GAME&source=eogyholnk0000001
Harsh is a member of The Motley Fool Blog Network -- entries represent the personal opinions of our bloggers and are not formally edited.
The online gaming companies in China have had a difficult time this earnings season. A few of them, such as NetEase (NASDAQ: NTES) and Perfect World, were hammered into the ground after their results and outlook failed to satisfy the Street. But some, like Shanda Games (NASDAQ: GAME) and Giant Interactive (NYSE: GA), have managed to buck the trend and have saved their investors from the agony of a stock price plunge.
A Slight Pullback
Shanda Games’ second quarter results were a mixed bag, with the game developer beating the bottom line estimate and falling short on the top line. A drop in subscriber count has been a common problem for the game developers this earnings season and the same problem haunted Shanda as well.
Revenue from online games operated in China and abroad declined in the quarter as the company didn’t go all out to monetize its games in the quarter and focused on improving the life cycle of its legacy games. Moreover, Shanda also cited macroeconomic uncertainty as a reason it is treading cautiously and keeping its cards close to the chest.
Catalysts Ahead
As a result, Shanda decided to wait before releasing any new titles or expansion packs in the previous quarter, believing that its games would have a better chance of doing well in the second half of the year. But the company wasn’t sitting idle in the quarter as it continued to improve its existing games in order to extend their life cycle.
In addition, Shanda follows a very methodical strategy of growing its business, known as the Triple-A strategy, which I had discussed in detail the last time. In concurrence with this strategy, the company has a number of games that it intends to release going forward, such as Dungeon Striker, Ghosts 'n Goblins, Age of Dawn and Age of Wushu among others. Apart from these, Shanda is also slated to launch the improved versions of Woool and Mir II in the future.
Spreading it out
More importantly, Shanda has a diversified portfolio of games and is looking to reduce its dependence on a single game. Almost one-third of its revenue is derived from Mir II. While releasing an upgraded version of this game would most probably give Shanda a shot in the arm, the company knows the pitfalls of depending on one game for a major portion of its revenue. Hence, its efforts towards diversifying its revenue base are certainly a positive. It has received encouraging feedback for Age of Wushu and the expansion packs for Dragon Nest and Woool and expects these games to take some burden off from Mir II.
Mobile Gaming – the Next Big Thing
Also, Shanda is focusing on launching its games to other platforms as well. It intends to release Legend of Immortals and Mir II in micro-client versions, which should further improve its audience. And the company is going mobile and released the mobile version of Woool, known as Woool of Paladin last month. The game has been quite a rage initially as it was downloaded more than a million times and still counting.
But what’s more, Shanda has 10 more mobile games in the pipeline. We have already seen Glu Mobile (NASDAQ: GLUU) profit immensely from mobile gaming. Glu’s top line has been on a rapid surge of late and the company is set to do more going forward. While Shanda isn’t Glu class yet in mobile gaming, its focus on mobile games is surely a positive as it would drive its top line higher.
Don’t Blame the Industry
I agree that the bygone quarter hasn’t been a stellar one for online gaming in the Middle Kingdom, but the potential is huge. The faltering results of the game developers aren’t exactly a result of a weakness in the gaming industry. For example, NetEase had a troubled quarter as Activision Blizzard’s (NASDAQ: ATVI) World of Warcraft, which NetEase operates in China, saw a fall in subscriber count. However, WoW is expected to get up to speed again when Activision releases the next expansion pack this month.
On the other hand, the strength of the industry can be seen through Giant Interactive’s performance. Although the company didn’t release any games or new expansion packs in the previous quarter, its top line went north along with the number of active playing accounts. In addition, a bulky dividend yield of around 6% is another reason you could take a look at Giant.
The Takeaway
Shanda is coming off a mixed quarter and expects its top line to diminish slightly again in the current quarter. However, the company is focused on delivering shareholder value in the long-term and is working towards its goal with a well laid out strategy. In addition, Shanda is the third largest player in the online gaming market in China and stands to gain immensely from the industry’s growth through its strategic moves.
Shanda Games Reports Second Quarter 2012 Unaudited Results
http://www.knobias.com/story.htm?eid=3.1.27ab05b52389dc07ed385a17e51f821bb6d0cffe0edbf55f5a3a0974464e7f5e
Sunday , August 26, 2012 16:30ET
HONG KONG, Aug. 26, 2012 /PRNewswire-Asia-FirstCall/ -- Shanda Games Limited ("Shanda Games," or the "Company") (NASDAQ: GAME), a leading online game developer, operator and publisher in China, today announced its unaudited consolidated financial results for the second quarter ended June 30, 2012.
Non-GAAP Financial Highlights
-- Net revenues were RMB1,130.5 million (US$178.7 million), down 14.4% YoY
and 18.6% QoQ.
-- Operating income was RMB390.8 million (US$61.8 million), down 10.6% YoY
and 20.7% QoQ. Operating margin was 34.6%, compared with 33.1% in Q2
2011 and 35.5% in Q1 2012.
-- Net income attributable to ordinary shareholders was RMB336.8 million
(US$53.2 million), down 9.0% YoY and 11.8% QoQ. Net margin was 29.8%,
up from 28.0% in Q2 2011 and 27.5% in Q1 2012.
-- Earnings per diluted ADS were RMB1.20 (US$0.19), compared with RMB1.30
in Q2 2011 and RMB1.36 in Q1 2012.
GAAP Financial Highlights
-- Net revenues were RMB1,130.5 million (US$178.7 million), down 14.4% YoY
and 18.6% QoQ.
-- Online game revenues generated in China were RMB1,040.4 million
(US$164.5 million), down 16.6% YoY and 19.3% QoQ.
-- Other revenues were RMB90.1 million (US$14.2 million), up 23.3% YoY
and down 10.6% QoQ.
-- Operating income was RMB354.5 million (US$56.1 million), down 1.9% YoY
and 18.7% QoQ. Operating margin was 31.4%, compared with 27.4% in Q2
2011 and 31.4% in Q1 2012.
-- Net income attributable to ordinary shareholders was RMB308.4 million
(US$48.8 million), up 1.0% YoY and down 8.4% QoQ. Net margin was 27.3%,
up from 23.1% in Q2 2011 and 24.2% in Q1 2012.
-- Earnings per diluted ADS were RMB1.10 (US$0.17), compared with RMB1.08
in Q2 2011 and RMB1.20 in Q1 2012.
Operating Highlights
During the first quarter of 2012, the Company decelerated the monetization of "Mir II" and "Woool" in order to improve gameplay and prolong a healthy life cycle for each of the games. In addition, the Company delayed the launch of a major expansion pack for "Dragon Nest" until the third quarter of 2012. Due to these adjustments and the typical seasonal weakness inherent in the second quarter, the Company experienced a quarter-over-quarter decline in online game user numbers and ARPU.
-- Average Monthly Active Users (average MAUs) for all games operated in
China were 17.3 million in Q2 2012, compared with 19.1 million in Q1
2012.
-- Average Monthly Paying Users (average MPUs) for all games operated in
China were 3.8 million in Q2 2012, compared with 4.3 million in Q1 2012.
-- Monthly Average Revenue per Paying User (ARPU) for all games operated in
China was RMB90.3 in Q2 2012, compared with RMB99.9 in Q1 2012.
                         Non-GAAP Quarterly Results
                                                                                     (in millions, except for per share data)
                                                                                     ---------------------------------------
                                                                                        Q2 2011                    Q1 2012                    Q2 2012
                                                                                         (RMB)                      (RMB)                      (RMB)          (US$)       QoQ
                                                                                          ----                       ----                       ----          ----        ---
     Net Revenues                                                                                1,320.5                    1,389.4                   1,130.5       178.7     -18.6%
     ------------                                                                                -------                    -------                   -------       -----     -----
     Gross Profit                                                                                  830.2                      899.8                     726.2       114.8     -19.3%
     ------------                                                                                  -----                      -----                     -----       -----     -----
     Operating Income                                                                              437.2                      492.9                     390.8        61.8     -20.7%
     ----------------                                                                              -----                      -----                     -----        ----     -----
     Government Financial Incentives                                                                10.4                       10.1                      16.9         2.7      67.3%
     -------------------------------                                                                ----                       ----                      ----         ---      ----
     Net Income Attributable to Ordinary Shareholders                                              370.3                      381.8                     336.8        53.2     -11.8%
     ------------------------------------------------                                              -----                      -----                     -----        ----     -----
     Earnings Per Diluted ADS                                                                       1.30                       1.36                      1.20        0.19
     ------------------------                                                                       ----                       ----                      ----        ----
     Non-GAAP results exclude share-based compensation, amortization of acquisition-related intangible assets and the related income tax effects.
     --------------------------------------------------------------------------------------------------------------------------------------------
GAAP Quarterly Results
                                                      (in millions, except for per share data)
                                                       ---------------------------------------
                                                                          Q2 2011                 Q1 2012               Q2 2012
                                                                 (RMB)                      (RMB)                 (RMB)                 (US$)       QoQ
                                                                 ----                       ----                  ----                  ----        ---
     Net Revenues                                                                  1,320.5                1,389.4               1,130.5       178.7     -18.6%
     ------------                                                                  -------                -------               -------       -----     -----
     Gross Profit                                                                    800.7                  873.6                 705.2       111.5     -19.3%
     ------------                                                                    -----                  -----                 -----       -----     -----
     Operating Income                                                                361.5                  436.3                 354.5        56.1     -18.7%
     ----------------                                                                -----                  -----                 -----        ----     -----
     Government Financial Incentives                                                  10.4                   10.1                  16.9         2.7      67.3%
     -------------------------------                                                  ----                   ----                  ----         ---      ----
     Net Income Attributable to Ordinary Shareholders                                305.2                  336.8                 308.4        48.8      -8.4%
     ------------------------------------------------                                -----                  -----                 -----        ----      ----
     Earnings Per Diluted ADS                                                         1.08                   1.20                  1.10        0.17
     ------------------------                                                         ----                   ----                  ----        ----
GAME 2Q earnings 8-26-12 (Sunday)
Shanda Games to Report Second Quarter 2012 Financial Results on August 27, 2012 (Beijing/Hong Kong Time)
- Earnings Conference Call to be Held on Monday, August 27, 2012 at 9:00 am (Beijing/Hong Kong Time) / Sunday, August 26, 2012 at 9:00 pm (Eastern Time)
HONG KONG, Aug. 17, 2012 /PRNewswire-Asia-FirstCall/ -- Shanda Games Limited ("Shanda Games") (GAME), a leading online game developer, operator and publisher in China, will announce its unaudited financial results for the second quarter 2012 ended June 30, 2012 on Monday, August 27, 2012 Beijing/Hong Kong time.
Thank you for the GAME video chart!
As usual - It was great to be walked thru it!
GAME Video Chart 7/16/2012
http://www.missionir.com/videos.html
Shanda Games (GAME) Announces $100M Buyback Program
http://www.streetinsider.com/Stock+Buybacks/Shanda+Games+%28GAME%29+Announces+%24100M+Buyback+Program/7509008.html
Shanda Games (Nasdaq: GAME) announces the Board has approved a $100 million ADS buyback program.
Shanda Games Reports First Quarter 2012 Unaudited Results
-- Company Sets New Quarterly Top Line Record Despite Seasonally Slow Quarter --
http://finance.yahoo.com/news/shanda-games-reports-first-quarter-203000353.html
HONG KONG, June 11, 2012 /PRNewswire-Asia-FirstCall/ -- Shanda Games Limited ("Shanda Games", or the "Company") (GAME), a leading online game developer, operator and publisher in China, today announced its unaudited consolidated financial results for the first quarter ended March 31, 2012.
Non-GAAP Financial Highlights
•Net revenues were RMB1,389.4 million (US$220.7 million), up 10.9% YoY and 2.5% QoQ.
•Gross profit was RMB899.8 million (US$143.0 million), up 13.8% YoY and 4.2% QoQ. Gross margin was 64.8%, up from 63.1% in Q1 2011 and 63.7% in Q4 2011.
•Operating income was RMB492.9 million (US$78.3 million), up 18.6% YoY and 11.3% QoQ. Operating margin was 35.5%, up from 33.2% in Q1 2011 and 32.7% in Q4 2011.
•Net income attributable to ordinary shareholders was RMB381.8 million (US$60.7 million), up 3.6% YoY and 13.8% QoQ.
•Earnings per diluted ADS were RMB1.36 (US$0.22), compared with RMB1.30 in Q1 2011 and RMB1.20 in Q4 2011.
GAAP Financial Highlights
•Net revenues were RMB1,389.4 million (US$220.7 million), up 10.9% YoY and 2.5% QoQ. •Online game revenues generated in China were RMB1,288.6 million (US$204.7 million), up 8.7% YoY and 2.1% QoQ.
•Other revenues were RMB100.8 million (US$16.0 million), up 49.8% YoY and 7.2% QoQ.
•Gross profit was RMB873.6 million (US$138.8 million), up 14.8% YoY and 4.7% QoQ. Gross margin was 62.9%, up from 60.8% in Q1 2011 and 61.5% in Q4 2011.
•Operating income was RMB436.3 million (US$69.4 million), up 24.6% YoY and 8.8% QoQ. Operating margin was 31.4%, up from 27.9% in Q1 2011 and 29.6% in Q4 2011.
•Net income attributable to ordinary shareholders was RMB336.8 million (US$53.4 million), up 7.6% YoY and 10.7% QoQ.
•Earnings per diluted ADS were RMB1.20 (US$0.19), compared with RMB1.10 in Q1 2011 and RMB1.08 in Q4 2011.
Operating Highlights
•Average Monthly Active Users (average MAUs) for games operated in China were 19.1 million, compared with 20.4 million in Q4 2011.
•Average Monthly Paying Users (average MPUs) for games operated in China were 4.3 million, compared with 4.5 million in Q4 2011.
•Monthly Average Revenue per Paying User (ARPU) for games operated in China was RMB99.9, compared with RMB92.8 in Q4 2011.
"The first quarter of 2012 marked the first full year since we began implementing our 'All-Star, All-Platform and All-Region', or 'Triple-A' strategy," commented Mr. Alan Tan, Chairman and CEO of Shanda Games. "During this time, we have made important progress developing the key products and titles that have enabled us to not only maintain our position as China's leading online game company, but also expand further and deeper into new countries and territories. Our first quarter results demonstrate our determination to expand and diversify our portfolio of games at the same time as we invest in our pipeline and platform to deepen content offerings."
"During the quarter, we saw strong growth from 'Dragon Nest,' 'AION' and 'Legend of Immortals' following the release of major expansion packs and new in-game quests. Despite the negative seasonal effects related to the New Year and Chinese New Year holidays, we were further able to diversify our revenue streams through selected investment in our game portfolio. We also look forward to the launch of a series of new games such as 'Age of Wushu,' 'RIFT' and 'World Zero,' which are all progressing through the various stages of development. Additionally, we are excited by Eyedentity's second game, Dungeon Striker, which recently completed the first round of closed-beta testing in Korea and is expected to grab the attention of gamers across the globe."
"At the same time, we continue to utilize the latest technology to provide easy access to our games through the development of micro-client, browser and mobile games. These advances represent the next step in social connectivity and mobility for online games and allow our users to easily connect to our content on multiple devices."
"With the very best games supporting our expansion strategy, we have simultaneously pushed our strong portfolio out to various regions across the world. Following a successful launch in Thailand in late March, 'Dragon Nest' will soon be available in Russia and Indonesia during the third quarter. We also look forward to the launch of 'Legend of Immortals' in Vietnam later this year. Leveraging our investments in intellectual property abroad provide a new long-term revenue stream as we replicate our proven business model and expand into new markets."
"Looking forward, we believe investing in our strong game portfolio, platform and operations will provide us with new opportunities as we generate value for our shareholders over the long term and create a wealth of game experiences for our users around the world."
GAME 1Q earnings: This evening? Tomorrow morning?
Financial Results on June 12, 2012 (Beijing/Hong Kong Time)
- Earnings Conference Call to be Held on Tuesday, June 12, 2012 at 9:00 am (Beijing/Hong Kong Time) / Monday, June 11, 2012 at 9:00 pm (Eastern Time)
Press Release: Shanda Games Limited – Wed, Jun 6, 2012 8:00 AM
HONG KONG, June 6, 2012 /PRNewswire-Asia-FirstCall/ -- Shanda Games Limited ("Shanda Games") (GAME), a leading online game developer, operator and publisher in China, will announce its unaudited financial results for the first quarter 2012 ended March 31, 2012 on Tuesday, June 12, 2012 Beijing/Hong Kong time.
The earnings release will be available on Shanda Games' investor relations website at http://ir.shandagames.com/.
Shanda Games' management team will host a conference call on Tuesday, June 12, 2012 at 9:00 am (Beijing/Hong Kong time) / Monday, June 11, 2012 at 9:00 pm (Eastern Time) to present an overview of the Company's financial performance and business operations.
Shanda Games Opens Offline Store
17173.com, 4/17/12
Chinese online game developer and operator Shanda Games' (Nasdaq: GAME) first "Game Experience Store" held an opening ceremony in Kunshan, Jiangsu province on April 15.
The offline store aims primarily to provide gamers with an offline platform to try out games. Currently these include Shanda Games' "Legend" (Chuanqi) and Mir series, including The Legend of Mir, Mir 2 Sidestory, MyMir, and others. All of the games are available for playing in the store, and related props and models of in-game scenery are on display.
In the future, the store's offerings will expand to cover all of Shanda Games' titles, and will include a number of themed activities, along with quarterly and annual game tournaments, announcements of new game products, and other activities.
LOL. I hate secrets!
They kept it private..they didn’t even tell you?
:o)
Shanda (SNDA) Agrees to 'Going Private' Deal at $41.35/ADS
Zhejiang Daily Shares Soar By 10% Limit On Shanda Purchases (Update)
Russell Flannery, Forbes Staff
http://www.forbes.com/sites/russellflannery/2012/04/10/zhejiang-daily-shares-soar-by-10-limit-on-shanda-purchases-update/?partner=yahootix
Zhejiang Daily Media Group, a Hangzhou-based state-controlled media company , will pay 3.5 billion yuan, or $556 million, to buy two businesses from Shanda Interactive, the online gaming and entertainment company controlled by Chinese billionaire Chen Tianqiao that delisted from the Nasdaq earlier this year,
To help pay for the investment, the company also said today it will raise up to 2.5 billion yuan from existing and new investors in a stock offering. The rest of the needed money will come from unspecified internal sources.
Zhejiang Daily’s shares rose by their daily limit of 10% at the Shanghai Stock Exchange on the news. Trading was suspended on April 6 ahead of the announcement.
The move will facilitate the company’s expansion into social media from traditional media, according to an announcement at the Shanghai Stock Exchange.
It also comes at a time when China’s government is encouraging media and entertainment companies to expand overseas.
Zhejiang Daily will pay about $500 million for Hangzhou Bianfeng Network Technology, a casual game company, and the remainder for Shanghai Haofang, a developer of online game platforms.
Shanda Interactive has two affiliated companies trading in the U.S.: Shanda Games and Ku6 Media.
Chairman Chen Tianqiao ranked No. 1,075 on the 2012 Forbes Billionaires List with wealth of $1.1 billion.
–with Maggie Chen
Talk about being outta the loop - did you know SNDA went private?
ZZZZZZZZzzzzzzzzzzzzzzzzzzzzz
Someone wake me up!
The parent company went private? Did I know that and just forgot? lol
YIKES, if that was the case!
November 22, 2011 7:14 AM EST
http://www.streetinsider.com/Mergers+and+Acquisitions/Shanda+%28SNDA%29+Agrees+to+Going+Private+Deal+at+%2441.35ADS/6969266.html
completed on the 14th of Feb
http://www.streetinsider.com/Press+Releases/Shanda+Interactive+Entertainment+Limited+Announces+Completion+of+Merger/7174263.html
GAME is now an orphan. LOL
Macquarie Upgrades Shanda Games (GAME) Two Notches to Outperform
9:15 am ET 02/23/2012 - Street Insider
Macquarie's Steve Zhang upgraded shares of Shanda Games (NASDAQ: GAME) by two notches from Underperform to Outperform Thursday morning. The analyst boosted his target on the stock from $4 to $5
Shanda Games' CEO Discusses 4Q2011 Results - Earnings Call Transcript
http://seekingalpha.com/article/382211-shanda-games-ceo-discusses-4q2011-results-earnings-call-transcript?source=yahoo
Shanda Games Reports Fourth Quarter and Full Year 2011 Unaudited Results
Tuesday , February 21, 2012 16:30ET
HONG KONG, Feb. 21, 2012 /PRNewswire-Asia-FirstCall/ -- Shanda Games Limited ("Shanda Games" or the "Company") (NASDAQ: GAME), a leading online game developer, operator and publisher in China, today announced its unaudited consolidated financial results for the fourth quarter and full year ended December 31, 2011.
Q4 2011 Non-GAAP Financial Highlights
-- Net revenues were RMB1,356.0 million (US$215.2 million), up 17.7% YoY
and 0.2% QoQ.
-- Gross profit was RMB863.9 million (US$137.1 million), up 18.3% YoY and
0.5% QoQ. Gross margin was 63.7%, up from 63.4% in Q4 2010 and 63.5% in
Q3 2011.
-- Operating income was RMB443.0 million (US$70.3 million), up 13.5% YoY
and 2.3% QoQ. Operating margin was 32.7%, compared with 33.9% in Q4 2010
and 32.0% in Q3 2011.
-- Net income attributable to ordinary shareholders was RMB335.5 million
(US$53.3 million), down 20.5% YoY and 16.9% QoQ, primarily due to a
RMB134.0 million (US$21.3 million) accrued withholding tax associated
with dividends distribution from the Company's subsidiaries to their
holding companies overseas.
-- Earnings per diluted American Depositary Share ("ADS") were RMB1.20
(US$0.19), compared with RMB1.50 in Q4 2010 and RMB1.42 in Q3 2011.
Q4 2011 GAAP Financial Highlights
-- Net revenues were RMB1,356.0 million (US$215.2 million), up 17.7% YoY
and 0.2% QoQ.
-- Online game revenues generated in China were RMB1,262.0 million
(US$200.3 million), up 14.4% YoY and down 1.5% QoQ.
-- Other revenues were RMB94.0 million (US$14.9 million), up 89.1% YoY
and 30.4% QoQ.
-- Gross profit was RMB834.3 million (US$132.4 million), up 19.0% YoY and
0.5% QoQ. Gross margin was 61.5%, up from 60.8% in Q4 2010 and 61.3% in
Q3 2011.
-- Operating income was RMB400.9 million (US$63.6 million), up 23.4% YoY
and 10.9% QoQ. Operating margin was 29.6%, up from 28.2% in Q4 2010 and
26.7% in Q3 2011.
-- Net income attributable to ordinary shareholders was RMB304.3 million
(US$48.3 million), down 17.0% YoY and 11.2% QoQ, primarily due to a
RMB134.0 million (US$21.3 million) accrued withholding tax associated
with dividends distribution from the Company's subsidiaries to their
holding companies overseas.
-- Earnings per diluted ADS were RMB1.08 (US$0.17), compared with RMB1.30
in Q4 2010 and RMB1.20 in Q3 2011.
Q4 2011 Operating Highlights
-- Average Monthly Active Users (average MAUs) for games operated in China
were 20.4 million in Q4 2011, compared with 21.0 million in Q3 2011.
-- Average Monthly Paying Users (average MPUs) for games operated in China
were 4.5 million in Q4 2011, compared with 4.6 million in Q3 2011.
-- Monthly Average Revenue per Paying User (ARPU) for games operated in
China was RMB92.8 in Q4 2011, compared with RMB91.9 in Q3 2011.
Full Year 2011 Non-GAAP Financial Highlights
-- Net revenues increased 17.3% YoY to RMB5,281.9 million (US$838.3
million).
-- Gross profit increased 21.5% YoY to RMB3,344.0 million (US$530.8
million).
-- Operating income increased 11.4% YoY to RMB1,728.9 million (US$274.3
million).
-- Net income attributable to ordinary shareholders was essentially flat
YoY at RMB1,476.8 million (US$234.3 million), compared with RMB1,479.7
million in 2010.
-- Earnings per diluted ADS were RMB5.20 (US$0.82), compared with RMB5.18
in 2010.
Full Year 2011 GAAP Financial Highlights
-- Net revenues increased 17.3% YoY to RMB5,281.9 million (US$838.3
million).
-- Online game revenues generated in China increased 15.2% YoY to
RMB4,975.5 million (US$789.6 million).
-- Other revenues increased 64.9% YoY to RMB306.4 million (US$48.7
million).
-- Gross profit increased 20.9% YoY to RMB3,225.9 million (US$512.0
million).
-- Operating income increased 10.6% YoY to RMB1,474.0 million (US$233.9
million).
-- Net income attributable to ordinary shareholders was down 1.9% YoY to
RMB1,264.9 million (US$200.7 million).
-- Earnings per diluted ADS were RMB4.46 (US$0.70), compared with RMB4.52
in 2010.
"During the fourth quarter of 2011, we again delivered financial results that met our expectations and achieved multiple financial and operational records as our All-Star, All-Platform and All-Region strategy continues to yield strong results," said Mr. Alan Tan, Chairman and CEO of Shanda Games. "We expect great things from our strong portfolio of games, exciting pipeline, growing overseas presence and new platform as our execution of this strategy and our ability to innovate has now produced consecutive quarters of revenue growth."
"Our revenues have been more diversified as we strive to provide a constant stream of new content. In addition to the successful launch of Mir III in the fourth quarter, we were able to further expand our content offerings by partnering with Snail Game to jointly operate Age of Wushu and licensing RIFT from Trion Worlds for operation in China. We also look forward to the release of Woool II, a major expansion pack of our legacy game Woool this summer. In addition, we continued to make efforts in developing mobile games and launching new technologies that provide ease of access to our games through micro clients. We believe these recent developments combined with the anticipated launches of other high-quality games in our pipeline will ensure the strength of our portfolio and capture the attention of game players across China."
"The strength of our portfolio and pipeline has also significantly enhanced our global footprint this past quarter. Overseas revenue grew by 30% quarter-over-quarter and 89% year-over-year. This remarkable performance demonstrates our ability to identify and take advantage of opportunities for licensing, publishing and operating games in new regions. In addition to Singapore and the United States, Dragon Nest will soon be available in new regions including Thailand, Indonesia, Russia and Germany. Our licensing business has also accelerated with the successful launch of Legend of Immortals in Taiwan as well as Hades Realm II in Thailand along with plans to push further abroad into Germany and Russia later this year. By approaching each one of our games in a similar, innovative manner, we hope to ensure that they become popular hits that contribute to our portfolio and overseas revenue growth."
"The year 2011 was one of the busiest and most exciting years in Shanda Games' history, and we are pleased with where we are today as we look at our prospects for 2012 and beyond. As the online gaming market keeps growing with access in more regions and devices, we will continue to leverage our strong game portfolio, operating expertise and talent to create a richer gaming experience for players around the world."
 Unaudited Non-GAAP Quarterly Results
                          (in millions, except for per share data)


                                Q4 2010  Q3 2011          Q4 2011
                                 (RMB)    (RMB)   (RMB)   (US$)   QoQ
                                 -----    -----   -----   -----   ---
     Net Revenues                1,152.5  1,352.8 1,356.0   215.2    0.2%
     ------------                -------  ------- -------   -----    ---
     Gross Profit                  730.4    859.3   863.9   137.1    0.5%
     ------------                  -----    -----   -----   -----    ---
     Operating Income              390.3    433.1   443.0    70.3    2.3%
     ----------------              -----    -----   -----    ----    ---
     Government Financial
      Incentives                   124.8     43.6    97.7    15.5  124.1%
     --------------------          -----     ----    ----    ----  -----
     Net Income Attributable to
      Ordinary Shareholders        422.2    403.5   335.5    53.3  -16.9%
     --------------------------    -----    -----   -----    ----  -----
     Earnings Per Diluted ADS       1.50     1.42    1.20    0.19
     ------------------------       ----     ----    ----    ----


     Non-GAAP results exclude share-based compensation, amortization of
     acquisition-related intangible assets and the related income tax
     effects.
     ------------------------------------------------------------------
Unaudited GAAP Quarterly Results
                          (in millions, except for per share data)


                                Q4 2010  Q3 2011          Q4 2011
                                 (RMB)    (RMB)   (RMB)   (US$)   QoQ
                                 -----    -----   -----   -----   ---
     Net Revenues                1,152.5  1,352.8 1,356.0   215.2    0.2%
     ------------                -------  ------- -------   -----    ---
     Gross Profit                  701.0    829.8   834.3   132.4    0.5%
     ------------                  -----    -----   -----   -----    ---
     Operating Income              324.9    361.4   400.9    63.6   10.9%
     ----------------              -----    -----   -----    ----   ----
     Government Financial
      Incentives                   124.8     43.6    97.7    15.5  124.1%
     --------------------          -----     ----    ----    ----  -----
     Net Income Attributable to
      Ordinary Shareholders        366.6    342.6   304.3    48.3  -11.2%
     --------------------------    -----    -----   -----    ----  -----
     Earnings Per Diluted ADS       1.30     1.20    1.08    0.17
     ------------------------       ----     ----    ----    ----
 Quarterly Operating Statistics


                       Q1 2011    Q2 2011    Q3 2011    Q4 2011
                       -------    -------    -------    -------

     MAU (in millions)       20.3       24.0       21.0       20.4
     -----------------       ----       ----       ----       ----
     MPU (in millions)        4.6        4.4        4.6        4.5
     -----------------        ---        ---        ---        ---
     ARPU (RMB)              85.2       94.6       91.9       92.8
     ----------              ----       ----       ----       ----
  Unaudited Non-GAAP Annual Results
                          (in millions, except for per share data)


                                     2010                         2011
                                (RMB)     (RMB)     (US$)     YoY
                                -----     -----     -----     ---
     Net Revenues                 4,504.7   5,281.9     838.3     17.3%
     ------------                 -------   -------     -----     ----
     Gross Profit                 2,752.9   3,344.0     530.8     21.5%
     ------------                 -------   -------     -----     ----
     Operating Income             1,552.2   1,728.9     274.3     11.4%
     ----------------             -------   -------     -----     ----
     Government Financial
      Incentives                    232.3     185.0      29.4    -20.4%
     --------------------           -----     -----      ----    -----
     Net Income Attributable to
      Ordinary Shareholders       1,479.7   1,476.8     234.3     -0.2%
     --------------------------   -------   -------     -----     ----
     Earnings Per Diluted ADS        5.18      5.20      0.82
     ------------------------        ----      ----      ----


     Non-GAAP results exclude share-based compensation, amortization of
     acquisition-related intangible assets and the related income tax
     effects.
     ------------------------------------------------------------------
                               Unaudited GAAP Annual Results
                          (in millions, except for per share data)


                                     2010                         2011
                                (RMB)     (RMB)     (US$)     YoY
                                -----     -----     -----     ---
     Net Revenues                 4,504.7   5,281.9     838.3     17.3%
     ------------                 -------   -------     -----     ----
     Gross Profit                 2,667.5   3,225.9     512.0     20.9%
     ------------                 -------   -------     -----     ----
     Operating Income             1,332.9   1,474.0     233.9     10.6%
     ----------------             -------   -------     -----     ----
     Government Financial
      Incentives                    232.3     185.0      29.4    -20.4%
     --------------------           -----     -----      ----    -----
     Net Income Attributable to
      Ordinary Shareholders       1,288.8   1,264.9     200.7     -1.9%
     --------------------------   -------   -------     -----     ----
     Earnings Per Diluted ADS        4.52      4.46      0.70
     ------------------------        ----      ----      ----
GAME 4Q FY earnings 2-21-12 AMC
Shanda Games to Report Fourth Quarter and Full Year 2011 Financial Results on February 22, 2012 (Beijing/Hong Kong Time)
Today : Monday 13 February 2012
Shanda Games Limited ("Shanda Games") (Nasdaq: GAME), a leading online game developer, operator and publisher in China, will announce its unaudited financial results for the fourth quarter and full year 2011 ended December 31, 2011 on Wednesday, February 22, 2012 Beijing/Hong Kong time.
The earnings release will be available on Shanda Games' investor relations website at http://ir.shandagames.com/.
Shanda Games' management team will host a conference call on Wednesday, February 22, 2012 at 9:00 am (Beijing/Hong Kong time) / Tuesday, February 21, 2012 at 8:00 pm (Eastern Time) to present an overview of the Company's financial performance and business operations.
Shanda Games Brings 3D MMORPG RIFT to China
Today : Thursday 9 February 2012
Shanda Games Limited (Nasdaq: GAME, "Shanda Games") announced today that it has entered into an agreement with Trion Worlds, Inc. ("Trion Worlds"), a leading US-based game publisher and developer, for the exclusive license to operate its highly-anticipated 3D MMORPG "RIFT" in mainland China.
RIFT is a 3D fantasy-themed massively multiplayer online role-playing game (MMORPG) that offers highly polished game plays and deeply immersive experience to game players. The game has been well received by gamers since its release in the US and has won numerous recognitions from top game websites and organizations since publication, including "The Best MMO 2011 Award" by IGN.com, "The Best New MMO 2011 Award" by MMOPRG.com and "The Best New Online Game 2011 Award" by the U.S.A. Game Developers Conference (GDC).
"We are delighted to bring RIFT, Trion Worlds' much-acclaimed award-winning title, to China," said Mr. Alan Tan, Chairman and CEO of Shanda Games. "RIFT offers an adventurous online world with fantastic dynamic content and stunning graphics and has attracted many devoted fans worldwide. Based on our experience and expertise in the China market, we are excited about the upcoming launch of RIFT to our broad gamer audience and are confident in the success of RIFT in the China market."
"Our collaboration with Shanda Games is a huge step for Western premium games in China and we are proud that Trion Worlds is at the forefront," said Lars Buttler, Founder and CEO of Trion Worlds. "The appetite for great, new, original game experiences like RIFT, that disrupt the existing paradigm of traditional gaming, is universal. We believe that Shanda Games, with a proven track record of localizing and delivering content, is the best operator for Trion Worlds to offer gamers in China an authentic RIFT experience."
Stockcharts.com’s failure to respond is real disappointing.
Submitted the problem/inquiry last Saturday morning and here it is Thursday noon without receiving so much as an acknowledgement that they’ve received and will respond ASAP, etc, nothing whatsoever.
J, and/or anybody, if in the mood and want to inquire too it’s my understanding that one clicks on “Report Problem” far right option of those listed directly under the chart. At least that’s the way in which I did it last Saturday. …. http://stockcharts.com/h-sc/ui?s=game …. that turns into ….
http://stockcharts.com/support/techsupport.html?url=http%3A//stockcharts.com/h-sc/ui%3Fs%3DGAME%26p%3DD%26b%3D5%26g%3D0%26id%3Dp91019526939
My curiosity would get a kick out of hearing something from them soon.
Submitted inquiry directly to Stockcharts.com this morn.
Quasi suggested it.
Like You, I’m thinking any feedback/explanation could be interesting while most importantly need to get all the charting’s data consistent.
Otherwise, LOL… thanks for sharing stuff with me. You were first to let me look behind the wizard’s iBox magic curtain.
Moving averages… a, b, c,... “a” is H/L, which I have not taken the time to comprehend. I’ve never made alot about the charting publicly concerned that it might be taken away from us?
Regarding Buda’s charting, I have yet to try and force my brain to need to figure out the need to differentiate between using the more standard default (14) as opposed to specifically a (20) or some other specific (#)? Is (20) easier to equal ratio down…. (15), (10), (5) or up (25), (30), (35)? Or, a longer (20) duration provides less volatility than the (14) so best when using shorter intra-day periods, such as hourly, yet then again why specifically (20)? Didn’t change standard duration for MACD though?
In any event, will be interesting to watch. Lots for me to still learn.
Hope you’re having a wonderful weekend!
You are wonderful, as always, My Dear Friend! ;)
Baffling - right? I would love to know the answer - so thanks for doing that!
I'm playing with a 60 minute chart right now. Took me forever to figure out how to change the sma to the ema (LOL) and yet in the end it was so easy I felt like a dimwit.
I want to Thank you for making it possible for me to even play around with the charts. It's come in very handy!
New 60 minute chart: Still a work in progress but working off one Buda put on the simple board.
He likes to watch the hourly chart for an oversold reading before he takes a position. I would like to track that concept and see how it pans out. His main focus on that would be the STO crossing back above the 20 - certainly something I always use on a daily but not on an intraday chart. I don't place indicators/oscillators on intradays.
Looks like Jan 11th would have been a good entry based on an hourly?
Yet - I like the STOrsi on a daily and it started to peek out of a wedge around that dec 27th time frame and that would have peeked my interest clear back then.
I took your question over to the StockCharts.com board #msg-71397560
Hope you don’t mind.
Just when you think you have seen it all:
This is weird:
Finviz:
Stockcharts: Same time frame: Give or take a few days. Gap in one - no gap in the other. Numbers for highs don't match up.
Huh? Why is that? All this caused by the dividend? If so - you would think the diff between the 2 numbers would be 1.02 since that is what the dividend was.
I'm confused.
Nasdaq numbers: Bold are the numbers one can also see on the chart for this time frame? Nasdaq numbers actually match finviz numbers.
Date Open High Low Close/Last Volume
 14:47  3.81  3.83  3.75  3.80 148,943
 01/25/2012 3.83 3.85 3.64 3.81 468,447
 01/24/2012 3.96 3.98 3.81 3.81 432,895 Same on both (after div)
 01/23/2012 3.76 3.93 3.74 3.87 755,710
 01/20/2012 4.76 4.85 4.7 4.73 522,389  Different
 01/19/2012 4.71 4.88 4.6701 4.75 358,450  Different
 01/18/2012 4.43 4.68 4.41 4.66 273,799
 01/17/2012 4.5 4.58 4.35 4.46 399,484
 01/13/2012 4.33 4.5 4.31 4.46 738,129
 01/12/2012 3.97 4.33 3.93 4.33 462,159
insiders know its just going to go back up
One would think.
This is how they explained the reasoning behind it...
"As our current cash position exceeds the Company's short-term needs and we continue to generate strong free cash flow from operations, we are happy to announce this special dividend in an effort to return value to shareholders," said Mr. Alan Tan , Chairman and CEO of Shanda Games . "We intend to continue to make investments in our businesses and maintain our position as a leading innovator in the industry. We are confident in our long-term growth potential and ongoing ability to increase shareholder value."
ha...to pay a divvie like that they must be making money
If you were a chinese gamer...You would probably know all of these? ;)
http://www.shandagames.com/us-en/game/game.html#gametitle
if i was a gamer i would have heard of some of them....
lol...as long as it holds plan.
Shanda Games Receives 12 Awards at the 2011 China Game Industry Annual Conference and Announces Strategic Partnership with Snail Game
Press Release: Shanda Games Limited – Fri, Jan 20, 2012 5:00 AM
(This one was the last one they had and since I didn't have it on the board - I figured I would toss it on here)
HONG KONG, Jan. 20, 2012 /PRNewswire-Asia-FirstCall/ -- Shanda Games Limited ("Shanda Games") (Nasdaq: GAME - News), a leading online game developer, operator and publisher in China, announced today that Shanda Games received a total of twelve awards at the 2011 China Game Industry Annual Conference, held on January 9, 2012, in recognition of Shanda Games' outstanding contributions in the online game industry.
•Top Ten Most Anticipated Online Games: Dragon Ball Online, World Zero
•Top Ten Most Popular Online Games: Dragon Nest, Legend of Immortals
•Top Ten Most Popular Domestic Games: Legend of Immortals, The World of Legend
•Top Ten Most Popular Casual Games: Maple Story
•Top Ten Most Popular Domestic Mobile Games: Mobile version of The World of Legend
•Top Ten Chinese Game Company
•Top Chinese Game Company in Overseas Development
•Most Influential Figures in China's Game Industry: Alan Tan (Chairman and CEO of Shanda Games)
•Newly Promoted Figures in China's Game Industry: Guang Chen (Producer of Shanda Games)
Additionally, Shanda Games has entered into a definitive agreement with Suzhou Snail Electronics Corporation Limited ("Snail Game"), a leading online game developer and operator in China, regarding Age of Wushu, a 3D martial-arts adventure MMORPG developed by Snail Game. Pursuant to the agreement, Shanda Games will operate Age of Wushu with Snail Game, when Snail Game will be able to leverage Shanda Games expertise and resources for the game operation. Age of Wushu is one of the most anticipated 3D MMORPGs in China in 2012 and has received positive feedback from players since the close-beta testing in the fourth quarter of 2011.
"We are pleased to work with Snail Game, an online game company with strong content offerings," said Mr. Alan Tan, Shanda Games' Chairman and CEO. "This marks an important effort of Shanda Games to further cooperate with more content providers. We believe that the cooperation, which combines Shanda Games' operational expertise and Snail Game's game development, will be a win-win for both companies."
"We are confident the cooperation will foster fast growth for both companies," said Mr. Shi Hai, Snail Game's President and CEO. "We look forward to further strengthening our cooperation with Shanda Games."
Easy right? :)
ive used finz forever.
Another thing I use finviz for and you are right...slow news: or in this case - no news. LOL
http://finviz.com/quote.ashx?t=game
at this price i would like to see some news push it back to 5 but i cant find alot of info on what there doing....slow news
|
Followers
|
10
|
Posters
|
|
|
Posts (Today)
|
0
|
Posts (Total)
|
454
|
|
Created
|
09/23/09
|
Type
|
Free
|
| Moderators | |||

Shanda Games Limited (NASDAQ: GAME) is a leading online game developer, operator and publisher in China, with a mission
of becoming a leading global online game media platform. Shanda Games offers a diversified game portfolio, which includes
some of the most popular massively multiplayer online role-playing games (MMORPGs) and advanced casual games in China,
targeting a large and diverse community of users. Shanda Games manages and operates online games that are developed in-house,
co-developed with world-leading game developers, acquired through investments or licensed from third parties.
Shanda Games is mainly engaged in massively multiplayer online role-playing games (MMORPGs). It gained fast growths in revenue
and profit. Its revenue jumped 43% year on year to USD 322 million and net profit leapt 75% year on year to USD 98 million in the first
half of 2009.
Shanda Games Limited (IPO 9/25/09 @12.50)
![]()
![]()

![]()
![]()

![]()
![]()


| Volume | |
| Day Range: | |
| Bid Price | |
| Ask Price | |
| Last Trade Time: |


