 News
News  Market Data
  Discover
Support: 888-992-3836
Copyright © 2023 InvestorsHub Inc.


Register for free to join our community of investors and share your ideas. You will also get access to streaming quotes, interactive charts, trades, portfolio, live options flow and more tools.
25.00 stock $$$$$$ Let’s roll .
$ship $1.09 v -0.04 (-3.54%)
Volume: 10,388,681 @03/26/21 7:59:35 PM EDT
Warrants are usually delayed and the stock price has to move up or down enough to move them.
CRAZY how warrants are going opposite direction than stock. eom
CFO Stavros Gyftakos said "loan to value ratio is close to 50%" for SHIP's fleet. He mentioned that this was "conservative" and "sustainable" not including cash holdings...
at 36:00
Today's prospectus is related to the agreement with Jelco last year(?), I believe. It is mentioned in today's broadcast at 58:35
Ceo Stamatis Tsantanis believes these two factors could drive daily rates higher going forward , "upcoming environmental regulations"
for reduction of emissions to be enforced in 2023 would lead to "speed reduction of the global fleet by 10-15%" in addition to "lowest building order book in decades" leading to "conditions of a severe vessel supply squeeze"
Listen carefully to 45:14 if you are considering investing long-term
Seanergy SHIP has about $68,000,000 in cash... from the webcast at 57:00
Seanergy collects a net daily scrubber premium on top of the daily BCI(Baltic Capesize Index) rate on some of it's vessels. Didn't know this...
Championship BCI plus $1749
Lordship BCI plus $3755
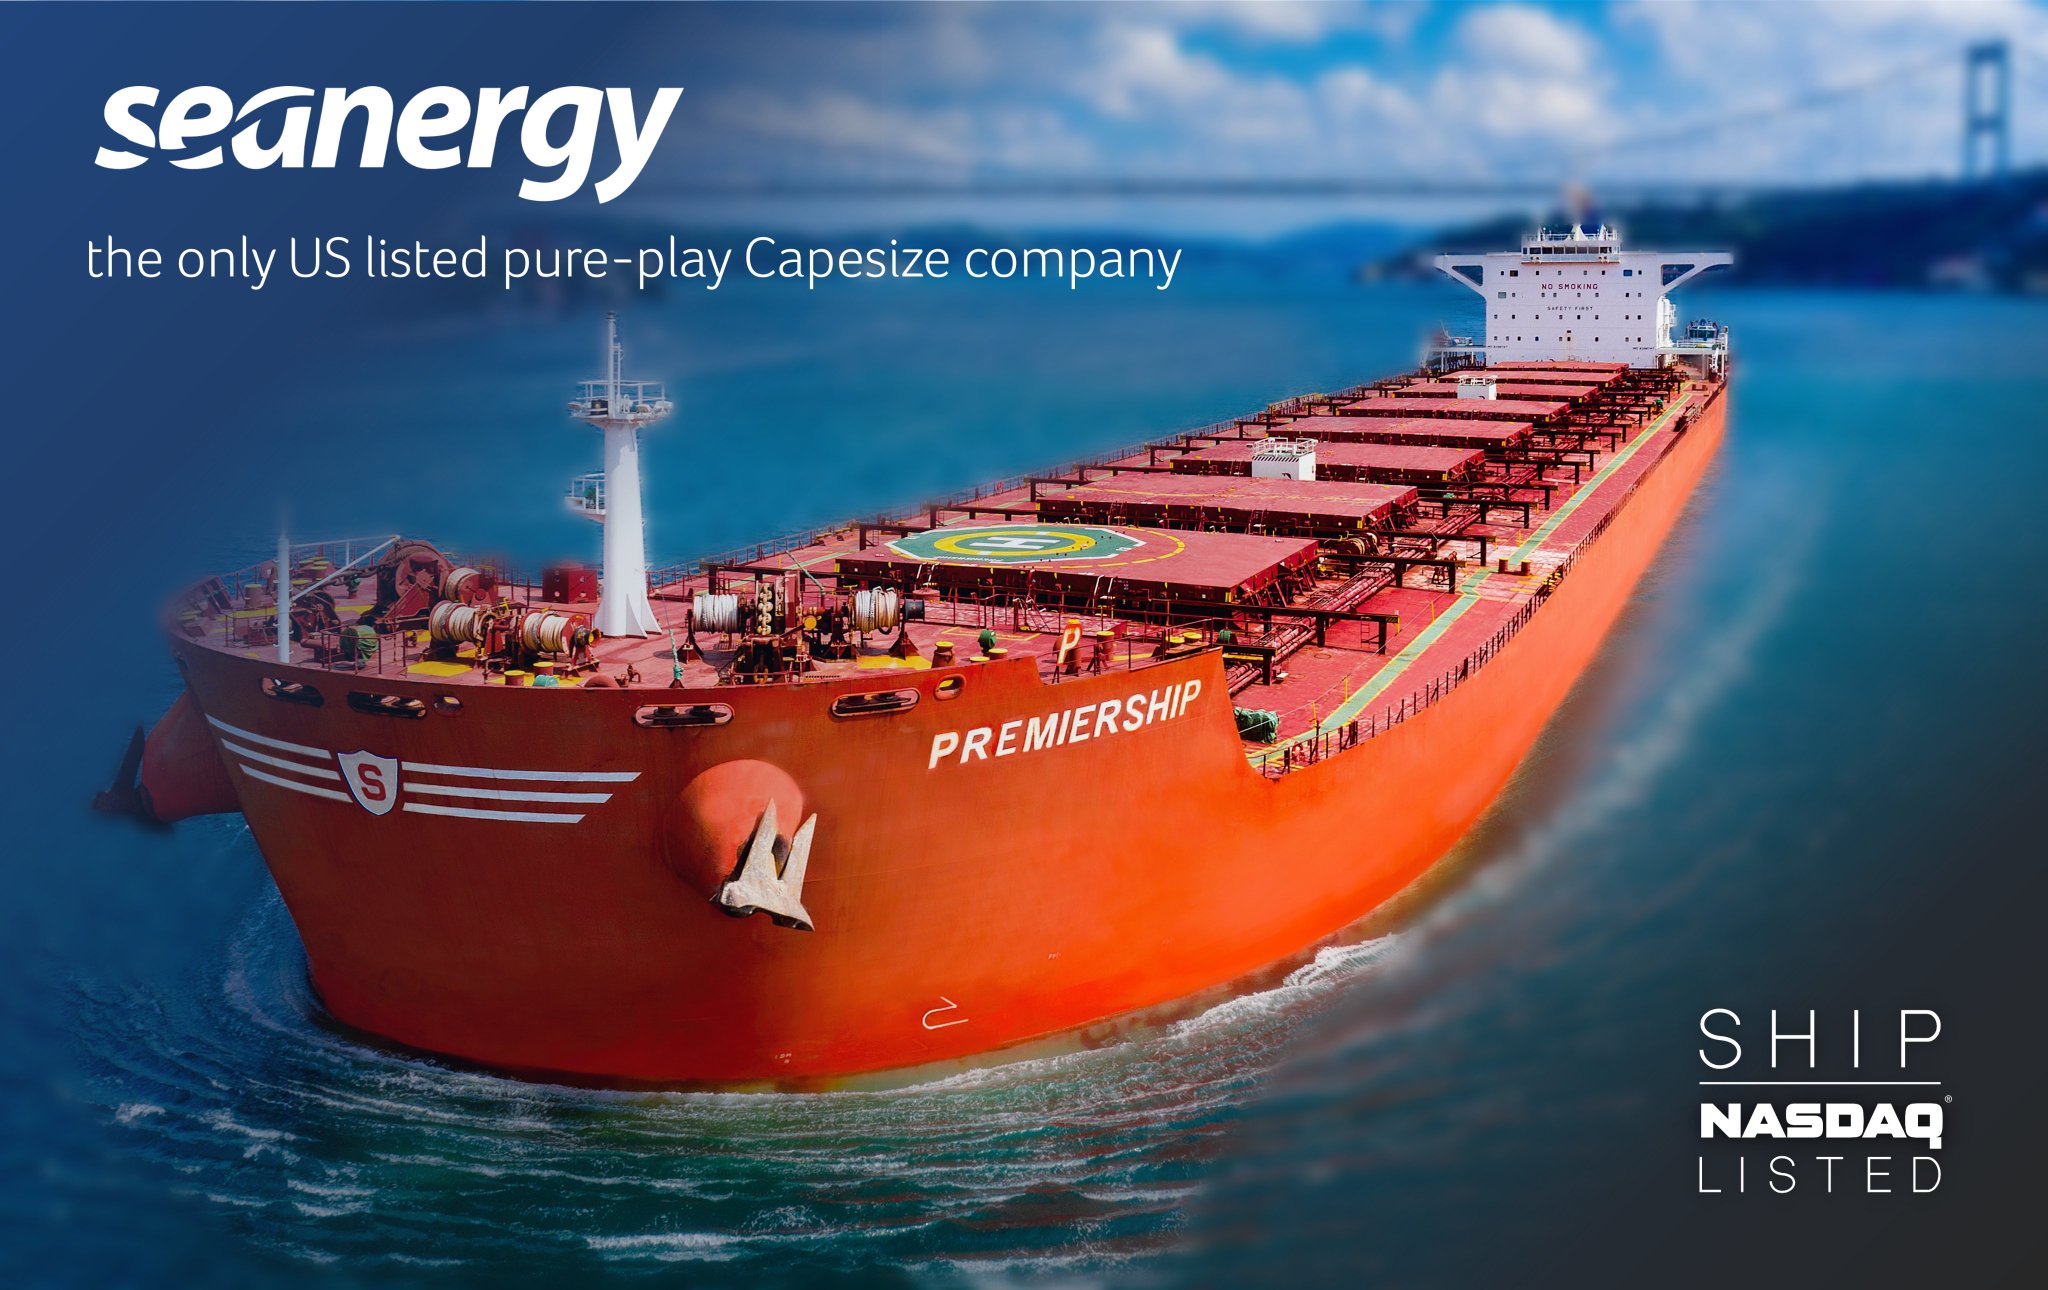
Premiership BCI plus $2055
Squireship BCI plus $2055

Seanergy Maritime Holdings Corp. Fourth Quarter 2020 Financial Results Audio Webcast
Financial Results for the Fourth Quarter and Twelve Months Ended December 31, 2020
March 24, 2021 09:00 ET | Source: Seanergy Maritime Holdings Corp.
Highlights of the Fourth Quarter of 2020:
Net revenues: $21.3 million in Q4 2020, compared to $27.8 million in Q4 2019
Net Loss of $2.3 million, or $0.7 million excluding one-off charges of $1.61 million, in Q4 2020, compared to a net income of $3.1 million in Q4 2019
EBITDA1: $8.3 million in Q4 2020, compared to $11.9 million in Q4 2019
Highlights of Full Year 2020:
Net revenues: $63.3 million in 2020, compared to $86.5 million in 2019
Net Loss: $18.4 million in 2020, as compared to $11.7 million in 2019
EBITDA1: $19.9 million in 2020, as compared to $23.8 million in 2019
Shareholders’ equity of $95.7 million on December 31, 2020, compared to $29.9 million on December 31, 2019
Recent Developments:
Fleet growth of 40% in the last 9 months with agreements to acquire four high-quality Japanese-built Capesize vessels
Successful completion of $179 million financial restructuring amicably with the underlying lenders
Compliance with NASDAQ’s minimum bid price requirement achieved organically, through share price appreciation
$75 million gross proceeds from a registered direct offering priced at-the-market increasing shareholders’ equity further
$33.6 million early repayment of a senior and junior loan facilities
GLYFADA, Greece, March 24, 2021 (GLOBE NEWSWIRE) -- Seanergy Maritime Holdings Corp. (“Seanergy” or the “Company”) (NASDAQ: SHIP) announced today its financial results for the fourth quarter and twelve months ended December 31, 2020.
For the quarter ended December 31, 2020, the Company generated net revenues of $21.3 million, representing a 23.3% decrease compared to the corresponding quarter of 2019. The time charter equivalent rate (“TCE”)1 earned during the fourth quarter of 2020 was $16,511, decreased by 28% from $22,935 in the fourth quarter of 2019, which is mainly attributable to the decrease of the Baltic Capesize Index (“BCI”) in the corresponding quarters. The Company recorded a net loss of $2.3 million compared to net income of $3.1 million in the same quarter of 2019, which includes one-off cash and non-cash charges amounting to $1.6 million associated with the financial restructuring of the Company.
For the twelve-month period ended December 31, 2020, net revenues amounted to $63.3 million, a 27% decrease compared to $86.5 million in the same period in 2019. The TCE earned during 2020 was $11,950, representing a 19% decrease when compared to a TCE of $14,694 in 2019 which compares favorably with the year-on-year percentage decrease in the 5-time charter (“T/C”) route average of the BCI of 27.5%. The average daily vessel operating expenses (“OPEX”) of the fleet for the twelve-month period of 2020 was $5,709, marking a 10% increase when compared with the respective figure for 2019 of $5,172.
Cash and cash-equivalents, restricted cash and term deposits, as of December 31, 2020 stood at $23.7 million, compared to $14.6 million as of December 31, 2019. Shareholders’ equity at the end of the fourth quarter of 2020 was $95.7 million, compared to $29.9 million at the end of the fourth quarter of 2019.
First Quarter 2021 TCE Guidance:
As of the date hereof, approximately 98% of our fleet operating days in the first quarter of 2021 have been fixed at a TCE of approximately $16,0002, or 89% higher compared to the $8,481 TCE recorded in the first quarter of 2020.
____________________
1 Earnings Before Interest, Taxes, Depreciation and Amortization ("EBITDA") and Time Charter Equivalent rate (“TCE”) are non-GAAP measures. Please see the reconciliation below of EBITDA to Net Income/ (Loss) and TCE to Net revenues from vessels, in each case the most directly comparable U.S. GAAP measure.
2 For vessels on index-linked T/Cs, the TCE assumed for the remaining operating days is equal to the FFA rate for the respective period. Spot estimates are provided using the load-to-discharge method of accounting. Load-to-discharge accounting recognizes revenues over fewer days as opposed to the discharge-to-discharge method of accounting used prior to 2018, resulting in higher rates for these days and only voyage expenses being recorded in the ballast days. Over the duration of the voyage (discharge-to-discharge) there is no difference in the total revenues and costs to be recognized. The rates quoted are for days currently contracted. Increased ballast days at the end of the quarter will reduce the additional revenues that can be booked based on the accounting cut-offs and therefore the resulting TCE will be reduced accordingly.
Stamatis Tsantanis, the Company’s Chairman and Chief Executive Officer, stated:
“We are very pleased that Seanergy has successfully turned the corner of a very challenging year in 2020 and has emerged as a stronger enterprise for the years to come. From a historical perspective, our results for the fourth quarter of 2020 were affected by a short-lived softening of the market, as well as by one-off cash and non-cash charges associated with our successful financial restructuring.
Overall, 2020 was marked by the severe consequences of the outbreak of the COVID-19 pandemic. The resulting volatility in day-rates reflected ?n the earnings of our fleet, especially in the first half of the year. Our average TCE for Q4 was $16,511 per day, largely in line with the respective performance of the BCI which averaged $16,944 per day in the same period. However, due to the weakness of the first half, our daily TCE for 2020 stood at $11,950, decreasing by 19% compared to the previous year. This had a proportional effect on our EBITDA which decreased by 17% year-over-year, from $23.8 million for 2019 to $19.9 million for 2020.
During this highly challenging market environment, we took decisive steps to successfully execute on our strategic plan to position Seanergy for the long-term. We have grown our fleet with well-timed acquisitions of high-quality vessels, while seizing the opportunity to overhaul our balance sheet, providing the Company with a solid financial footing going forward.
In light of the volatile market conditions, we took swift actions to strengthen our liquidity. These actions facilitated the successful restructuring of $179 million of our debt, including our junior loans and convertible notes. As part of this restructuring, loan maturities due in 2020 were extended by two to four years at improved terms, providing Seanergy with a clean runway and financial flexibility. In addition, the refinancing of two of our vessels at a discount, in combination with our accelerated debt repayments, have resulted in an impressive $37.6 million year-over-year reduction in our overall debt.
Furthermore, within the third quarter of 2020 and while market conditions were improving, we took delivery of the M/V Goodship, a 2005-built Japanese unit, which we agreed to acquire earlier in the year at what has proven to be a historically low price. We also completed a sixth scrubber installation on the M/V Knightship in cooperation with Glencore, the charterer of the vessel, who compensated the Company for 100% of the scrubber investment.
Moving into 2021, the Capesize market has taken a strong upward turn, which we expect to be sustainable in the next years. The BCI has averaged in excess of $16,000 per day year-to-date, in a trend that is defying the seasonality patterns of the last 7 years, indicating potentially strong forward momentum. We believe the outlook for the next two years is very strong, supported by solid demand driven by a considerable growth in infrastructure projects in the post-COVID era. Vessel supply fundamentals are also very favorable with the lowest vessel orderbook of the last 17 years, as amplified by the catalytic effect of the upcoming environmental regulations.
Supported by the strong performance of the Capesize market, in the first quarter of 2021 so far, we successfully implemented our strategic plan to grow our fleet’s carrying capacity by 28%, while drastically deleveraging our balance sheet. In the beginning of the year, we regained compliance with Nasdaq’s minimum bid price requirement organically, without reverting to a reverse stock split. Subsequently, we completed a $75.0 million common equity offering priced at-the-market under Nasdaq rules, with strong institutional demand and in a solid valuation environment. The proceeds facilitated $33.6 million in additional debt repayments as well as the acquisition of three high-quality Japanese-built vessels.
These newly acquired vessels, M/Vs Tradership, Flagship and Patriotship, are expected to be delivered to us within the second quarter of the year, in what we expect to be a further improved market environment, increasing our fleet to 14 units. Moreover, we have committed two additional vessels in long term index-linked time-charters with leading miners and dry bulk operators, commencing in the second quarter of the year, ensuring that our fleet will timely capitalize on the improving market conditions.
Relating to the implementation of our ESG agenda, we are one of the first publicly listed companies to complete the evaluation of our fleet for compliance with the upcoming Energy Efficiency Existing Ship Index (“EEXI”) regulation for greenhouse gas emissions. We were pleased with the outcome of the evaluation which revealed no significant impact on, or expenses for, our fleet to comply with such regulations. On the same front, we joined the “Neptune Declaration on Seafarer Wellbeing and Crew Change,” a maritime industry initiative focusing on, among other things, facilitating crew changes during the pandemic and ongoing port restrictions. This matter has been brought out as the most important social aspect of the pandemic in our industry.
Concluding, over the last 15 months, we have managed to successfully navigate Seanergy through the challenging operating environment of 2020, implementing a number of strategic initiatives with positive transformational effect on our Company. We strengthened our equity base, reduced our debt and enhanced our liquidity while at the same time achieved greater scale and broadened our revenue generating capacity with the acquisition of high-quality vessels. Seanergy is today in what we believe to be an optimal financial position allowing the Company to better capitalize on improving market conditions with the goal of creating substantial value for our investors.”
Company Fleet:
Vessel Name Vessel Size
Class Capacity
(DWT) Year Built Yard Scrubber
Fitted Employment Type Minimum
T/C
duration
Partnership Capesize 179,213 2012 Hyundai Yes T/C Index Linked (1) 3 years
Championship Capesize 179,238 2011 Sungdong Yes T/C Index Linked (2) 5 years
Lordship Capesize 178,838 2010 Hyundai Yes T/C Index Linked (3) 3 years
Premiership Capesize 170,024 2010 Sungdong Yes T/C Index Linked (4) 3 years
Squireship Capesize 170,018 2010 Sungdong Yes T/C Index Linked (5) 3 years
Knightship Capesize 178,978 2010 Hyundai Yes T/C Index Linked (6) 3 years
Gloriuship Capesize 171,314 2004 Hyundai No T/C Index Linked (7) 13 months
Fellowship Capesize 179,701 2010 Daewoo No T/C Index Linked (8) 1 year
Geniuship Capesize 170,058 2010 Sungdong No T/C Index Linked (9) 10 months
Leadership Capesize 171,199 2001 Koyo – Imabari No Voyage/Spot
Goodship Capesize 177,536 2005 Mitsui Engineering No Voyage/Spot
Tradership (10) Capesize 176,925 2006 Japanese Shipyard No N/A
Flagship (11) Capesize 176,387 2013 Japanese Shipyard No N/A
Patriotship (12) Capesize 181,709 2010 Japanese Shipyard Yes N/A
(1) Chartered by a major European utility and energy company and delivered to the charterer on September 11, 2019 for a period of minimum 33 to maximum 37 months with an optional period of about 11 to maximum 13 months. The daily charter hire is based on the BCI. In addition, the Company has the option to convert to a fixed rate for a period of between 3 and 12 months, based on the prevailing Capesize Forward Freight Agreement Rate (“FFA”) for the selected period.
(2) Chartered by Cargill. The vessel was delivered to the charterer on November 7, 2018 for a period of employment of 60 months, with an additional period of about 24 to about 27 months at the charterer’s option. The daily charter hire is based on the BCI plus a net daily scrubber premium of $1,740. In addition, the time charter provides the option to convert the index linked rate to a fixed rate for a period of between 3 and 12 months based on the Capesize FFA for the selected period.
(3) Chartered by a major European utility and energy company and delivered on August 4, 2019 for a period of minimum 33 to maximum 37 months with an optional period of 11-13 months. The daily charter hire is based on the BCI plus a net daily scrubber premium of $3,735 until May 2021. In addition, the Company has the option to convert to a fixed rate for a period of between three and 12 months, based on the prevailing Capesize FFA for the selected period.
(4) Chartered by Glencore and was delivered to the charterer on November 29, 2019 for a period of minimum 36 to maximum 42 months with two optional periods of minimum 11 to maximum 13 months. The daily charter hire is based on the BCI plus a net daily scrubber premium of $2,055.
(5) Chartered by Glencore and was delivered to the charterer on December 19, 2019 for a period of minimum 36 to maximum 42 months with two optional periods of minimum 11 to maximum 13 months. The daily charter hire is based on the BCI plus a net daily scrubber premium of $2,055.
(6) Chartered by Glencore and delivered to the charterer on May 15, 2020 for a period of about 36 to about 42 months with two optional periods of minimum 11 to maximum 13 months. The daily charter hire is based on the BCI.
(7) Chartered by Pacbulk Shipping and delivered to the charterer on April 23, 2020 initially for a period of about 10 to about 14 months. Upon expiration of the current T/C period, in June 2021, the vessel will commence the second extension period up to minimum January 1, 2022 to maximum April 30, 2022. The daily charter hire is based on the BCI. In addition, the Company has the option to convert to a fixed rate, based on the prevailing Capesize FFA for the selected period.
(8) Chartered by Anglo American, a leading global mining company, and expected to be delivered to the charterer on towards the beginning of June 2021 for a period of minimum 12 to maximum 15 months from the delivery date. The daily charter hire is based on the BCI. In addition, the Company has the option to convert to a fixed rate for a period of minimum three and maximum 12 months, based on the prevailing Capesize FFA for the selected period.
(9) Chartered by Pacbulk Shipping and expected to be delivered to the charterer towards the end of March 2021 for a period of about 10 to about 14 months from the delivery date. The daily charter hire is based on the BCI. In addition, the Company has the option to convert to a fixed rate based on the prevailing Capesize FFA for the selected period.
(10) Expected delivery in June 2021.
(11) Expected delivery in April 2021.
(12) Expected delivery in May 2021.
Fleet Data:
(U.S. Dollars in thousands)
Q4 2020 Q4 2019 FY 2020 FY 2019
Ownership days (1) 1,012 920 3,807 3,650
Available days (2) 1,012 838 3,755 3,417
Operating days (3) 1,010 835 3,747 3,393
Fleet utilization (4) 99.8% 90.8% 98.4% 93.0%
TCE (5) $16,511 $22,935 $11,950 $14,694
Daily Vessel Operating Expenses (6) $6,087 $5,584 $5,709 $5,172
(1) Ownership days are the total number of calendar days in a period during which the vessels in a fleet have been owned or chartered in under sale and lease back transactions.
(2) Available days are the number of ownership days less the aggregate number of days that the vessels are off-hire due to dry-dockings, special and intermediate surveys, or lay-up days.
(3) Operating days are the number of available days in a period less the aggregate number of days that the vessels are off-hire due to unforeseen circumstances. Operating days includes the days that our vessels are in ballast voyages without having finalized agreements for their next employment.
(4) Fleet utilization is the percentage of time that the vessels are generating revenue and is determined by dividing operating days by ownership days for the relevant period.
(5) TCE is defined as the Company’s net revenue less voyage expenses during a period divided by the number of the Company’s operating days during the period. Voyage expenses include port charges, bunker (fuel oil and diesel oil) expenses, canal charges and other commissions. The Company includes the TCE, a non-GAAP measure, as it believes it provides additional meaningful information in conjunction with net revenues from vessels, the most directly comparable U.S. GAAP measure, and because it assists the Company’s management in making decisions regarding the deployment and use of the Company’s vessels and in evaluating their financial performance. The Company’s calculation of TCE may not be comparable to that reported by other companies. The following table reconciles the Company’s net revenues from vessels to the TCE.
(In thousands of U.S. Dollars, except operating days and TCE)
Q4 2020 Q4 2019 FY 2020 FY 2019
Net revenues from vessels 21,313 27,769 63,345 86,499
Less: Voyage expenses 4,637 8,618 18,567 36,641
Net operating revenues 16,676 19,151 44,778 49,858
Operating days 1,010 835 3,747 3,393
TCE 16,511 22,935 11,950 14,694
(6) Vessel operating expenses include crew costs, provisions, deck and engine stores, lubricants, insurance, maintenance and repairs. Daily Vessel Operating Expenses are calculated by dividing vessel operating expenses by ownership days for the relevant time periods. The Company’s calculation of daily vessel operating expenses may not be comparable to that reported by other companies. The following table reconciles the Company’s vessel operating expenses to daily vessel operating expenses.
(In thousands of U.S. Dollars, except ownership days and Daily Vessel Operating Expenses)
Q4 2020 Q4 2019 FY 2020 FY 2019
Vessel operating expenses 6,206 5,137 22,347 18,980
Less: Pre-delivery expenses 46 - 611 104
Vessel operating expenses before pre-delivery expenses 6,160 5,137 21,736 18,876
Ownership days 1,012 920 3,807 3,650
Daily Vessel Operating Expenses 6,087 5,584 5,709 5,172
Net Income / (Loss) to EBITDA Reconciliation:
(In thousands of U.S. Dollars)
Q4 2020 Q4 2019 FY 2020 FY 2019
Net (loss) / income (2,319 ) 3,098 (18,356 ) (11,698 )
Add: Net interest and finance cost 6,677 5,623 23,217 23,632
Add: Depreciation and amortization 3,897 3,199 15,040 11,860
Add: Taxes - 22 - 54
EBITDA 8,255 11,942 19,901 23,848
EBITDA represents the sum of net income / (loss), interest and finance costs, interest income, depreciation and amortization and, if any, income taxes during a period. EBITDA is not a recognized measurement under U.S. GAAP.
EBITDA is presented as the Company believes that these measures are useful to investors as a widely used means of evaluating operating profitability. EBITDA as presented here may not be comparable to similarly titled measures presented by other companies. These non-GAAP measures should not be considered in isolation from, as a substitute for, or superior to, financial measures prepared in accordance with U.S. GAAP.
Interest and Finance Costs to Cash Interest and Finance Costs Reconciliation:
(In thousands of U.S. Dollars)
Q4 2020 Q4 2019 FY 2020 FY 2019
Interest and finance costs, net (6,677 ) (5,623 ) (23,217 ) (23,632 )
Add: Amortization of deferred finance charges 219 104 757 978
Add: Amortization of convertible note beneficial conversion feature 1,645 1,021 5,518 3,713
Add: Amortization of other deferred charges 120 1,455 550 3,907
Add: Cash interest waived - related party - - - 1,164
Add: Fair value of units – related party
(one-off expenses relating to the financial restructuring) 596 - 596 -
Cash interest and finance costs (4,097 ) (3,043 ) (15,796 ) (13,870 )
Add: Restructuring expenses 1,012 - 1,012 -
Cash interest and finance costs, net of restructuring expenses (3,085 ) (3,043 ) (14,784 ) (13,870 )
Fourth Quarter and Recent Developments:
Compliance with Nasdaq Minimum Bid Price Requirement
On February 11, 2021, the Nasdaq Stock Market confirmed that the Company has regained compliance with Nasdaq Listing Rule 5550(a)(2), concerning the minimum bid price of the Company’s common stock.
$179 million Financial Restructuring
Jelco Loans and Notes Extensions & Amendments
On December 30, 2020, the Company entered into definitive documentation with Jelco Delta Holding Corp. (“Jelco”), the Company’s sole junior creditor, concerning $27.2 million of maturities falling due in 2020 and the settlement of accrued and unpaid interest through December 31, 2020. Pursuant to this agreement, $6.5 million of principal indebtedness under one of the Jelco loans was repaid on December 31, 2020, while all other maturities were extended to December 2024. In connection with the restructuring, the Company agreed to certain mandatory prepayment obligations, pursuant to which $12.0 million of principal under the Jelco loans was prepaid in the first quarter of 2021. In addition, Jelco has agreed to the reduction of the applicable interest rate across all Jelco loans and notes to a fixed rate of 5.5%.
Seanergy and Jelco agreed to the settlement of all accrued and unpaid interest through December 31, 2020 and other fees payable to Jelco in an aggregate amount of approximately $5.6 million, through a private placement of units consisting of one common share (or one pre-funded warrant in lieu of one common share) and one warrant to purchase one common share. These securities were issued on January 8, 2021.
UniCredit Bank AG Extension and Amendments
On February 8, 2021, the Company entered into a supplemental agreement to the facility with UniCredit Bank AG secured by two of its vessels, the M/V Fellowship and the M/V Premiership. Pursuant to the supplemental agreement, (i) the maturity date of the facility was extended from December 29, 2020 to December 29, 2022, (ii) the quarterly installments were reduced from $1.55 million to $1.2 million, effective as of the December 2020 installment, (iii) the applicable margin was increased from 3.2% to 3.5% with effect from December 29, 2020 until the maturity of the facility and (iv) various financial covenants and value maintenance provisions were cancelled. The supplemental agreement became effective on February 9, 2021.
Amsterdam Trade Bank Amendments
On February 12, 2021, the Company entered into a supplemental agreement to the facility with Amsterdam Trade Bank N.V. secured by one of its vessels, the M/V Partnership. Pursuant to the supplemental agreement, the value maintenance provisions and certain financial covenants were amended. The supplemental agreement became effective on February 16, 2021.
Fleet Compliance Evaluation for the Upcoming Greenhouse Gas Regulation
On February 9, 2021, the Company announced the completion of the evaluation of the EEXI of its vessels in preparation for the upcoming Greenhouse Gas Emissions regulations. In cooperation with one of the leading classification societies, DNV, Seanergy completed the evaluation of the EEXI for its fleet, pursuant to the outcome of which it expects that its existing fleet will remain compliant with applicable greenhouse gas emissions regulatory requirements until 2030 with no material cost for the Company.
Registered Direct Offering
On February 19, 2021, the Company completed a registered direct offering of 44,150,000 of its common shares to certain unaffiliated institutional investors for aggregate gross proceeds of approximately $75.0 million. The equity offering was priced at $1.70 per share.
Capesize Vessel Acquisitions
In February 2021, the Company entered into an agreement to acquire a 2006 Japanese-built Capesize vessel from an unaffiliated third party. The vessel will be renamed M/V Tradership and is expected to be delivered to the Company in the second quarter of 2021.
In March 2021, the Company entered into agreements with unaffiliated third parties to purchase two additional Capesize vessels. The first vessel was built in 2013 at a reputable shipyard in Japan, has a cargo-carrying capacity of approximately 176,000 deadweight tons (“dwt”) and shall be renamed M/V Flagship. The vessel is expected to be delivered to the Company by the end of April 2021, subject to the satisfaction of certain customary closing conditions.
The second vessel was built in 2010 at a reputable shipyard in Japan, has a cargo-carrying capacity of approximately 182,000 dwt and shall be renamed M/V Patriotship. The vessel is expected to be delivered to the Company by the end of May 2021, subject to the satisfaction of certain customary closing conditions.
The special survey and ballast water treatment system installation for all three vessels were completed recently by the current owners and therefore the Company does not anticipate incurring significant capital expenditure for these vessels at least for the next two years. Moreover, M/V Patriotship is fitted with an exhaust gas cleaning system, or scrubber.
The aggregate purchase price for the three vessels is approximately $72 million and is expected to be funded with cash on hand or by a combination of cash on hand and proceeds from new loan facilities. The Company is in discussions with leading financial institutions to finance part of the acquisition cost at competitive financing terms, however, there can be no assurance that the Company will enter into any such financing arrangements. Following their delivery, the size of the Company’s fleet will increase to 14 Capesize vessels with an aggregate cargo capacity of approximately 2.5 million dwt.
Full Prepayment of a Senior Credit Facility and Two Junior Loan Facilities
On March 5, 2021, the Company fully prepaid the credit facility with Entrust Global secured by a first priority mortgage on the M/V Lordship. The outstanding balance of the facility was $21.6 million, the initial earliest maturity date was in June 2023, and the average applicable coupon was approximately 10%. The prepayment amount was funded with cash on hand. Following the prepayment and assuming no refinancing of the M/V Lordship, the interest savings for the Company are expected to be $1.3 million for the remaining of 2021 and $1.8 million on average per year for 2022-23. Additionally, annual repayments will be reduced by approximately $2.5 million on average.
In February 2021, a total of $12.0 million prepayment has been applied against the full repayment of two junior/unsecured loans and a partial repayment of a third junior unsecured loan, pursuant to the mandatory prepayment terms of those facilities following the closing of the $75 million registered direct offering and several Class E warrant exercises. The applicable interest rate of these loans was 5.5%, resulting in expected annual interest savings of approximately $660,000.
Update on Number of Shares Issued and Outstanding
As of March 23, 2021, the Company has 155,104,455 common shares issued and outstanding.
Seanergy Maritime Holdings Corp.
Unaudited Condensed Consolidated Balance Sheets
(In thousands of U.S. Dollars)
December 31,
2020 December 31,
2019*
ASSETS
Cash and cash equivalents, restricted cash and term deposits 23,651 14,554
Vessels, net 256,737 253,781
Other assets 14,857 14,216
TOTAL ASSETS 295,245 282,551
LIABILITIES AND STOCKHOLDERS’ EQUITY
Long-term debt and other financial liabilities 169,762 207,303
Convertible notes 14,516 14,608
Other liabilities 15,273 30,782
Stockholders’ equity 95,694 29,858
TOTAL LIABILITIES AND STOCKHOLDERS’ EQUITY 295,245 282,551
* Derived from the audited consolidated financial statements as of the period as of that date
Seanergy Maritime Holdings Corp.
Unaudited Condensed Consolidated Statements of Operations
(In thousands of U.S. Dollars, except for share and per share data, unless otherwise stated)
Three months ended
December 31, Twelve months ended
December 31,
2020 2019 2020 2019*
Revenues:
Vessel revenues 22,182 28,758 65,682 89,523
Commissions (869 ) (989 ) (2,337 ) (3,024 )
Vessel revenue, net 21,313 27,769 63,345 86,499
Expenses:
Voyage expenses (4,637 ) (8,618 ) (18,567 ) (36,641 )
Vessel operating expenses (6,206 ) (5,137 ) (22,347 ) (18,980 )
Management fees (279 ) (247 ) (1,052 ) (989 )
General and administrative expenses (1,925 ) (1,798 ) (6,607 ) (5,989 )
Depreciation and amortization (3,897 ) (3,199 ) (15,040 ) (11,860 )
Operating income / (loss) 4,369 8,770 (268 ) 12,040
Other expenses:
Interest and finance costs, net (6,677 ) (5,623 ) (23,217 ) (23,632 )
Gain on debt refinancing (6 ) - 5,144 -
Other, net (5 ) (49 ) (15 ) (106 )
Total other expenses, net: (6,688 ) (5,672 ) (18,088 ) (23,738 )
Net (loss) / income (2,319 ) 3,098 (18,356 ) (11,698 )
Net (loss) / income per common share, basic (0.03 ) 1.85 (0.55 ) (12.21 )
Weighted average number of common shares outstanding, basic 67,904,450 1,674,709 33,436,278 958,297
* Derived from the audited consolidated financial statements as of the period as of that date
About Seanergy Maritime Holdings Corp.
Seanergy Maritime Holdings Corp. is the only pure-play Capesize ship-owner publicly listed in the US. Seanergy provides marine dry bulk transportation services through a modern fleet of Capesize vessels. Upon delivery of the new vessels, the Company's operating fleet will consist of 14 Capesize vessels with an average age of 12 years and aggregate cargo carrying capacity of approximately 2,461,138 dwt.
The Company is incorporated in the Marshall Islands and has executive offices in Glyfada, Greece. The Company's common shares trade on the Nasdaq Capital Market under the symbol "SHIP", its Class A warrants under "SHIPW" and its Class B warrants under “SHIPZ”.
Please visit our company website at: www.seanergymaritime.com
Forward-Looking Statements
This press release contains forward-looking statements (as defined in Section 27A of the Securities Act of 1933, as amended, and Section 21E of the Securities Exchange Act of 1934, as amended) concerning future events. Words such as "may", "should", "expects", "intends", "plans", "believes", "anticipates", "hopes", "estimates" and variations of such words and similar expressions are intended to identify forward-looking statements. These statements involve known and unknown risks and are based upon a number of assumptions and estimates, which are inherently subject to significant uncertainties and contingencies, many of which are beyond the control of the Company. Actual results may differ materially from those expressed or implied by such forward-looking statements. Factors that could cause actual results to differ materially include, but are not limited to, the Company's operating or financial results; the Company's ability to continue as a going concern; the Company’s liquidity, including its ability to service its indebtedness; competitive factors in the market in which the Company operates; shipping industry trends, including charter rates, vessel values and factors affecting vessel supply and demand; future, pending or recent acquisitions and dispositions, business strategy, areas of possible expansion or contraction, and expected capital spending or operating expenses; risks associated with operations outside the United States; risks associated with the length and severity of the ongoing novel coronavirus (COVID-19) outbreak, including its effects on demand for dry bulk products and the transportation thereof; and other factors listed from time to time in the Company's filings with the SEC, its most recent annual report on Form 20-F. The Company's filings can be obtained free of charge on the SEC's website at www.sec.gov. Except to the extent required by law, the Company expressly disclaims any obligations or undertaking to release publicly any updates or revisions to any forward-looking statements contained herein to reflect any change in the Company's expectations with respect thereto or any change in events, conditions or circumstances on which any statement is based.
For further information please contact:
Seanergy Investor Relations
Tel: +30 213 0181 522
E-mail: ir@seanergy.gr
Capital Link, Inc.
Daniela Guerrero
230 Park Avenue Suite 1536
New York, NY 10169
Tel: (212) 661-7566
E-mail: seanergy@capitallink.com
https://www.globenewswire.com/en/news-release/2021/03/24/2198546/0/en/Seanergy-Maritime-Holdings-Corp-Reports-Financial-Results-for-the-Fourth-Quarter-and-Twelve-Months-Ended-December-31-2020.html
Update on Number of Shares Issued and Outstanding
As of March 23, 2021, the Company has 155,104,455 common shares issued and outstanding.
The reality is if you own nasdaq stocks and we going to reach 14,100 soon then holding is the best option.If nasdaq is going to fall bellow 12,609 then the safest move is to sell all your nasdaq stocks and go all cash.
Forget SHIP for the moment because that is what you are really betting on right now.
We are in a mini recession right now.
I did not expect the earnings to be good at all.
It is not fair to judge nasdaq stocks during a mini or long recession.They look worse than they actually are.
If nasdaq was at 14,500 and ship was still struggling than the fears/concern would be more justified.
This is one reason why most traders/investors should have most of their bankroll in OTC stocks because recessions are little to no factor on most of them in my eyes.
OTC is way more appealing than nasdaq right now.
If you or anyone doesnt like OTC your other option is to sell everything and go all cash and literally wait for nasdaq to reach 14,500 and buy back in.This alone makes everything much safer for you.
The other option is to wait for a 6 month upward nasdaq trend and buy in.This is what I do after long recessions where there is no chance it will reach the previous high soon.
They probably didn't even buy any. Lol
Yup! SHIP goes up when it should go down. And
goes down most of the time.
I wonder if they subtracted the $$millions
they paid for those "new" ships and the paid
off loans from the earnings. BEFORE they
reported them in these "earnings".
This is one of the most manipulated stocks money can buy. It and it's Greek sister TOPS have done the RS dance more times than pretty much any stock that I've ever followed.. I think it has a cult following.
This (disaster) makes no sense compared to everything that
has been reported in last few months. ALL POSITIVE!
Does this earning analysis look as awful as it seems?
OUCH! [coming Wed - tomorrow]
Earnings And Revenue
Analysts are expecting Seanergy Maritime Hldgs to report a loss of $0.02 per share. Revenue will likely be around $22.32 million, according to the consensus estimate. In the same quarter last year, Seanergy Maritime Hldgs reported EPS of $0.12 on revenue of $27.77 million.
Why Analyst Estimates And Earnings Surprises Are Important
Analysts who cover this company will publish forward-looking estimates of its revenue and EPS each quarter. Averaging together every EPS and revenue prediction that each analyst makes about a company in a quarter yields the "consensus estimates." A company posting earnings or revenue above or below the consensus estimate is known as an "earnings surprise" and may move the stock by a considerable margin.
If the company were to match the consensus estimate when it reports Wednesday, EPS would have fallen 116.67%. Sales would be down 19.62% from the same quarter last year. Here is how the company's reported EPS has stacked up against analyst estimates in the past:
Quarter Q3 2020 Q2 2020 Q1 2020
EPS Estimate 0.12 -0.54 -0.27
EPS Actual -0.02 -0.65 -0.31
Revenue Estimate 19.94 M 13.94 M 23.13 M
Revenue Actual 19.65 M 9.04 M 13.34 M
Stock Performance
Over the past 52-week period, shares of Seanergy Maritime Hldgs have declined 57.91%. Given that these returns are generally negative, long-term shareholders are probably a little upset going into this earnings release.
Do not be surprised to see the stock move on comments made during its conference call. Seanergy Maritime Hldgs is scheduled to hold the call at 11:00:00 ET and can be accessed here.
Baltic Dry Index is at 2281
https://seekingalpha.com/symbol/BDIY:IND
CAPE daily earnings $19.5k today! Strongest Dry bulk market in 13 Years and strongest Cape market Q1 in 7 years. @Seanergy_SHIP is the only US listed pure play cape company #shipping #capesize $SHIP pic.twitter.com/qWknaqwj2O
— Seanergy (@Seanergy_SHIP) March 19, 2021
I was able to buy my first caveat emptor OTC stock since ETRADE stopped doing them.
I want to thank all of you that recommended Ameritrade.
I am bought MGLG at $0.0002 on 3/19/21 I see it getting to at least $0.0006
I opened a Schwab account too and they have no fees so I hope they work too when my money clears.
I am very happy about this it would cost me so much money if I was unable to buy my caveat emptor OTC stocks.
Anyways lets go SHIP.
"Seanergy Maritime Holdings Corp. (“Seanergy” or the “Company”) (NASDAQ: SHIP) announced today that it will release its financial results for the fourth quarter and twelve months ended December 31, 2020 before the market opens in New York on Wednesday, March 24, 2021."
It is about time I thought we were all going to die from old age by the time this happned.HAHAHA
In all seriousness this is a good thing.Even if the results are horrible there is still many reasons to buy and hold.
Some part of me thinks the safest thing is to sell out of all non otc stocks until nasdaq gets to 15,000.Trying to make money in mini or long recessions is so much harder than it needs to be.
I hope I am wrong about the recession part.If we stay in this recession the good news for ship is they can give terrible results and it wont matter.
The market itself is oversold unless we going into mini or full recession mode.
Tons of Americans got their stimulus yesterday.
And I see that book value is $17.76... this is way oversold.
TDAmeritrade is showing SHIP with a PE of 1 (one). eom
$SHIP Huge increase in capacity. This was over $200 just a few short years ago. That's a long drop. Time to reclaim some of that!
Company Fleet upon Vessels’ delivery:
Vessel Name Vessel Class Capacity (DWT) Year Built Yard Employment
Partnership Capesize 179,213 2012 Hyundai T/C Index Linked
Championship Capesize 179,238 2011 Sungdong T/C Index Linked
Lordship Capesize 178,838 2010 Hyundai T/C Index Linked
Premiership Capesize 170,024 2010 Sungdong T/C Index Linked
Squireship Capesize 170,018 2010 Sungdong T/C Index Linked
Knightship Capesize 178,978 2010 Hyundai T/C Index Linked
Gloriuship Capesize 171,314 2004 Hyundai T/C Index Linked
Fellowship Capesize 179,701 2010 Daewoo T/C Index Linked
Geniuship Capesize 170,058 2010 Sungdong T/C Index Linked
Goodship Capesize 177,536 2005 Mitsui Engineering Voyage/Spot
Leadership Capesize 171,199 2001 Koyo – Imabari Voyage/Spot
Tradership Capesize 176,925 2006 Japanese Shipyard N/A
Flagship Capesize 176,387 2013 Japanese Shipyard N/A
Patriotship Capesize 181,709 2010 Japanese Shipyard N/A
Total 2,461,138 14
$SHIP Right... Seanergy is building a nice fleet of ships. Capacity is growing which brings in more $$$$. It's good to see SHIP investing in itself and growing.
MAYNERD - Buying 2 almost new ships.. paying $55 million. So SHIP must have lots of money coming in!!!
SHIP’s Chairman & Chief Executive Officer, stated:
“We are very pleased to announce the acquisition of two high-quality Capesize vessels built at reputable shipyards in Japan. The M/Vs Flagship and Patriotship, both delivering promptly and in a rapidly increasing market environment, represent great added value for Seanergy, the only U.S. listed pure-play Capesize company. Following the delivery of these two vessels and a third acquisition announced last month, our fleet’s cargo carrying capacity will increase by 28% as compared to the beginning of the year.
That is a lot of coal-created iron ore!!! Fast loaded
onto the ship!!
heres a explanation and date is this friday,,
KINGS - A short run? Up or down? eom
shorting rule change Friday,,expect a run on many heavy shorted pennies MHOP $$$
Sell them in Oct or sooner.
Today sucks all my stocks are down.That means it is a mini recession day.
Congrats maybe a little too soon? I bou...
I bought my warrants 2 weeks ago.
.09 cents.
Pretty sure they expire toward end of
this year. But do not know terms.
Congrats on a great day SHIP
Today was a good day for my stocks.
ZOM is going to be one my greatest trades ever.It is still so cheap.
DNN is too.HAHAHA
I do not pump my picks and do not buy them.I am just happy.
Either way we going to get back to $2 on SHIP and that will be the safe time to get off the SHIP.
I am no warrant expert but I have heard a stock split can affect the price movement of the warrant.
Did the warrant come out before the split?
Warrants and stocks can both obviously be great investments when you buy into them at a cheaper price.
The biggest risks with warrants is expiration and recessions.
If we go into a 1 year recession or longer SHIP stock could in theory fully recover but the warrants will expire worthless before they have a chance to.
I do invest in warrants myself but mini and large recessions pound them so much harder than stocks.
Both SHIP stock and SHIPW still look good to me now.The difference for me now is when the stock price gets to $2 I will sell unless my formula of SHIP changes.
I should of sold at $2 the last time.It was too risky to hold and I paid for that.The mini recession hurt the stock more than anything but my formula says it is worth $2 so no reason to hold and HOPE for more without earnings and news.
There is tons of companies with more upside than SHIP as of right now.Out of all my pitched stocks SHIP is the worst one sadly.
My formula can change in an instant so I hope SHIP proves me wrong and we get to $3 soon.I hope before I sell my formula will tell me it raised the price on SHIP.
I liked the good old days when SHIP stock added .50
cents in matter of hours.
I wonder what the stock relationship is to its warrants.
Anybody know?
Did you ask them why?
If you did not even ask them why that seems like an overreaction.
Sorry I guess I misunderstood what was said. Fidelity would not let me buy penny stocks until 11:30 am. That is nonsense. I closed my account and went to Ameritrade. They do charge a fee if $6.95.
Lets go SHIP
ZOM is up 11% and SYN is up 34% I love being right.
SYN is still really cheap guys.Dont buy it just remember I said it.
I am not worried at all about SHIP guys I still feel very strongly it will get to $2 in the next 4 months tops unless there is a mini or large recession of course.
I am going to get a TDA and Schwab account as I am being told by a few sources "like you" they can work so I have no choice but to try them.
I will make a lot of money off my picks so of course I will do it.
thank you again
I dont own any other otc with that distinction.. My last transaction with potn was 2-11-21... i still have fidelity but they stopped letting me buy potn so i added td ameritrade and they have been letting me to buy and sell. i did notice on fidelity they did make me wait 2 business days before i could buy after i transferred money into my account as it use to be that i could put a order the same day i made my transfer request... they are making some changes but there is some things that fidelity has regarding charts and news that is different with td and vice versa so i decided to have both.... just my personal likes
Thank you for that.
Well POTN is on their list.
https://www.tdameritrade.com/retail-en_us/resources/pdf/cesecuritylist.pdf
So when did you buy it?
Do you own any other ones on that list?
When you bought them also matters since you could of bought it before they banned it.
I would love to buy caveat emptor stocks so I look forward to your reply.
Dan.. I have an account with TD Ameritrade and i have bought shares with the caveat emptor. Specifically potn... not trying to pump this, just giving you an actual trade with a stock with that distinction.
What do you mean the same thing happened to you?
Ameritrade publicly says they do not allow caveat emptor OTC stocks.I do not have verified proof so I would be happy to say I am wrong.They have one post on their website saying they do not.I stopped looking after that.
If they charge a fee too that is even worse than Fidelity.
I would be cool with them charging a fee on caveat emptor OTC stocks since I have not found a single broker who allows them now.
Please try to buy some and get back to me.
|
Followers
|
138
|
Posters
|
|
|
Posts (Today)
|
0
|
Posts (Total)
|
4109
|
|
Created
|
02/02/10
|
Type
|
Free
|
| Moderators | |||

| Volume | |
| Day Range: | |
| Bid Price | |
| Ask Price | |
| Last Trade Time: |


