 News
News  Market Data
  Discover
Support: 888-992-3836
Copyright © 2023 InvestorsHub Inc.


Register for free to join our community of investors and share your ideas. You will also get access to streaming quotes, interactive charts, trades, portfolio, live options flow and more tools.
yep agreed also most fast food restaurants are recession proof they do good.
A total bargain. Added and holding
People will ‘eventually ‘ get out and eat
Mid summer is my guesstimate
up in a downmarket, fast food will be one of the recession proof stocks
support at 25 will add if it goes there and bounce off, if not well get ready to get a bigger scoop. Fast food restaurant will be one of few recession proof stock. looking to eoy time frame.
meant cash. Overstated the cash reserves he has 128 billion or so to use still alot lol
think about it buffett has over 300 billion shares in reserve he was waiting for a moment like this to increase his holdings
another one i wouldn't be surprised buffett gonna use his huge cash reserve and buying this on dip.
News: $QSR Why Meatless Meat has Surged in 2019: Investors Already Gained 730%!
In 2019, a niche market truly came into its own. Yes, this year, the market for ‘meatless meat’ has erupted, already bringing sizeable gains to privy investors who predicted what was to come. ‘Meatless meat’ products have erupted not because they simply cater...
Find out more Why Meatless Meat has Surged in 2019: Investors Already Gained 730%!
News: $QSR Restaurant Brands International Inc. Announces Renewal of Normal Course Issuer Bid
Restaurant Brands International Inc. Announces Renewal of Normal Course Issuer Bid Canada NewsWire TORONTO, Aug. 2, 2019 TORONTO , Aug. 2, 2019 /CNW/ - Restaurant Brands International Inc. (TSX/NYSE: QSR) ("RBI") announced today that it has filed, and the Toronto Stock Ex...
Read the whole news Restaurant Brands International Inc. Announces Renewal of Normal Course Issuer Bid
News: $QSR Restaurant Brands International Inc. Reports Second Quarter 2019 Results
Restaurant Brands International Inc. Reports Second Quarter 2019 Results Canada NewsWire TORONTO, Aug. 2, 2019 RBI announces system-wide sales growth of nearly 8% and surpasses 26,000 restaurants globally BURGER KING® and POPEYES® deliver strong growth in global...
In case you are interested Restaurant Brands International Inc. Reports Second Quarter 2019 Results
don't get me wrong---I like burgerking in the usa
but coffee--seeings how the owners are in BRAZIL --they could throw in a few more beans per serving size.. or give some of them a good roasting
Buffet is a senior and likes the mild taste too

THEY GOT ALL THE SENIORS IN MY AREA ---HOODWINKED ON THEIR COFFEE
personally it tastes like old starbucks coffee thats been brewed 2 hrs ago
might be different in the restaurant where they have to throw in max beans--but not all--my k-cup is ok if only a small amt is let out-- but at that rate each cup would cost 4 bucks
And now we have Chicken with those Donuts and Coffee.. 
Restaurant Brands beats by $0.05, misses on revenue
Oct 27 2015, 07:12 ET | About: Restaurant Brands Inter... (QSR) | By: Niloofer Shaikh, SA News Editor
Restaurant Brands (NYSE:QSR): Q3 EPS of $0.34 beats by $0.05.
Revenue of $1.02B (-8.1% Y/Y) misses by $30M.
Press Release
http://seekingalpha.com/news/2858836-restaurant-brands-beats-by-0_05-misses-on-revenue?uprof=45#email_link
Restaurant Brands International Reports Third Quarter 2015 Results
Tue October 27, 2015 7:00 AM|PR Newswire | About: QSR
OAKVILLE, ON, Oct. 27, 2015 /PRNewswire/ - Restaurant Brands International Inc. (QSR) (TSX/NYSE (NYX): QSR, TSX: QSP) today reported financial results for the third quarter ended September 30, 2015.
Daniel Schwartz, Chief Executive Officer of Restaurant Brands International ("RBI") commented, "We continued to build on momentum from the first half of the year, achieving favorable comparable sales growth and net restaurant growth at both of our iconic brands, TIM HORTONS® and BURGER KING (BKC) ®. We also announced the first development deal at TIM HORTONS® since the creation of RBI, and our Master Franchise Joint Venture, Burger King France, announced the proposed acquisition of Quick Group. We are excited about the path for TIM HORTONS® and BURGER KING ® global expansion going forward. We have made good progress year-to-date and are unwavering in our commitment to delivering a great guest experience while driving franchisee profitability."
Third Quarter 2015 Highlights:
•Tim Hortons ("TH") comparable sales increased 5.3% and Burger King ("BK") comparable sales increased 6.2% in constant currency
•TH delivered net restaurant growth ("NRG") of 69 and BK delivered NRG of 141
•System-wide sales grew 8.2% at TH and 11.2% at BK in constant currency
•RBI Adjusted EBITDA was up 22.8% on an organic basis to $441 million versus the prior year pro forma amount
•RBI Adjusted Diluted EPS was $0.34 per share
•RBI declared a dividend of $0.13 per common share and partnership exchangeable unit of RBI LP for the fourth quarter of 2015
More...
http://seekingalpha.com/pr/15117496-restaurant-brands-international-reports-third-quarter-2015-results
Restaurant Brands beats by $0.06, beats on revenue
Jul 27 2015, 07:05 ET | About: Restaurant Brands Inter... (QSR) | By: Niloofer Shaikh, SA News Editor
Restaurant Brands (NYSE:QSR): Q2 EPS of $0.30 beats by $0.06.
Revenue of $1.04B (-1.9% Y/Y) beats by $20M.
Press Release
http://seekingalpha.com/news/2657705-restaurant-brands-beats-by-0_06-beats-on-revenue?uprof=45#email_link
Restaurant Brands International Reports Second Quarter 2015 Results
Mon July 27, 2015 7:00 AM|PR Newswire | About: QSR
OAKVILLE, ON, July 27, 2015 /PRNewswire/ - Restaurant Brands International Inc. (QSR) today reported financial results for the second quarter ended June 30, 2015.
Daniel Schwartz, Chief Executive Officer of Restaurant Brands International (RBI) commented, "We are pleased to report another quarter of solid results for both of our iconic brands, TIM HORTONS ® and BURGER KING®. The continued expansion of our global footprint combined with effective marketing and successful product launches drove system-wide sales growth. We believe our focus on enhancing our guest experience and increasing franchisee profitability will continue to create value for all of our stakeholdersour guests, franchisees, employees and shareholdersin the second half of the year."
Second Quarter 2015 Highlights:
• Tim Hortons (TH) comparable sales increased 5.5% and Burger King (BK) comparable sales increased 6.7% in constant currency
•TH delivered net restaurant growth ("NRG") of 52 and BK delivered NRG of 141
•System-wide sales grew 8.4% at TH and 11.6% at BK in constant currency
•RBI Adjusted EBITDA was up 19.1% on an organic basis to $427 million versus the prior year pro forma amount
•RBI Adjusted Diluted EPS was $0.30 per share
•RBI declared a dividend of $0.12 per common share and partnership exchangeable unit of RBI LP for the third quarter of 2015
Consolidated Operational Highlights
Three Months Ended June 30,
2015
2014
(unaudited)
Comparable Sales Growth(1)
TH (2)
5.5%
2.8%
BK
6.7%
0.9%
System Net Restaurant Growth (NRG)
TH (2)
52
22
BK
141
131
System-wide Sales Growth(1)
TH (2)
8.4%
6.5%
BK
11.6%
5.4%
System-wide Sales (3)(in US$ millions)
TH (2)
$ 1,657.6
$ 1,702.0
BK
$ 4,406.1
$ 4,292.9
(1)
Comparable sales growth and system-wide sales growth are calculated on a constant currency basis and include sales at franchise restaurants and company-owned restaurants.
(2)
TH 2014 second quarter figures are shown for informational purposes only.
(3)
System-wide sales are driven by sales at franchised restaurants, as approximately 100% of current restaurants are franchised. We do not record franchise sales as revenue; however, our franchise revenues include royalties based on a percentage of franchise sales.
Consolidated Financial Highlights
Three Months Ended June 30,
(in US$ millions, except per share data)
2015
2014
2014 PF (6)
(unaudited)
RBI Total Revenues
$ 1,041.4
$ 261.2
$ 1,058.7
RBI Net Income (Loss) Attributable to
$ 9.6
$ 75.1
$ 31.3
Common Shareholders
RBI Diluted Earnings (Loss) per Share
$ 0.05
$ 0.21
$ 0.15
Attributable to Common Shareholders
TH Adjusted EBITDA (4)
$ 234.3
n/a
$ 215.2
BK Adjusted EBITDA (4)
$ 192.9
$ 182.8
$ 182.8
RBI Adjusted EBITDA (5)
$ 427.2
$ 182.8
$ 398.0
RBI Adjusted Net Income (Loss) Attributable
to Common Shareholders (5)
$ 142.7
$ 93.2
$ 112.1
RBI Adjusted Diluted Earnings (Loss) per Share
Attributable to Common Shareholders (5)
$ 0.30
$ 0.26
$ 0.24
(4)
TH Adjusted EBITDA and BK Adjusted EBITDA are our measures of segment profitability.
(5)
RBI Adjusted EBITDA, RBI Adjusted Net Income (Loss), and RBI Adjusted Diluted Earnings (Loss) per Share are non-GAAP financial measures. Please refer to "Non-GAAP Financial Measures" for further detail.
(6)
Please refer to RBI's Form 8-K filed on April 27, 2015 with pro forma financial information for RBI, TH and BK.
Consistent execution of brand-specific strategic initiatives drove RBI outperformance in the second quarter. TH trailing twelve month NRG of 230 along with comparable sales growth of 5.5% drove TH system-wide sales growth of 8.4%. Strength in Dark Roast coffee and the CREAMY CHOCOLATE CHILL" beverage as well as growth in the lunch daypart contributed to TH outperformance. At BK, trailing twelve month NRG of 720 in conjunction with second quarter comparable sales growth of 6.7% led to BK system-wide sales growth of 11.6%. BK comparable sales growth was largely driven by innovative product launches including the A.1.® Hearty Mozzarella Bacon Cheeseburger, Extra Long Pulled Pork Sandwich and Chicken Fries.
TH Segment Results (2)
Three Months Ended June 30,
(in US$ millions)
2015
2014
2014 PF (6)
(unaudited)
Comparable Sales Growth (1)
5.5%
2.8%
2.8%
System-wide Sales Growth (1)
8.4%
6.5%
6.5%
System-wide Sales (3)
$ 1,657.6
$ 1,702.0
$ 1,702.0
System Net Restaurant Growth (NRG)
52
22
22
System Restaurant Count at Period End
4,776
4,546
4,546
Sales
$ 539.0
n/a
$ 563.1
Franchise and Property Revenues
$ 224.2
n/a
$ 234.4
TH Total Revenues
$ 763.2
n/a
$ 797.5
Cost of Sales
$ 450.9
n/a
$ 480.0
Franchise & Property Expenses
$ 92.5
n/a
$ 103.0
Segment SG&A (7)
$ 23.1
n/a
$ 41.6
Segment depreciation and amortization (8)
$ 34.9
n/a
$ 38.6
TH Adjusted EBITDA (4) (9)
$ 234.3
n/a
$ 215.2
(7)
Segment selling, general and administrative expenses consists of segment selling expenses and segment management general and administrative expenses.
(8)
Segment depreciation and amortization consists of depreciation and amortization included in cost of sales and franchise and property expenses.
(9)
TH Adjusted EBITDA for the three months ended June 30, 2015 excludes $(1.0) million of acquisition accounting impact on cost of sales and includes $3.7 million of cash distributions received from equity method investments. TH pro forma Adjusted EBITDA for the three months ended June 30, 2014 includes $3.7 million of cash distributions received from equity method investments.
Comparable sales growth and NRG for the trailing twelve month period contributed to TH system-wide sales growth of 8.4% in the second quarter. TH comparable sales grew 5.5%, with comparable sales growth for TH Canada and TH U.S. markets at 5.4% and 7.0%, respectively.
TH added 52 net new restaurants to end the quarter with 4,776 restaurants. For the trailing twelve month period, TH increased its restaurant base by 230 restaurants, or 5.1%. TH Total Revenues declined 4.3% versus the prior year pro forma amount to $763.2 million, primarily as a result of FX headwinds. Excluding the impact of FX movements, TH Total Revenues increased 7.9% compared to prior year pro forma results. Year-over-year, TH Adjusted EBITDA grew 22.8% on an organic basis (excluding the impact of FX movements) as a result of top-line growth, operating leverage and cost discipline.
BK Segment Results
Three Months Ended June 30,
(in US$ millions)
2015
2014
(unaudited)
Comparable Sales Growth (1)
6.7%
0.9%
System-wide Sales Growth (1)
11.6%
5.4%
System-wide Sales(3)
$ 4,406.1
$ 4,292.9
System Net Restaurant Growth (NRG)
141
131
System Restaurant Count at Period End
14,528
13,808
Sales
$ 28.8
$ 18.3
Franchise and Property Revenues
$ 249.4
$ 242.9
BK Total Revenues
$ 278.2
$ 261.2
Cost of Sales
$ 25.0
$ 15.7
Franchise & Property Expenses
$ 33.1
$ 35.7
Segment SG&A (7)
$ 39.2
$ 39.4
Segment depreciation and amortization (8)
$ 12.0
$ 12.4
BK Adjusted EBITDA (4)
$ 192.9
$ 182.8
Comparable sales growth and acceleration of net restaurant openings at BK helped drive system-wide sales growth of 11.6%. BK achieved comparable sales growth of 6.7% with positive same-store sales in all markets. U.S. and Canada and Latin America and the Caribbean notably outperformed with comparable sales growth of 7.9% and 8.5%, respectively. BK top-line growth was largely attributable to comparable sales growth and the addition of 720 net new restaurants for the trailing twelve month period. With 141 net new restaurants added in the second quarter, BK ended the period with 14,528 restaurants.
BK experienced a 6.4% FX headwind to revenues for the second quarter. Excluding the impact of FX movements, BK Total Revenues grew by 13.7% to $278.2 million versus prior year. Compared to the second quarter 2014, BK Adjusted EBITDA increased 14.7% on an organic basis.
More...
http://seekingalpha.com/pr/14198835-restaurant-brands-international-reports-second-quarter-2015-results
this will double within the next few months. Both companies are already established and we are just waiting on the 'paper work' expense for accurate price.
good company, great management.
They already raised the dividend .01 .. excellent respect to its share holders.
Go King !!!!
Restaurant Brands EPS of -$2.52
Feb 17 2015, 07:12 ET | About: Restaurant Brands Internat... (QSR) | By: Mamta Mayani, SA News Editor
Restaurant Brands (NYSE:QSR): Q4 EPS of -$2.52 may not be comparable to consensus of $0.25.
Revenue of $416.3M (+57.0% Y/Y)
Press Release
http://seekingalpha.com/news/2300606-restaurant-brands-eps-of-2_52?auth_param=ano5b:1ae6c3c:dcc3a04f724e484ef0d32f7494f36608&uprof=45#email_link
Restaurant Brands International Reports Full Year and Fourth Quarter 2014 Results
Tue February 17, 2015 7:00 AM|PR Newswire | About: QSR
OAKVILLE, ON, Feb. 17, 2015 /PRNewswire/ - Restaurant Brands International Inc. (QSR) today reported financial results for the full year and fourth quarter ended December 31, 2014.
Restaurant Brands International (RBI) Chief Executive Officer, Daniel Schwartz commented, "Positive business momentum in the fourth quarter capped a transformational year for our company. Both the TIM HORTONS® and BURGER KING® brands continue to deliver positive comparable sales growth and best in class net restaurant growth. With the creation of Restaurant Brands International, a new global powerhouse in the quick-service restaurant industry, we believe both brands are well positioned for long-term sustainable growth and we are excited to introduce the iconic TIM HORTONS® brand to the rest of the world."
Full Year 2014 Highlights:
• Tim Hortons (TH) comparable sales increased 3.1% and Burger King (BK) comparable sales increased 2.1%
•Delivered 186 net restaurant growth (NRG) at TH and 705 NRG at BK
•System-wide sales grew 6.6% at TH and 6.8% at BK in constant currency
•TH Adjusted EBITDA grew 10.5% on an organic basis to $816 million
•BK Adjusted EBITDA grew 11.5% on an organic basis to $726 million
•Paid Burger King Worldwide Inc. dividends of $0.30 per share or approximately $106 million
Fourth Quarter 2014 Highlights:
•TH comparable sales increased 4.1% and BK comparable sales increased 3.0%
•Delivered 81 NRG at TH and 412 NRG at BK
•System-wide sales grew 7.4% at TH and 7.7% at BK in constant currency
•TH Adjusted EBITDA grew 10.2% on an organic basis to $209 million
•BK Adjusted EBITDA grew 8.8% on an organic basis to $189 million
More...
http://seekingalpha.com/pr/12529936-restaurant-brands-international-reports-full-year-and-fourth-quarter-2014-results
"Nice News Article"
Pershing Square Declares 19% Stake in Restaurant Brands
And with "Warren Buffett" on board.. This Stock is going be smoking!
"QSR" New Filing.
William A. "Bill" Ackerman.
Form SC 13G, No. 0001193125-15-001767
"QSR" Description
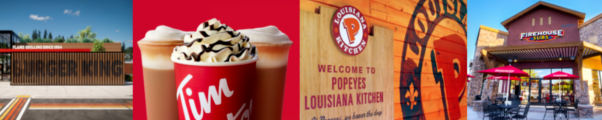
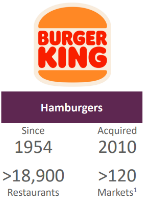
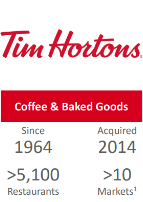
Restaurant Brands International Inc is the parent company for Tim Hortons Inc. and Burger King Worldwide, Inc. The Company operates more than 18,000 restaurants operating in 100 countries under its two distinct brands. Tim Hortons operates restaurant chains in North America and Canada. Operating in the quick service segment of the restaurant industry, Tim Hortons menu includes premium coffee, hot and cold specialty drinks (including lattes, cappuccinos and espresso shots), specialty teas and fruit smoothies, fresh baked goods, grilled Panini and classic sandwiches, wraps, soups, prepared foods and other food products. As of September 28, 2014, Tim Hortons had 4,590 system wide restaurants, including 3,665 in Canada, 869 in the United States and 56 in the Gulf Cooperation Council. BURGER KING is a fast food hamburger chain. The BURGER KING system operates in approximately 14,000 locations serving more than 11 million guests daily in 100 countries and territories globally.
39.04
+0.17 (0.44%)
Dec 31 - Close
NYSE real-time data - Disclaimer
Currency in USD
Range 38.58 - 39.11
52 week 32.98 - 42.98
Open 38.95
Vol / Avg. 382,123.00/3.02M
Mkt cap 7.85B
P/E -
Div/yield -
EPS -
Shares 202.01M
Beta -
Inst. own -
Berkshire Hathaway Announces 4.18% Ownership Of Restaurant Brands International
Posted By: ManiPosted date: December 15, 2014 10:25:42 AM
Warren Buffett
"I like this combination.

Awesome!!! This stock will run up high in 2015.
Yep!! Invest in "Coffee Beans," its a "Global Commodity" with very high consumption!
JMO
I see this heading up to new heights.
"LOL" I mean it should? hehehe...
I hear ya!! I will get for sure.
Oh Yeah!! I like it..
It's official... Burgers, Coffee and Donuts.. Timmy's and Burger King and Warren Buffet..
|
Followers
|
5
|
Posters
|
|
|
Posts (Today)
|
0
|
Posts (Total)
|
89
|
|
Created
|
12/18/14
|
Type
|
Free
|
| Moderators | |||


| Volume | |
| Day Range: | |
| Bid Price | |
| Ask Price | |
| Last Trade Time: |


