 News
News  Market Data
  Discover
Support: 888-992-3836
Copyright © 2023 InvestorsHub Inc.


Register for free to join our community of investors and share your ideas. You will also get access to streaming quotes, interactive charts, trades, portfolio, live options flow and more tools.
The Analysis is done Horizontally, not Diagonally
This week I want to share with you one of the most enlightening moments in my learning process related to the use of trendlines. When I decided to educate myself about technical analysis and the markets there were no online trading seminars. There were no seminars at all, but if there were they wouldn't have been online since there was no internet. However, there were market letters that that came by snail-mail that did some education along with trade recommendations. All used trendlines in the analysis.
Let's review what is taught about the use of trend lines and questions I had after using them.
Trend line Analysis:
A trend line needs at least two connecting points.
A trend line with three or more points is stronger
The trend line connecting points shouldn't be too close
The trend line shouldn't be too steep or shallow
An uptrend line will act as support
A downtrend line will act as resistance
A trend line once broken will have the opposite effect
The break of a long existing trend line changes the trend
Questioning the validity for trendlines:
Should trendlines be drawn from bar extremes or the closes?
Are trendlines drawn in a higher time frame stronger?
Are intersecting trendlines a stronger reference point?
Are trendlines valid in all time frames, even a 1-min.?
Is a trend line drawn on an Arithmetic scaled chart more valid than those on a Semi-log scaled chart?
Is the break of a trend line really a change in the trend?
How many times can a trend line be redrawn?
Can extending a line really predict where prices will reverse?
My conclusion about the use of trendlines is that while widely used and have the potential to effect price movement on market indices especially, they are subjective as reference points of support and resistance at best and not needed. If you have used trendlines, had one break, seen prices reverse back in the original direction and you then redrew the line like I have. The question that came to my mind was, is it possible to "connect the dots" again and locate support and resistance? It didn't make sense, not common sense. The answer was no.
The enlightening moment came when I realize that the analysis of support and resistance is not to be done diagonally, it has to be done horizontally. It was so simple, but all the hocus-pocus analysis taught made it so hard to get to that point. Besides the basic Trend Line there are Gann lines, Gann Box lines, Regression Channel lines. Median Lines, Andrews Pitchfork Lines, Fibonacci Circle lines, Fibonacci Fan Lines and it goes on and on. It should be no surprise why so many are confused about the use of technical analysis. Been there or there right now? Here what to do, simply look to the left and stop drawing lines!
Let's review the trend lines and the real coming overhead resistance on some of the broader market indices.
In the chart above of the S&P 500 ETF symbol SPY, I drew the downtrend line. Clearly, prices ignored it like it was not there. Actually, it is only there for those that drew it, so it only exists as a reference point for them, in their minds; it's not real. What is real is the area in red, which is there for everyone. Somewhere in that box sellers are going to overcome buyers. Will that be for a day, two days? How far will prices drop? That's the unknown. Right now there is no pattern to suggest that. The only thing known is that the area to the left is resistance and the move up has the greatest odds of stalling in the box.
In the chart above the Nasdaq 100 ETF QQQ, I drew the downtrend line and we see that prices did stall at the line before moving higher. Was the line the reason? No it was not, it was the small area of price resistance to the left. Resistance does not mean prices have to go lower. Especially, when prices have fallen for a while as these did into an area of Major Support (MS) (not shown) where buyers will show up.
The Qs entered into the area of price resistance Friday and sellers are going to show up in there. The 200-MA is also in the box and while subjective as a reference point of resistance, it is a widely followed point of reference. Notice the number of overlapping candles that are directly to the left of it and the unfilled gap.
In the chart above of the Russell 2000 ETF symbol IWM, I drew the downtrend line. Odds are prices are going to stall there and trend line users will point to that. Why will prices stall there? Because price resistance is to the left and the other markets are coming into resistance also. It just happens to work out this way once and a while.
Technical analysis does not have to be complicated; however, we have a tendency to follow what is when it comes to the markets. I did years ago, but eventually realized the majority of what is taught is nonsense. I don't know how all this nonsense started, but it's been going on a long time and continues. Most do not side-step this black hole on the way to finding the truth, if they ever do. You don't have to or can get out of it now.
Come into this week's Free Pristine Power Trading Workshops. You'll learn more about how simple the analysis can be.
All the best,

Pristine Capital Holdings, Inc.
1-800-340-6477
Counselor@Pristine.com
http://www.Pristine.com
![]()
Pristine – A trading style often imitated, But NEVER matched
Chart of the Week
A free Pristine service published on select Mondays
Sponsored by http://www.Mastertrader.com
Using Sector Scans in Pristine ESP
Just a quick reminder: if you have not been receiving these "ESP Tip of the Week" newsletters you can view all of the back issues at the ESP resource page on our website.
This week's tip is about the many ways that you can perform sector analysis using pristine ESP. Included in two of the layouts is the "Pristine Sectors Watchlist". This is a cross-section of several key sectors that represent the broad diversity of the market.
By looking at this throughout the day you can sort using the columns to bring the strongest and weakest sectors to the top and keep a close eye on where the money is flowing throughout the day.
You may also access this list by going to the Launchpad and selecting "Pristine Sectors" from the watchlist manager. This will bring up the same lists into a new watchlist that you can use anywhere you choose, or simply pull up on an as needed basis.
For a more in-depth look at the sectors of the market, you can also go to the Launchpad and simply select "ETF View". This will give you a larger range of sectors and you can select or sort by various criteria to suit your needs.
Once you have found a key sector for the day, you may then drill down to find the best stocks. From the Launchpad simply select "Sector View".
On this window, you can select the markets you want to view, as you can with most ESP windows. You then go and choose from a wide variety of sectors, or even drill down to the subsectors to find just the group of stocks that you want to review. All the stocks of that sector or subsector will appear on the list and from there you can sort by volume, range of day, or percent gain, or whatever you like using the columns at the top of the window. This allows you to get the strongest stocks in the strongest sectors, or weakest stocks and weakest sectors, in a matter of seconds.
Sector analysis is a large part of many trader's daily routine as it should be. Pristine ESP allows you to access this information in a matter of seconds. Click to Take a FREE 1-Week Trial and do not forget to attend the free ESP training class every Wednesday at two o'clock.

Pristine Capital Holdings, Inc.
1-800-340-6477
Counselor@Pristine.com
http://www.Pristine.com
![]()
Pristine – A trading style often imitated, But NEVER matched
Pristine ESP Stock Screener Trading Tips
A free Pristine service published every Wednesday
Sponsored by http://www.Mastertrader.com
What Causes Failure? Part One of Three
After many years of seeing many issues in trading through the eyes of many traders, I have come to one inescapable conclusion. Something I now consider a fact. Everyone who enters trading is exactly the same, and stay the same for a long time. It is not until later in development, that some break out into 'unique' ground. So relax, everyone has gone through what you are, or have gone through.
You may not like the answers. However, you need to hear them. While education in technical analysis is absolutely needed, most who really try, receive that education. In addition, they receive enough to make them potentially successful. For those who do not get an education, it may be the biggest cause of failure. However, anyone can understand the education material once presented, and many who receive the education still fail, so lack of education, while critically important, is NOT making my top three list.
Number one quite simply is the ability to do what need to be done, and do it now. The word for that is 'discipline'. This is the number one reason for failure amongst traders. Initially it may be the lack of discipline to take a stop. Later it may be the lack of discipline to reach a target. Note that the trader knows what the stop is, and what the target is. This is why the 'education' doesn't make the list. The problem is, even those that know what to do and when to do it, do NOT do it. Lack of discipline.
It shows up in many other places. The lack of discipline to review material learned. The lack of discipline to review trades and make changes. The lack of discipline to create and use a trading plan. The lack of discipline to honestly analyze your trades and determine you need an education. All of the key things in trading are easily learned by someone who wants to learn them. However, they are not easily done. Lack of discipline is a number one reason traders fail. Do you suffer from a lack of discipline in your trading? Is it holding you back from your goals?
Closing Comments:
This is the first of three things we will look at. After seeing them all, you may disagree about the order. Do not. They will not be in any particular order. They are all important and it is like the 'chicken and the egg' argument. All three of them are critical, and the lack of any of them will cause failure, just like removing one leg of a three-legged stool.
Pristine Capital Holdings, Inc.
1-800-340-6477
Counselor@Pristine.com
http://www.Pristine.com
![]()
Pristine – A trading style often imitated, But NEVER matched
The Eyes of a Pristine Trained Trader - November 19, 2012
A free Pristine service published every Monday
Sponsored by http://www.Mastertrader.com
In Search of the Elusive Bottom
Over the years, I've seen many TV commentators, newsletter writers, self-proclaimed market gurus, chat room moderators and of course, traders call a bottom. Most of them being early on their call and/or entry are caught on the wrong side of the trend. However, they always have follow up calls to get long in hopes of catching the elusive bottom. I'll show you how elusive - it isn't.
What is baffling is, bottoms are one the easiest patterns to spot, so why not wait for it to setup? Of course that would take some trading education, which most people resist spending money on until they have lost some money - or a lot it. But how senseless is it to be calling and risking money on a reversal without any evidence of one? Don't expect this to ever change and we don't want it to. The bottoming pattern happens not only because of accumulation, it is also because of the early buyers capitulating.
Let's review some examples.
In the charts above are various tradable instruments. I chose bottoming patterns in stocks, commodities, currencies and the broader markets indices. It does not matter what you trade, this happens the same way in all tradable instruments.
As prices move lower within a downtrend they will begin to accelerate lower near its end. This is seen through multiple bars moving down with little overlap between them and/or wide range bars. At some point, the move lower will be rejected and prices will spring back up. The spring up typically is shallow and does not violate the trend by overcoming Major Resistance (MR).
What follows is a consolidation and pullback that will retest the original low. At times, the original low point of the move will be violated; however, all moves higher that initiated from the retest should have multiple bars moving higher into MR or above it and may have bullish Wide Range Bars (+WRB) as well. Pristine Tip: Multiple bars moving in one direction with little overlap between them are a Wide Range Bar in a higher time frame.
The bottoming process can go on for a relatively long period of time depending on the time frame being viewed. Longer time frames will form bottoms over a longer period of time and vice versa for shorter. That being said, the Pristine Trained Trader (PTT) knows that the odds of the bottoming pattern having high odds of making a significant move depends on the alignment of multiple time frames and where the bottom sets up. Let's look at an example of a stock that should form a bottoming pattern soon.
In the chart above, I have displayed multiple time frames of ROSS Stores (ROST). The monthly time frame is in a strong uptrend and pulling back where buyers will show up. That pullback is coming into first price support (green area), which may be hard to see to the untrained eye in this time frame.
What I have marked on the monthly as price support is the overlapping candles in the $50 dollar area. Pristine Tip: Overlapping candles in a higher time frame are a base in a lower time frame. See the base in the weekly time frame at the left. Notice the increase in volume last week as current prices neared the base of price support. That pick up in volume is exactly what we want to see when prices enter into a price support area.
The daily time frame of ROST is clearly in a downtrend and has not formed a bottom. However, Thursday's gap lower on increased volume that resulted in the formation of a Bottoming Tail (BT) is a typical exhaustion gap. This gap lower and BT could be the start of the bottoming process; time will tell. Exhaustion gaps come after a period of declining prices and signal that the last of the traders/investors hoping that prices would hold and turn higher have given up hope and are dumping their shares.
With the current correction in the broader markets ongoing, I hope this Chart of the Week will help you what to look for. There may be stocks that have shown relative strength and have started the bottoming process already. You will have to scan for them, but now you know what to look for!
Many new to trading the markets are lured into thinking that one market is a better market to trade than another. Those trying to sell you their services related to a specific market will guide you to that faulty thinking. For example, FOREX is a better or easier market to trade than individual stocks or equity e-minis.
This is completely false. Any market can be difficult at times because of uncertainty related to that market resulting in choppy price action. Or, any market can be relatively easy to trade when multiple technical concepts are in alignment.
With the right trading education - you can trade any market or stock you want with the same method.
Remember, the examples of bottoming patterns above were from Stocks, Commodities and Currencies. There is no difference. Yes, different instruments have basic foundational information related to them, but that information is not what you will trade. It's the patterns within the trends at the time that you will trade.
Please join us for this week's Pristine's Power Trading Workshops.
Happy Thanksgiving to All!
Pristine Capital Holdings, Inc.
1-800-340-6477
Counselor@Pristine.com
http://www.Pristine.com
![]()
Pristine – A trading style often imitated, But NEVER matched
Chart of the Week - November 19, 2012
A free Pristine service published on select Mondays
Sponsored by http://www.Mastertrader.com
How long will it take?
Trading Lesson of the Week - November 15, 2012
A free Pristine service published every Thursday
Sponsored by http://www.Mastertrader.com
"How long will it take for me to become a profitable trader?"
Boy - if I had a dime for each time I was asked this question, I would have one large collection of dimes. But I think I've done my work well. The majority of people who have sat in on my workshops and listened to me speak over the last couple of are no longer asking this question. So if you ever catch yourself wanting to ask this question, then please pay close attention to what I'm about to share with you here. Because once you understand the poisoned thinking from which this question comes from within you, you will be thankful that you now see things from a much more useful perspective.
We are always, from an early age, comparing ourselves with others. From our upbringing and various influences on our thought processes as we grow up, we develop certain metrics and rules in order to determine what is 'right', 'wrong', 'fair', 'unfair', and unfortunately when we are 'good' or 'bad'.
Stop doing it. Realize, that you are unlike any other individual or soul on this entire planet....or in the universe. So how can you compare yourself with others? It's like comparing apples and oranges. There are no comparisons because you are simply 'you'. You are not like anyone else. Period.
So how long it took other traders to make a 'good' income at trading is completely irrelevant to you. And, if one thinks about it, what possible good could come of putting a 'standard' or an 'average amount of time it takes' out there as YOUR measuring stick simply because someone told you it was so. There are so many fallacies at work in a statement like this that it's ridiculous. If someone were to say it took 11 months, for example, for the 'average' trader to 'make it', what does that mean? Define an 'average trader'. Define 'make it'. And then ask, "What data do you have to support that 11 months is the average?" Did every single trader in the world give the person making this statement specific feedback on how much time it took them to 'make it'? NO! It's NOT POSSIBLE! The very criteria that would go into such a poll is subjective and thus makes the results entertaining, at most.
Most of the truly amazing traders seem to 'disappear into the sunset'. They enjoy their privacy. And if they are amazing traders, they will be NO PART of such a silly 'poll' to help new traders provide themselves a measuring stick with which to measure their progress. They understand that this type of 'information' will not serve any trader.
Think about that. Now, wouldn't you feel silly if you had actually measured yourself against some standard that was communicated to you which has no way of being based in reality? And even if it was, realizing that using it for yourself as a measuring stick is like comparing apples with oranges? Worse - I know people who have QUIT trading because of articles like this.
What possible good could come of it? If you are just starting out, the thought of losing for 11 months before you 'make it' is pretty daunting. So it doesn't serve that person. If you have been trading for 8 months or thereabouts, chances are you will psychologically ruin yourself as you get closer to the 11 month mark and I can almost guarantee that you will not 'make it' by then simply because of human nature and the stress/pressing you will put on yourself. And, God forbid, you are past the 11 month marker already and you will make yourself feel like a complete idiot.
If you have not taken a trial to our Interactive Live Trading rooms in a while, drop on by to see how you can gain more experience in how you trade and learn from some of the profitable trading idea's we generate daily. Visit the trading rooms page or call your Counselor at 1-800-340-6477.
We have a great lineup of FREE Power Trading Workshops. Make sure to register for those programs that interest you the most.
Kurt Capra
Contributing Editor
Instructor and Traders Coach
Pristine Capital Holdings, Inc.
1-800-340-6477
Counselor@Pristine.com
http://www.Pristine.com
![]()
Pristine – A trading style often imitated, But NEVER matched
If you have any questions on this Lesson of the Week (LOW) or any other past edition, please send to staff@pristine.com as we would be happy to hear from you.
A Beginner's Handbook Part 3 of 3
Good Morning All:
Last week I continued with part two of a three part series to help beginners, and maybe some 'veteran' beginners also. Last week we looked at different time frames and the types of accounts used to encompass those time frames properly. We talked about how education is so over looked by so many yet so needed, as everyone will pay their dues one way or another. Here is part three. In this issue, are finally ready to begin trading, so let's go over some rules to get you off on the right foot.
Once you have made all the decisions that were discussed in the first two lessons and have received an education to the level you feel you need to begin trading, the decisive moment arrives. At this point, I want to make sure you have a few tools in your tool belt when you begin trading. First, there is a steep learning curve in trading. I suggest (well, insist if I can...) that you start out slowly with very minimal risk amounts. Get used to your trading software. Understand the plays. Begin to pick your favorites and really develop your trading plan. At this point your plan is likely just a 'shell'. Know how to get in and out of trades. The odds are that you will lose in the beginning. You are learning how to apply what you have been taught. You will make mistakes. The question becomes, do you want to have all this learning cost you serious money or small money? By the way, it is good to start out paper trading, but as soon as your plan develops and you know your trading software, begin trading very small risk amounts. The most important aspects of trading are not learned trading on paper.
Most of you reading this need to understand something. The vast majority of traders who come in to the market fail. Many people try to do this without any education, and those who do are the first ones to fail and usually do so in a big way. However, even with an education, it is not an easy game. There are reasons why even somewhat educated traders still fail at this. For most, there is a lack of discipline by individual traders regardless of whatever education level they may be at. In addition, a lack of capital that forces traders to trade with 'scared money'. It is simply a fact that most traders try to make a living from the markets with very little capital base to work with. That causes over trading and poor management decisions. If you have been trading for a while, do any of these things sound like they are powerful issues that are currently impeding your progress?
Another skill you must develop is the habit of keeping good records. Keeping records and statistical information can give you an excellent insight in your trading. There are many things that traders should track such as Sharpe ratios, batting averages, percentage gains based on any particular strategy, percentage gain based on long or short, etc. During this process you should be perfecting your trading plan. One that out lines the types of plays you will look for. It should restrict you from trading certain times and plays that you do not want to trade. It should outline money management rules for you, for handling both winning and losing days. It should set up your share size rules, and it should dictate what kind of record keeping, analysis, and continuing education you will do.
All of these things are taught at Pristine. Some of these I touched on in prior week in this letter. Here is one of the most important things you can do for you trading plan, and for your continued improvement.
Pay attention to the analysis part and make plans to follow up on all of your trades. Most traders spend 90% of their time trading. 10% on preparation and 0% on follow up. This is a very big mistake. Traders should spend as much time following up on trades as they do trading. That does not mean that from 9:00 - 4:30 must be counted as 'trading time'.
Your plan may call for you to trade the first hour and last hour. The time in between could be used to review the morning trades and prepare for the next day, paper trade new ideas, etc. You should spend considerable time printing charts of the trades you make and evaluating them and learning from any mistakes. Good traders understand that the money lost when making a bad trade can be an 'investment' in a process that works to eliminate mistakes and improve trading.
Closing Comments
Good traders also understand that the market is always right, and the best we can do is play the odds. Be flexible and remember that even the best trades can be stopped out.
This is the final article on "A Beginners Handbook".
All the best,
Pristine Capital Holdings, Inc.
1-800-340-6477
Counselor@Pristine.com
http://www.Pristine.com
![]()
Pristine – A trading style often imitated, But NEVER matched
The Eyes of a Pristine Trained Trader - November 12, 2012
A free Pristine service published on select Mondays
Sponsored by http://www.Mastertrader.com
Take Your Stops or Stop Trading!
Trading Lesson of the Week - November 8, 2012
A free Pristine service published every Thursday
Sponsored by http://www.Mastertrader.com
Having trouble adhering to your stops lately? Well, for some traders this is a difficult psychological demon to overcome. One that if not corrected quickly will lead to your demise as a trader. Sounds pretty serious, doesn't it? It is! For those of you who have this nagging problem, you already know the costs. So, let's try to do something about it before the damage is irreversible!
As traders, one of the major weaknesses we have is being human. We are not robots, therefore we bring emotions with us wherever we go and with whatever we do. Being emotional creatures is not conducive to success in trading. Though our mind is a beautiful thing, we must always stay grounded and objective with our thoughts, which is no small task!
Most traders who don't stick to their stops know they are doing the wrong thing, but, they also won't allow themselves to exit the position, because they are unable to accept a loss. By accepting a loss, they are admitting they are wrong, and in turn, they will lose money. So, instead of facing or accepting this pain, they choose to forego their stop loss, and let the stock move against them, in HOPES that it will turn around and eventually make them a winner. They will literally do anything to avoid the prospect of becoming a "loser." Sound familiar to anyone? Well, if I'm talking about YOU, then you need to continue reading...
Most things we listen to or learn in our training seminars make perfect, logical sense. Find a pattern, stalk a quality entry, locate a reasonable area for the stop, pull the trigger, sit back and manage in between. Let the stock do the work for you. It's simple right? Heck, if someone asked you for technical advice about a particular stock, you could probably rattle off some very nice objective, logical advice worthy of a pro, as long as YOU are not in the stock yourself! Everything changes when it's our own money on the line. This causes many people to lose objectivity and become irrational.
For some traders this nasty habit can be easily broken by going back through personal statistics and looking at the positive difference in your P/L by taking your stops versus not taking them. Unfortunately for many, merely looking back at past statistics is not enough. You've been ignoring your stops for so long, it's going to take some stronger medicine to cure this disease!
The first thing you must decide on is this: Do you like trading? If the answer is yes, then the choice becomes very simple. Take your stops, or quit trading. Period! Take some time and really internalize those thoughts. Imagine your life as a trader, and all the positive things that go with it. The freedom to trade when and wherever you want, the potential to earn as much or as little as you desire, the ability to spend more time with loved ones etc. Now, picture your life without trading. Can you handle the alternative? If you don't like the alternative picture, then you are taking the first step towards correcting this habit.
If you've decided that trading is your passion, then you will do whatever it takes to succeed. That includes taking your stops. So, before you enter any trade, you must first accept that the money is potentially GONE. If you are going to risk $100 on a trade, then BEFORE you enter the position, you must emotionally tell yourself, the $100 is gone. I no longer have it. After all, you can't lose something you don't have! If the thought of losing $100 is too frightening, then you need to lower the amount of money you are willing to lose per trade, until it becomes emotionally acceptable. If you cannot find a dollar amount small enough, then try using a simulator account and work your way up to trading with small shares. If that doesn't work, then there is a chance that this business is not for you.
Always keep in mind that we are not going for homeruns, we are looking for base hits. We focus on a consistent approach to making money, something we can repeat day after day. We are not investors, we are technical traders. We have very specific parameters for our set-ups, and using stop losses is a large part of that process. When something does not work as we plan, we take the loss and reassess. We don't opine about the "what if's", we simply move on and stay objective. Remember, it's just one trade! So, don't let that "one" trade wipe out your account and destroy your trading aspirations. Is one trade worth that much?
If you feel yourself losing control, then step back and slow things down or perhaps stop trading for a bit. Don't worry about missed opportunities because the market is not going anywhere. When you are ready to trade again, the market will still be there. If you need to, put a sign up in front of you that simply states, "I will adhere to my stop, no matter what!" Another approach might be to record yourself when you are feeling anxious about not taking a stop. Then go back and replay it afterwards to see what your emotional process was. A "consequence" system may work as well. For example, if you don't take your stop, then you are not allowed to play golf for 2 weeks. Take away something meaningful, something that will help promote change. As our own PMTR moderator Jeff Yates always says: "You won't change until the pain to change becomes greater than the pain to stay the same!" I truly believe that. So you need to ask yourself how much money do I need to lose before I change?
Although not adhering to stops is a very serious problem, one of the nice things about having this type of issue is that it can be corrected in just one day. Similar to smoking, if you so choose, you can literally quit smoking today and never have another cigarette again in your life. I'm not saying this is easy, but it is possible. Same goes for adhering to stop losses. For example, learning chart patterns will take time, it's not something that you can force yourself to learn in one day. Whereas with adhering to stop losses, if you have the mental strength and desire, you can literally change overnight! It doesn't have to take months.
Good luck out there, and remember this is a marathon not a sprint, and it all starts with a good, objective trading plan! The choice is simple: Take your stops or stop trading!
Make sure to register for other programs that interest you the most at the following link: Pristine Power Trading Workshops
I would be happy to see you join us and to answer any questions you may have.
Jared Wesley
Contributing Editor
Interactive Trading Room Moderator
Gap, Intra-Day and Swing Trading Specialist
Instructor and Traders Coach
Pristine Capital Holdings, Inc.
1-800-340-6477
Counselor@Pristine.com
http://www.Pristine.com
![]()
Pristine – A trading style often imitated, But NEVER matched
If you have any questions on this Lesson of the Week (LOW) or any other past edition, please send to staff@pristine.com as we would be happy to hear from you.
Using the Menus in the Pristine 4 Opportunity Scanner Window
Pristine ESP Stock Screener Trading Tips - November 7, 2012
A free Pristine service published every Wednesday
Sponsored by http://www.Mastertrader.com
Just a quick reminder: if you have not been receiving these "ESP Tip of the Week" newsletters you can view all of the back issues at the ESP resource page on our website.
This week's tip is going to be about using the menu options that are available to you at the top of Pristine ESP 4 Opportunity Scanner. This is the scan window that is the heart of ESP and is included in all the layouts and also can be accessed independently by simply clicking on the Pristine ESP 4 link from the Launch Pad.
If you do not see those menus across the top, click on the second icon from the left on the bottom of the window (efficiency view). Note also that if you have the window in a more narrow fashion all of these menus will collapse into a single button called "menu".
Select Markets - very simply allows you to see symbols from the NASDAQ, NYSE, AMEX or whichever markets you choose.
Stock types - this very powerful filter lets you include every conceivable type of stock, or you can restrict yourself to only seeing the ones you choose. For most traders, you will check "Regular Securities", and then decide if you also want to see the ADRs, or ETF's. Many traders prefer to view the ETF's in a separate window. ADRs are fairly common and can be included, but they sometimes trade differently because their primary market is overseas.
Filters - is where you can set your price and volume parameters. This will take whatever universe of stocks you have selected so far, and restrict them by the parameters you set.
Pristine scans - is where you can select which of the propriety pristine scans you want to see in the results. Note that most experienced traders will be focused on a certain set of strategies and select only those strategies to avoid the other noise. If you leave all of these checked, ESP will produce many results.
Timeframes - is pretty self-explanatory. Check the timeframes in which you want to see the Pristine scans you have selected. Note that you can have as many Pristine ESP 4 Opportunity Scanners running as you like. Many traders will select certain Pristine scans on one timeframe, and then have another window open for other Pristine scans on a different timeframe.
Data - gives you the opportunity to go back and see yesterday's data to review plays from the prior day. Note a very important concept here. Every day at 5 minutes after the market close, ESP calculates the daily chart scans for the day and also resets for the next day. You need to go to this data menu and select data from the prior day if you want to look at the daily chart scans from that current day.
Watch lists - were discussed a prior Tip of the Week. Please go back and review prior week's tips if you want more information.
Look for more exciting tips in next week's "Pristine ESP Stock Screener Trading Tips". Make sure to check out the other resources available to you when using pristine ESP on our website by clicking on the link on the right side of this page. You can take a free trial of ESP by clicking on the link on the right side of this page.
Pristine Capital Holdings, Inc.
1-800-340-6477
Counselor@Pristine.com
http://www.Pristine.com
![]()
Pristine – A trading style often imitated, But NEVER matched
What is Real and What is Not in Technical Analysis
Chart of the Week - November 5, 2012
A free Pristine service published on select Mondays
Sponsored by Mastertrader.com
When starting to learn about technical analysis you begin by sifting through a maze of tools. Some have what seems to be a magical ability to locate support and resistance. Most of these tools locate these areas by "connecting the right dots" on the chart. However, there are differing opinions as to which are the right dots.
Support and resistance areas are also located by using moving averages. These too can have pinpoint accuracy, but which ones? If you continue on this path you'll eventually settle on some combination of these tools, but I guarantee that you will also be second guessing them forever.
Let's look at an example of what is real and what is not.
In the daily chart of Apple (AAPL), we see that prices stopped their decline right at the 200-period moving average. The 200-MA is the most widely followed moving average by traders and institutions, so it is the one that often does become a self-fulfilling prophecy. For this reason, I also put the 200-period moving average on my daily charts. However, I also look to the left to see if there is confirming real price support. As we can see, Apple did not has pushed through the 200-MA and is on its way to real support.
Years ago, I realized the only real support that could be relied on with consistency was based on price. However, I didn't come to this realization until I removed all the moving averages, trend lines, Fibonacci lines and even the horizontal lines from my charts. Consistently I saw that while prices stalled at a widely followed moving average, the majority of the time that stall was temporary and prices continued to real support- as Apple did.
Do prices ever stop and reverse from a 200-MA without price support to the left? They do at times because of the self-fulfilling prophecy. The way I suggest you handle this is to at least let the 60-minute timeframe reverse trend before trading against the daily trend that has stalled at the 200-MA. Let's look at that.
The 60-min. chart of AAPL is a clear series of lower highs and lower lows. When the bounce from the daily 200-MA happened, prices stopped right at price resistance, which was an unfilled gap and reversed. With prices having been rejected right where they should have been, the odds of a test of the pivot low that formed at the daily 200-MA was high.
On this chart is an excellent example of how to play a breakdown strategy in the area of prior support or any breakdown for that matter. As we know, there is going to be buyers in an area of support. However, when the trend is down and there's no "price support" to the left (a Pristine Price Void, PPV) in the higher time frame, the lower timeframe support is likely to fail.
What we see happened when AAPL bounced from support on the 60-Min. is that sellers took advantage (green diamond) and pushed prices right back down. This little bounce and failure sets up a shock for the buyers and signals that prices are ready to resume the move lower. That candle marked with the green diamond was a large green candle engulfing the prior before it turned into a Topping Tail (TT).
With that signal in mind, we have a short bias to take into a lower timeframe of choice (I'll use the 5-min.) to look for entry points. That being said, those trading from the 60 min. timeframe can take the signal under the candle marked with the green diamond.
Moving down to the 5-min. timeframe, we are expanding the data to see more detail of the price action that will provide signals not seen on the higher time frame. The green diamond at the left of the chart marks the same point on the 60-min. chart.
While 60-min. traders will be entering after the greater than 100% retracement seen here on the 5-min., 5-min. time frame traders should not enter here unless they have knowledge of Advanced Management Strategies (AMS).
Those that have taken Pristine Seminars will recognize the secondary signs of continuation that I have marked with light green diamonds. The first is what we call a 180 reversal or a Green Bar Ignored (GBI). The second is a Money Bar setup that Pristine Trained Traders use after a breakdown has already happened. These setups have shock value and are entered after the candle forms marked by the light green diamond. With a PVV below, you can count on prices moving lower.
I hope you've gained a few insights into to seeing what is real and what is not in technical analysis. Most spend their time studying what is not real when starting out and many never stop. I eventually found the truth and what the Pristine Method® is based on. You can learn more at this week's Free Power Trading Workshops or by e-mailed counselor@pristine.com.
All the best,
Pristine Capital Holdings, Inc.
1-800-340-6477
Counselor@Pristine.com
http://www.Pristine.com
![]()
Pristine – A trading style often imitated, But NEVER matched
A Beginner's Handbook Part 2 of 3
The Eyes of a Pristine Trained Trader - November 5, 2012
A free Pristine service published every Monday
Sponsored by http://www.Mastertrader.com
We briefly touched on the concept of time frames last issue. It is an important topic and is the next item that needs consideration before you begin trading. The concepts of 'trading' can be used to help people who are looking to better manage their IRA. They can also be used for people trying to build wealth by swing trading investment money, and for people trying to produce income by trading on an intra-day basis. This last category includes traders that are often called "day traders" or "scalpers".
If you are going to be active in the markets, it is recommended that you maintain 2 separate accounts for trading. These two accounts will have different goals and objectives. One account is a 'wealth building' account. It is for core and swing positions. Core positions are positions based on weekly charts and can last from weeks to months. They have stop losses and entry points like any other trade. Targets may be set as an objective or left to an exit based on raised stops as the stock moves up (or lowered stops as stocks move down in the case of a short). Swing positions are based on daily charts and can last from 2-5 days. This wealth building account is important to capture the major moves in the market. These are moves that may elude the trader who goes home flat every night. Gaps and large extended moves will benefit the swing and core trader, but will often only aggravate the intraday trader.
The second account should be 'income producing'. It consists of day trades (ranging from minutes to all day), and 'scalp' trades. Scalp trades are a specialized form of trading. They are designed to make money from very small moves in stock by using large share size and very tight stops. These strategies help to keep income flowing, even at times when the market may be moving sideways, and not generating income in the wealth building account.
Once you have decided on your time frame, it is time to begin. Not time to begin trading, but rather time to begin to get an education. Trading is one of the most challenging endeavors in which one can participate. Unfortunately, most traders will spend more time getting educated in the television market before buying a television, than they will spend getting educated in trading concepts before buying a stock. Most traders do not feel the need to get educated in trading. Most traders also fail.
No one would try to be a doctor or a lawyer without the proper schooling. Yet for some reason, new traders feel that this is an 'easy to conquer' profession. The truth is that some of the smartest and most successful people often have the most difficult time trading.
Continuous success before trading, often translates to over confidence and stubbornness while trading; this is a bad combination. You have to be able to admit when you are wrong and move on quickly. Successful people often become perfectionists; this is a quality not suited for trading. Good traders don't insist on getting them all right. The goal is to make money. Doctors often want to 'save the patient' at all costs. In the market, sick stocks are cut short quickly.
Do you know, right now, what strategies you want to play in this market? This month? This week? Today? Do you know what strategies you want to play at different times of the day? Do you know how to handle all of the market maker tricks? Do you know how to handle reversal times? You see, the market is designed to extract money quickly from the unknowing. It is a game where very many supply much money to the very few. What side of this equation have you been on?
You need to develop a trading plan that outlines your total business plan when it comes to how you want to trade. You need to outline the strategies you want to use, and when you want to use them. You need to outline money management rules. How much will you risk on that scalp? How much on that core trade? How much can you afford to lose in one day? To do this, you need to begin to understand trading and all the concepts it involves. This is the single most important step, and I could go on for hours. Yet, the vast majority of new traders do not have a plan.
Everyone has a different level of money and time they can devote to getting educated. That is fine; there are different ways to approach your education. Some want to improve their core trading to help the returns of their IRA while they work full time at their job. Some want to make their living trading the markets full time. Make sure you start out paper trading or trading very small risk amounts. As you get educated, move up the share sizes very slowly and only upon success. Most traders lose too much in the beginning before they get educated, that they cannot come back by the time they are educated. Don't let this happen to you.
Pristine is the elite trading school. We have programs that vary from mini online courses, to total training programs. If unsure, we have Power Trading Workshops you can attend most nights so you can sample the quality of our educators and what we teach.
For the beginner, we have a wealth of information available for free. Make sure you are signed up for our free services, if you are not already. Make sure to take advantages of the Power Trading Workshops we do every week. We have a schedule of free seminars at www.pristineworkshops.com.
Eventually, if you are going to learn to trade, we suggest you take one of our trader courses or programs http://www.pristine.com/Education/Courses.aspx. At Pristine we do all we can to ensure your success, that is why many of our programs have extensive follow up in chat rooms and with coaching sessions to make sure you can understand and apply the concepts.
For those who do well but want some ideas and training, consider our service packages. Two real time trading rooms, and three daily letters with picks and education.
Closing Comments
There are those that continue to pay the market every day, only they often walk away with very little education. Some traders lose more money in a week than it would take to get a good start on an education. Don't be one of the people with the mindset of, 'When I make enough money trading to pay for a seminar, I will take it then....' Think of the logic in that statement. The training must come first, or it will never come.
Pristine Capital Holdings, Inc.
1-800-340-6477
Counselor@Pristine.com
http://www.Pristine.com
![]()
Pristine – A trading style often imitated, But NEVER matched
Using Watchlists in Pristine ESP
Pristine ESP Stock Screener Trading Tips - October 31, 2012
A free Pristine service published every Wednesday
Sponsored by http://www.Mastertrader.com
Just a quick reminder: if you have not been receiving these "ESP Tip of the Week" newsletters you can view all of the back issues at the ESP resource page on our website.
When you are working in any of the Pristine ESP v4.0 scan windows, you have the ability to filter the stock market based on the various markets, the type of stock, the stock price, volume, and several other factors. This allows great flexibility and the ability to zoom in on the types of stocks you want to be trading. Some traders however, have already created their own personal "universe" of stocks and want to scan only their list of stocks for the Pristine setups. ESP gives you the ability to do this quite easily and I will show you how in this week's ESP Trading Tip.
For simplicity, let us say I want to create my own personal watchlist that contains only the 100 stocks in the NASDAQ 100, and I want the Pristine Opportunity Scanner to only scan these 100 stocks for setups. This can be set up in only a few seconds once you have your watchlist in any kind of word processing document.
First, from the LaunchPad, click on "New Watchlist" in the Watchlist Manager section. Type in the name of your new watchlist, and click "OK".
Your new watchlist will open in a watchlist format. It will be blank. Note that you could type in the symbols one at a time where it says "enter symbols".
However, the Pristine ESP watchlist manager allows you to paste as many symbols as you like at one time so an entire watchlist can be imported instantly. For example, open the document that has your watchlist (most trading platforms let you save watchlist into a document format, or you may download a watchlist you obtained from the Internet).
Simply select all the symbols, then copy and paste them into the new watchlist. Hit "enter" and all the symbols will appear.
This now becomes a new watchlist that you will find in the watchlist manager on the LaunchPad. You can open this whenever you like and manipulate the data by adding or removing columns and sorting the data.
Note also that this watchlist now appears in the Pristine ESP 4 opportunity scanner. Simply go to the LaunchPad and open "Pristine ESP 4" (or open anyone of the preconfigured layouts), click on "watchlist" (it may be in the "menu" button), you will see your new watchlist there.
If you check your new watchlist, ESP will only run the Pristine scans on the watchlist you have selected. You can select multiple watchlists. If no watchlists are selected then ESP will run the scan on the entire market limited to the choices you have made in the "Filters" menu.
Look for more exciting tips in next week's "Pristine ESP Stock Screener Trading Tips". Make sure to check out the other resources available to you when using pristine ESP on our website at http://www.pristine.com/esp/Stock-Screener-Resources.aspx. You can take a free trail of ESP by clicking on the link on the right side of this page.
Pristine Capital Holdings, Inc.
1-800-340-6477
Counselor@Pristine.com
http://www.Pristine.com
![]()
Pristine – A trading style often imitated, But NEVER matched
A Beginner's Handbook Part 1 of 3
The Eyes of a Pristine Trained Trader - October 29, 2012
A free Pristine service published every Monday
Sponsored by http://www.Mastertrader.com
Welcome to trading. Are you new to this field? Or is it called online stock buying? Or is it day trading? Or is it investing? Well let's get a few terms straight. This will be the first of a three part series, "A Beginners Handbook".
First, at Pristine, we consider 'buy and hold' something that is no longer a term that should be applied to the stock market. Do this if you like in real estate, bonds, gold, but not stocks. It implies a long-term buy and hold with your eyes closed approach that should no longer be used in the stock market. The term 'investing' is fine as long as it does not mean 'buy and hold'. There is nothing wrong with long term holds. We believe in swing trades and core trades that could last for months or years in some cases. However, they are 'managed'. As traders, we do not close our eyes hoping all will be all right. Traders are educated in technical strategies and discipline. They become self-sufficient
Most of today's large cap companies are in the technology area. These companies are subject to having their main product replaced by a new technology very easily. Long ago, it required many years for any company to start up a new car company and over take General Motors. Today, anyone can create software in their garage that can revolutionize how something is done and put a competitor out of business. Look at the company Iomega, for example. They are the makers of the infamous zip drives that appeared on computers years back. The current technology at the time was storing information on 1.44 meg disks. They came out with a system to store 100 megs on a disk, and got contracts to put their drive on every major computer. Sounds like a company you can buy and hold forever, doesn't it? It is, until someone discovers that the same information can go on a CD and have it cost much less. At that very moment in time, literally overnight, Iomega is out of business; unless it has other products to sell. The rule is 'change or become extinct'. This example is found over and over again in everything from video sales to computer chips.
When practicing 'buy and hold' (as opposed to long term trading), you are relying on news and announcements and fundamental data. Many of you have probably already discovered how worthless this process is. To the extent it has a valid use; it is never to take the news or information at face value. Take a look at Amazon's recent earnings. You can look wherever you want, the comments were the same. "Results from Amazon (AMZN) ... also disappointed the Street".
If you are relying on news to make decisions, it must be time to get short AMZN, right?. However, take a look at what happened after the dismal report was out. There was no other news. Those of you that already know this see this happens all the time.
So if 'buy and hold' is out, what do we do? You hear stories all the time about all of the 'day traders'. You look around you and you don't see many. You may not even know any besides yourself and those you met at a seminar. Unfortunately, the term 'day trading' is often misused by the media. There is a large group of people that we call 'online investors'. These are the folks that use their computer in place of their telephone to call places like E-Trade, Schwab, etc. and place their orders. They are typically managing their savings or IRA money, and are typically untrained. They were plentiful during the bull run of the 90's, and often were wrongly called 'day traders'. They did not need to be trained because they made money buying stocks in the late 90s no matter what they did.
Most of them are all gone now.
We consider our selves 'traders', but this does not include the much larger group of 'online traders' mentioned above. Traders use technical analysis to find, enter, and manage trades. That applies to long or short term trades. Those that are focused on trading and exiting by the end of the day with that account are called day traders. We consider traders people who spend a good part of the day with the market. Those who are trained to manage positions that may last from several minutes to several months. While we believe that 'buy and hold' is a dead term, we do use many time frames to hold stocks, the longest of which is a 'core' position. While a core positions may last for months (or years), it differs from investing because there is an exact exit strategy planned for a core position. We also use a 'swing' time frame. This is one that may last from 2-5 days. We also use tactics that would have us holding a stock overnight one time, or exiting the same day. Sometimes exiting part of a position only minutes after entry.
So if you are going to trade, how do you buy stocks? If you are trading only a few trades a week, and limiting yourself to swing and core trades, using on of the 'online brokers' is fine. The time it takes to have your order filled is not very fast, but for occasional long-term trades it is acceptable. If you are going to be trading more often, or trading in and out the same day, you will want to use a 'direct access' broker. This is a broker that lets you see all of the market participants, where they are buying and where they are selling. You then place your own order on your computer screen and many of these orders will have instant executions. By instant I mean instant, usually within a fraction of a second. If you need a broker, or not happy with your current broker, consider Mastertrader.com. It has the best rates and service, a variety of platforms, and you earn points to use at Pristine for services and seminars.
So, you know what you want to do, and you have selected a broker. Now you need a computer and an Internet connection. Again, for occasional swing and core trading, any machine that can access the Internet will do. If you are going to be active intraday, you will need to have something better. You will need a computer that is competitive with the current top of the line computer, or is at least current with the technology within the last 12-24 months. You will want a fast Internet connection. You need to be looking at Cable, FIOS, Satellite, or T1-3. Depending on where you trade, you will have to evaluate which of these is available and most effective for your money. You will need to have a working knowledge of computers, as your time with the computer will be extensive whether you want it to be or not.
So now you are ready to trade, right? Well, no not really. The biggest distinction I made earlier was that 'day traders' are educated in trading strategies and disciplines. This will be the focus of the next Lesson, how to start out trading when you have no education or experience in trading. I will discuss how to build that education as you go, without using up all of your capital.
Closing Comments
There is perhaps no greater occupation to have than that of a professional trader. Yet, few achieve that title. Few achieve, even thought thresh hold is not that high. In terms of cost and education, most anyone is capable. You have to set yourself apart, and be different. That is part of what we will talk about next week. Until next week, good trading.
Pristine Capital Holdings, Inc.
1-800-340-6477
Counselor@Pristine.com
http://www.Pristine.com
![]()
Pristine – A trading style often imitated, But NEVER matched
Good Stocks - Bad Market
Chart of the Week - October 29, 2012
A free Pristine service published on select Mondays
Sponsored by http://www.Mastertrader.com
In a correcting market environment you better know how to determine which stocks are "acting well" and which aren't if you're going to trade the long side. Acting well is a term often used to communicate that one tradable instrument is outperforming something else. This could be the broader market, a sector, another stock or a market internal gauge. For the stocks we are going to look at it, will be relative to the broader markets. It can also mean how that tradable instrument reacts to gaps, support, resistance or the lack thereof.
In addition to knowing which stocks are acting well, you'll need to be able to determine with relative accuracy when the market is likely to bounce a bit. In a correcting market even the stocks acting well have a greater tendency not to rise when the market is falling. However, when the market makes a short-term low these stocks are likely to act even better. Meaning, go higher.
The first thing that we want to consider is the market timing. For this example I will use the Nasdaq 100 ETF symbol QQQ, which has actually been weaker than the S&P 500 and the Russell 2000.
QQQ has reached its first area of price support since breaking down (closed the VOID) and has stabilized between 65 and 66. Friday, prices broke below the prior three days lows, which were very close to each other (a minor breakdown) and rallied back up toward the high of the day. Pristine Tip: A Bottoming Tail (BT) bar that forms in this way - at prior price support - is a strong indication of a short-term low. Now we need to see if QQQ can trade above Friday's high for confirmation of this price action.
The chart of YAHOO (YHOO) is most interesting in that it bottomed at close to the same time that QQQ topped. YHOO began to show its strength when it was able to move sideways, rather than retrace lower after the strong rally that created a Pristine Price Void (PVV) below. As QQQ began its decline, YHOO moved sideways at the prior resistance to the left and absorbed that supply (red area). This is what I call acting well. Once it formed a new support pivot, buyers came in when prices dropped back to retest that area. Lastly, YHOO gapped above the sideways consolidation it had formed creating another PVV and has held above that area. Wow, YHOO really acts well!
CREE is another stock that acts well. While it did have a failed breakout and then move lower with QQQ, it recovered relatively quickly. Like YHOO, CREE has moved sideways at its prior resistance and is absorbing the supply there (red area). Plus this is happening after a large gap up that created a PVV. Also, on 10-19 when QQQ formed a Bearish Wide Range Bar (-WRB), CREE formed a BT! CREE then formed a new support pivot, has not even come close to test it, and after Friday's bullish day it isn't likely to. Cree is looking real good.
I pointed out that Harley Davidson (HOG) had formed a bottom on 10-19 on my first post on Twitter. While HOG was showing relative weakness to the broader market prior to October, it was bottoming. As I showed at Twitter and Facebook, the reason this bottoming action really interested me is because the monthly time frame of HOG was a Pristine Buy Setup (PBS). You can check out the charts at Twitter and Facebook. Like YHOO and CREE, HOG is moving sideways after a strong move at resistance and is absorbing the supply there (red area). Notice that HOG broke below the prior two day's lows on Friday. While it did not recover back the high of the day; these breaks can result in a move higher if prices move above high. HOG is acting well too.
There are other stocks out there acting well and now you have some of the guidelines of what to look for. What to learn more? Sure, who doesn't? This week's Free Workshops are packed with education lessons that you do not want to miss. Check out the line up and get registered early. I will be doing Tuesday's workshop. In it I will show you what I do with our students in my coaching sessions. We'll go over concepts like VOIDS, Creating Support and Resistance, Absorbing Supply, Failure Patterns and a lot more. Those attending will receive a free educational gift also. This session will not be recorded as my coaching sessions for students to review. I look forward to working with you Tuesday!
All the best,
Pristine Capital Holdings, Inc.
1-800-340-6477
Counselor@Pristine.com
http://www.Pristine.com
![]()
Pristine – A trading style often imitated, But NEVER matched
A Trader's Progress
Trading Lesson of the Week - October 25, 2012
A free Pristine service published every Thursday
Sponsored by http://www.Mastertrader.com
There is a common sequence of events that most traders go through during their development. This begins when many of the strategies that the trader is learning begin to come together and the trader begins to see the light. This can happen slowly with a cautious trader who has been paper trading or playing with a small share size. This can happen for aggressive traders as they start to have some big numbers in profit on some of their better days. However, while the trader begins to feel good, there usually are some lingering problems. While the light seems to be coming on, the account is not growing. It seems that every time some progress is being made, something happens that stops this progress and the account does not grow. It is 'one step forward, and two steps back'. If this is something that you can relate to, you are not alone.
Spending time in this area to understand this process is very important to your development as a trader. If you review your records you will likely find several good trades throughout the week, and then a bad trade. One so bad it really sticks out. So bad, it erases all the hard work of the prior gains that you were so proud of. It may show up as several profitable days and then one day that erases all the prior gains. If this is the problem you are having, there is good news and bad.
The good news is that you are now doing well with the 'technical part' of trading, and now have to deal with the psychological part. The bad news is that you are now doing well with the 'technical part' of trading, and now have to deal with the psychological part! Psychology is not an easy thing to deal with. The answer? First, it's self awareness. It's identifying the issues at hand as being psychological. Once we've admitted we have the problem, we must build and change our Psychology so that it is conducive to making money in the markets consistently and without fail.
We teach many procedures that traders can take to help their progress at this point. Use a trading plan, keep detailed records, and track the strategies you use. Print charts of your trades to analyze your discipline, trading plan, and strategies. Make a plan to eliminate recurring problems. Use money management that prevents catastrophic trades or days.
Once the trader eliminates their 'demons', they will likely see an improvement in their trading. Unfortunately, that is not the end of the psychological issues. Sometimes a trader uses all of the above tactics to make great improvements and even become successful, then gets 'over confident' with their new success and abandons everything that got them where they are. The road will always be full of new challenges, the traders that thrive have on ongoing plan and a commitment to patience and discipline.
We spend countless hours in our Free Workshops and seminars and especially with our Pristine Graduates to make sure they stay on the right path. I for one experienced this very problem. You can break through any psychological roadblocks you may have to take your trading to the next level. We at Pristine value your success and have the utmost in respect and admiration for you on your journey to Trading Mastery. Allow us to help you as we've all been there before and there is no sense in re-inventing the wheel.
Jared Wesley
Contributing Editor
Interactive Trading Room Moderator
Gap and Intra-Day Trading Specialist
Instructor and Traders Coach
Pristine Capital Holdings, Inc.
1-800-340-6477
Counselor@Pristine.com
http://www.Pristine.com
![]()
Pristine – A trading style often imitated, But NEVER matched
If you have any questions on this Lesson of the Week (LOW) or any other past edition, please send to staff@pristine.com as we would be happy to hear from you.
Pristine Facebook Group Post - October 23, 2012
http://www.facebook.com/groups/69054992817/
Sponsored by http://www.Mastertrader.com
Here is what I saw on Friday that said HOG was going higher. The technical pattern was forecasting the news to come and that those in-the-know were buying.


Pristine Facebook Group
http://www.facebook.com/groups/69054992817/
Pristine Facebook Page
http://www.facebook.com/PristineOnlineTrading
Using the Icons at the Bottom of ESP Scan Windows
Pristine ESP Stock Screener Trading Tips - October 24, 2012
A free Pristine service published every Wednesday
Sponsored by http://www.Mastertrader.com
Just a quick reminder: if you have not been receiving these "ESP Tip of the Week" newsletters you can view all of the back issues at the ESP resource page on our website.
This week's tip is going to be about the functions that you can perform by clicking on the icons available at the bottom of each Pristine ESP v4 Scanner window.
The picture above is one of a Pristine Sector Watchlist, however all of the various windows in Pristine ESP have similar icons on the bottom. There are two on the bottom left side of the window, and seven on the right side.
The first icon on the left, the picture of a disk, is used to save the window when you have made changes to the columns, positioning, size, etc. of the window (remember that if this window is part of the layout you want to save, you also need to save the layout). The second icon is for "efficient view" and removes from view the various items at the top of the window to save space on your screen. Many of these things on top are not needed once the window is set up.
Of the eight icons on the bottom right of each window, the first one is used to simply bring the LaunchPad in to view. In a similar nature, the second icon is used to bring the layout manager in to view. The third icon allows you to 'group' any ESP windows together. Just click the icon on to a window and assign it a color (see ESP Tip 39). The fourth icon allows you to change the title of the current window you are working with. For example, the title of this window is "Pristine Sector Watchlist". That can be changed by simply clicking on this third icon. The fifth icon is a very powerful one that allows you to export all the data in the current window to an Excel or Word document. This is exactly what is used when you wish to create and export a watchlist to your trading platform, or to save so it can be reimported into ESP as a new watchlist (see prior editions of this letter for tips on using watchlists).
The sixth icon, with a picture of a little wrench, is used to set the settings for each type of window. The settings will apply not only to the current window you have open, but every window of that type. For example all Pristine Opportunity Scanner windows will share the same settings. All streaming filter windows will share the same settings.
The seventh icon has a picture of the camera and allows you to take a picture of the current window, or the entire layout. This can be helpful to use as a backup or to re-create prior layouts in the future for any reason. The last icon allows you to clone the current window. This allows you to capture all the settings and sizes from the current window and re-create an exact duplicate. This can be useful when setting up a new layout and you have similar windows that you want to show that we have small differences between them.
Using these various icons can make ESP more powerful, and can also make it more friendly and efficient to use.
Look for more exciting tips in next week's "Pristine ESP Stock Screener Trading Tips". Make sure to check out the other resources available to you when using pristine ESP on our website at http://www.pristine.com/esp/Stock-Screener-Resources.aspx. You can take a free trial of ESP by clicking on the link on the right side of this page. Also be sure to attend the free ESP training class every Wednesday at two o'clock ET, you can log in from the recourses page.
Pristine Capital Holdings, Inc.
1-800-340-6477
Counselor@Pristine.com
http://www.Pristine.com
![]()
Pristine – A trading style often imitated, But NEVER matched
Bringing Common Sense to Trading Part III
Chart of the Week - October 22, 2012
A free Pristine service published on select Mondays
Sponsored by http://www.Mastertrader.com
In a prior Chart of the Week (COTW) titled Bringing Common Sense to Trading Part I, I explained how to determine turning points and continuation points with price action alone. This week I am going to show why prices trended as they did Friday.
In that prior COTW, I also told you that price oscillators, various other indicators and drawing lines to determine turning points or support and resistance have nothing to do with prices reversing when they do. Friday's drop should reinforce that fact for you. To an extent, these analysis tools do have a self-fulfilling prophecy at times since so many people have been taught to believe the fallacy and use them.
The internet based online trading education industry perpetuates these hocus-pocus indicator based methods. Not much has changed over the years. When I started to learn about trading the markets there was no online education, since there was no internet. However, there were mailed letters that gave recommendations and some education. Like most online educators now, those letters also used the indicator mythology.
It's not easy getting started with so much information to sift through about how to use these types of technical analysis to trade and invest. I did not side-step the learning and use of indicators, but I did eventually see the truth. Through these COTW letters and our other services I hope you will see through these deceptions that create confusion about price movement.
Okay, let me explain what happened on Friday.
Before we get to Friday, above is a chart that I posted at the Pristine Facebook Fan Page and the Group Page last Wednesday. In it I showed why sellers would show up the next day, and they did. I also said that ES (ES is the e-mini contract for the S&P 500) retraced further than I thought it would, but those Topping Tails (TT) suggest that short-sellers are waiting to pound it again. This alone did not suggest or predict how much prices would fall on Friday. However, what made that possible was the way prices moved up to the area of the prior TTs.
The key here is the fact that there is virtually no overlapping of the candles on the way up. Each candle started at or very near the prior candle close and did not retrace back into the prior candle. In other words, this is a continuous fluid movement. There is no uncertainty among the majority traders. Prices are going up; buy or get out of the way!
This arrangement of candles displays strength, power and momentum. But if that is the case, how could prices fall as far and as hard as they did? While this arrangement of candles does display strength, it is the weakest link also. As I have explained in the past, one of the most powerful concepts to understand is that of supply and demand. Where sellers and buyers are and when there is a Void of them.
The way prices moved up into the supply area and the TTs (little to no overlap between candles) it created what I refer to as a Pristine Price Void (PPV). When prices move upward so fast there is no support under prices. There are no pullbacks or sideways consolidations. So there is nowhere to buy a pullback based on a price support as a reference point (demand area). There is a Void of support or demand because prices moved higher so fast. In addition, as current prices move sideways over time they move away from any small support area that might be there. This makes any small support area irrelevant.
This is a common question students have. What about that small area of price support? What is more powerful or meaningful, that small area of consolidation or the bearish daily time frame and intra-day bearish shock? It's the weight of the evidence to consider as a whole, not one piece of information.
Pristine Tip: A truly strong momentum move does not need support. It creates it. I discussed this in the COTW Bringing Common Sense to Trading Part I. Look for momentum moves that begin from a consolidation and have a PVV overhead. Not moves that end at the top of a range.
In the chart above, I've shown the daily time frame at the upper left and the 60-min. time frame. In the 60-min. you can see how little congestion (stall in prices moving higher) there is, especially on the Tuesday the 16th. As prices moved sideways and away from what little intra-day overlapping there was, it made those areas less relevant as a reference point of support.
The essence of a Head and Shoulders top is that the upward move has ended when the new high fails (the head) and that the time moving sideways (the Shoulders) signals distribution. That price pattern creates a Void below. Also in this example, there is a shock that occurred on the 18th and confirmed the bearishness of the bigger daily picture.
Let's assume that you had no idea of the bearish big picture and potential for the larger decline. It's conceivable that you could have thought that prices have fallen a lot and would bounce on Friday and looked for long trades. Well that's fine, but unless the price action becomes climactic near a prior support area or there is an actual trend change on the time frame being traded (in this case the 5-min.), there would be no objective reason to buy. This is a rule all Pristine students and prop traders are taught from the start. Include it into your trading plan and it will eliminate a lot of unnecessary loses.
I hope this COTW has helped you understand why prices moved as they did on Friday and see that the commonplace indicator based mythology is unnecessary and misleading.
I will be presenting a Free Workshop on Tuesday October 30th. At it I will be discussing what we covered today and other Pristine trading strategies. It will be similar to the coaching sessions I do with students and hope to talk to you there. Also get into this week's workshops and keep up the learning.
All the best,
Pristine Capital Holdings, Inc.
1-800-340-6477
Counselor@Pristine.com
http://www.Pristine.com
![]()
Pristine – A trading style often imitated, But NEVER matched
The Eyes of a Pristine Trained Trader - October 22, 2012
A free Pristine service published on select Mondays
Sponsored by http://www.Mastertrader.com
Good Morning All:
If you are an experienced trader, you can skip reading this article. If you are new, or if you have been at this less than a year and not making money yet, you may want to read this. If you have been at it more than a year and are not making money, you probably will not read this.
To a Handful of Traders Out There
I have to accept the fact that there are very few people willing to recognize in the early stages of trading that they need an education. It should seem obvious, as it is the only acceptable route in any other high-paying profession. While I have to accept that fact, I do not really understand it. Having excepted it, I know that the next best thing we can do at Pristine is to make sure people stay under our wing until they are ready to advance their careers through a proper education.
We want to make sure that you stay with us even if you have not yet made a commitment to be a full or part-time trader, or to manage your own long-term money. To do that we want to continuously improve you and your knowledge by offering a variety of ways to obtain great information for free. Every 6 to 8 weeks we do a seminar called "Online Trading Essentials". There is a nominal charge for it but if you are currently a Pristine student you can get it for free. If you are in the process of discussing a seminar with a counselor, you may also be able to get it free. Talk to your counselor. It is a great class that delivers four and a half hours of nonstop critical information about many of the topics that traders need to know about trading. Everything from advanced concepts about risk management and share sizing, down to what a level II screen is for, and how to use news and/or fundamental analysis in your trading. This is all information that is critical to know, yet on the other hand is too basic to actually be taught in our paid for seminars as they focus purely on technical or more advanced topics.
In addition, we are introducing a new series of "Power Trading Workshops" that are designed to deliver more information and they come to you Monday through Thursday (some weeks may only be three days) at 4.15, just after the market closes. Some of these will have new topics that have not been discussed, and some will blend some old favorites and new twists. Naturally, we still have new people who want to know about Pristine and about some of what we teach, and that will be included in some of the topics as well. You can view the schedule for these on our homepage or in the e-mails that you receive. They are under the topic of either "Power Trading Workshops", or "Free Webinars".
Closing Comments:
We want you to be successful. We believe there is no choice where to go for education and we are willing to prove it to you by making sure that you come to Pristine for all of your needs both on a free and paid for basis. When the time is right we will be here for you. By the way, one of the most common reasons someone signs up for a seminar with us is a referral from a friend or family member who is a current client. There is no better complement than that.
Pristine Capital Holdings, Inc.
1-800-340-6477
Counselor@Pristine.com
http://www.Pristine.com
![]()
PRISTINE - A trading style often imitated, but Never matched.
Trading Lesson of the Week - October 18, 2012
A free Pristine service published every Thursday
Sponsored by http://www.Mastertrader.com
Losing Properly Requires Great Skill, Rigid Discipline and Deep Seasoning
There is no opportunity without risk; thus, learning to truly accept risk is the first steps to trading freedom. We teach that once we are in a trade, we employ "trade management" strategies for purposes of taking profits or protective stops. Trading involves speculation, which, by definition, involves risk; therefore, accepting "loss" is a necessary part of trading.
Our objective is to help you approach the market in a disciplined, objective approach, with a high focus on managing risk (and loss), to help you overcome the tremendous hurdles during your quest to become a profitable self directed trader. A trader refusing to accept loss is as ridiculous as a pilot not accepting turbulence during flight, and should consider not trading.
Any winning strategy necessitates the ability to lose properly. It is the capability to deal with, and "make good" of, one's losses that enables winning traders to keep a positive mental attitude. It also enables them to progress and effectively maintain their winning ways.
Losing properly is not easy and therefore requires great skill. You need to be able to learn from your mistakes. Ask yourself if the trade actually met the criteria of your trading plan. If it did, then could you have averted the loss, or was it a good setup that was consistent with your strategies? If you made an error in judgment make sure that you learn from it.
The discipline involved with losing properly has to do with taking the loss at the right time. Did you sell at an intelligent time, with your stop placed just beneath support? Or, did you not take your "intelligently" placed stop and sell at a lower price than you should have? Discipline is also necessary when preparing for the potential loss. Make sure that your stop allows for a level of risk that you can stomach, and is compatible with your strategy. This will help you to be comfortable with "losing" properly.
Seasoning has much to do with maintaining a positive mental attitude. Seasoned traders do not let their losses "get them down." They understand that the loss may actually be a "friend," as it creates an opportunity to learn from. They apply the knowledge and use it to improve their trading and maintain a winning attitude while accepting and brushing off the loss.
Come join us in our 3 live interactive trading rooms where you can see us in action using the Pristine Method and the proper tools to trade with on a daily basis. You can register for a free trial if you have not done so in the past 6 months.
I look forward to seeing you soon.
KURT CAPRA
Contributing Editor
Instructor and Traders Coach
Pristine Capital Holdings, Inc.
1-800-340-6477
Counselor@Pristine.com
http://www.Pristine.com
![]()
Pristine – A trading style often imitated, But NEVER matched
If you have any questions on this Lesson of the Week (LOW) or any other past edition, please send to staff@pristine.com as we would be happy to hear from you.
Pristine Facebook Group Post - October 18, 2012
http://www.facebook.com/groups/69054992817/
Sponsored by http://www.Mastertrader.com

Pristine – A trading style often imitated, But NEVER matched
Pristine Facebook Group
http://www.facebook.com/groups/69054992817/
Pristine Facebook Page
http://www.facebook.com/PristineOnlineTrading
Pristine ESP Stock Screener Trading Tips - October 17, 2012
A free Pristine service published every Wednesday
Sponsored by Mastertrader.com
Using Columns in the ESP Main Windows
This is a repeat from almost a year ago due to several questions on the topic, and the power of ESP to use columns in a way that can make you money.
This week's tip is going to be about using the columns that are available in the Pristine ESP v4 Scanner. This is a very powerful feature of ESP as there are many useful columns you can add to sort and manipulate the data and it is very simple to add, remove, and sort columns. The window below is a sample of one of the many windows that can be used in ESP.
Naturally, you may drag the outside borders of the window which will increase or decrease the width of all the columns. If you want to adjust the width of one column, simply hover your mouse over the area between the two columns in the column header row. When you hover your mouse in between column headers it will turn into a double headed arrow so you can resize the column as you wish. Look at the example below.
To rearrange columns simply click on the title of the column you want to move, and drag it to where you want to go.
When you click one time on the title of a column, ESP will sort all of the information by that column. A little triangle appears next to the name to let you know that that is the column being used for sporting. If you click again the little arrow points upward and the column is now being sorted in reverse order. In the window above, you can see that the data is being sorted by "% Chg". In the window below, the "Volatility" column is now being used to sort.
When you "right-click" on any column, you have the options that you can see in the window below. You may remove the column that you have clicked on, or you may add any additional column at that point that you choose. You can see that ESP has a tremendous range of columns that can be added. This is a very powerful feature that allows you to sort your data by any one of many criteria. There are too many columns to even review in this article, but feel free to play with them and attend one of our ESP training classes (see the "ESP resources page" on our website). Note that the column choices are different in "Pristine Opportunity Scanner" window due to the unique nature of the Pristine proprietary scans.
The wide variety of columns and the ease of use to manipulate data makes ESP the most powerful stock screener available. Be sure to take your free one-week trial when you aThe wide variety of columns and the ease of use to manipulate data makes ESP the most powerful stock screener available.
Look for more exciting tips in next week's "Pristine ESP Stock Screener Trading Tips". Make sure to check out the other resources available to you when using pristine ESP on our website at http://www.pristine.com/esp/Stock-Screener-Resources.aspx. You can take a free trial of ESP by clicking on the link on the right side of this page.
re ready.
Pristine Capital Holdings, Inc.
1-800-340-6477
Counselor@Pristine.com
http://www.Pristine.com
![]()
Pristine – A trading style often imitated, But NEVER matched.
Pristine Facebook Group Post - October 16, 2012
http://www.facebook.com/groups/69054992817/
Sponsored by http://www.Mastertrader.com

Sami Abusaad
Pristine Trader & Coach
Pristine Capital Holdings, Inc.
1-800-340-6477
Counselor@Pristine.com
http://www.Pristine.com
![]()
Pristine – A trading style often imitated, But NEVER matched
We'll See a Bounce, But Not the Bottom Yet
Chart of the Week - October 15, 2012
A free Pristine service published on select Mondays
Sponsored by http://www.Mastertrader.com
In the Chart of the Week (COTW) dated Monday 9/17/12, I showed you why a short-term correction was near. This was regardless of the bearish October Phenomenon. As I said then, the time of year alone is not a reliable guide without other factors being in alignment. Those factors are - the right price action and speculative bets being placed on higher prices.
In that COTW I showed that this was happening and it virtually insured a short-term correction was close. As we know now, Friday 9/14/12 was the high day of the current move. If you would like a copy of that COTW you can e-mail me at greg@pristine.com or e-mail counselor@pristine.com for it and it will be sent to you.
In the chart above, the S&P 500 is displayed by the ETF symbol SPY. The bulls attempted to hold the prior low in the 143 area of SPY last week, but could not. With an area of Major Support (MS) in the 140 area, it's an obvious place to except a bounce from.
Ideally, prices would drop straight down into it similar as they did from early last week. This would create a small Pristine Price Void (PPV) for prices to bounce up into. Assuming we see this setup, I would not play this as a swing trading long. Meaning, I will not hold for a few days, since what is needed for a bottom is not yet in place. Rather I'll use the area as a reference point where the intra-day time frame will bottom and start a short-term uptrend.
Historically, correction bottoms do not occur without the majority convinced that the market is going lower and they make speculative bets on that. We are not seeing that yet based those option traders that are typically on wrong side near turning points. These are the under-capitalized, overly-emotional traders that bet big at the worst time. I've used their actions at a guide for many years and they rarely fail to signal when the turn is near. When these traders start loading the boat with put options (bearish bets) the odds are that a tradable low will not be far off.
Lastly, let's look at the NASDAQ 100 index ETF symbol QQQ
In the above chart is a Head & Shoulders pattern that formed in the NASDAQ 100 ETF symbol QQQ. The pattern is simply a new high that has failed (longs are caught) and break of prior support. I typically don't show or talk about the esoteric types of analysis that I studied in the past. However, I thought I would show this and how it aligns with the simple technique taught at Pristine.
The Head & Shoulders top theory is that the vertical length of the area between the head of the pattern and the neckline (the base) will give you the point where prices will decline to by projecting the same length below the base. In the chart, you can see that I've drawn a line from the head to the base and then placed a line of equal length from the base going lower. That is where prices should decline to.
Well, based on the simple analysis of what was resistance becomes support, we see that the Minor Support (mS) area is the same as the measured low projection. I studied this many times years ago and it was virtually always the same. The projection lined up with an area of price support; it could be a minor or major area. The other lines below are simply other price support reference points to be aware of should the decline continue lower.
Complex analysis tends to impress us when starting to learn about trading based on technical analysis. We are conditioned to think that the markets are complex and it's needed. Most online trading courses are based on this type of analysis. If you have to buy software or indicators to trade be wary of such education. If your charts of filled with things like indicators, wave counts, Fibonacci projections, etc. The only thing you can be sure of is that the confusion will continue. There is a simpler, easier to understand way of trading the markets; it's Pristine.
PRISTINE - A trading style often imitated, but Never matched.
All the best,
Pristine Capital Holdings, Inc.
1-800-340-6477
Counselor@Pristine.com
http://www.Pristine.com
![]()
The Eyes of a Pristine Trained Trader - October 15, 2012
A free Pristine service published every Monday
Sponsored by http://www.Mastertrader.com
Good Morning All:
Over the years, I have written many articles; hundreds, maybe even thousands if you include partial repeats and every short lesson. Sometimes the lesson is a partial re-write, or a new take, or a new way to explain or organize the information.
While there are many summaries out there on various topics, and while the topics on this lesson may be found somewhere else, I began a three part series two weeks ago answering a very direct question: What causes failure in trading? This has been a no-nonsense, nuts and bolts look at the question, not a philosophical dissertation. Two weeks ago I discussed 'discipline' as the first true reason for failure. Last week I discussed reason number two; the inability to focus. Today I will discuss the third reason, which will end this series. There may be other reasons, but these are the top three. To clarify again, most people actually fail because they do not get an education. However, that is a decision that people consciously make. I want to discuss why the people who really try, can still fail.
What Causes Failure? Part Three of Three
Reason number three is the inability for traders to plan and follow up. This is a fairly broad topic, I agree. However, it has to be in there as one of the top three. Again, these three are not in any particular order. Yes, all of these topics are somewhat interrelated. Many may argue that this one is the most important. But what good is a plan, if you do not have the discipline to follow it in the first place? What good is a plan, if it is so expansive no one can review it accurately to see if it was followed?
When I talk about planning, I am not talking about planning with a small letter 'p'. I am not talking about preparing a watchlist for the day, or checking the earnings schedule. I am talking about planning the a big letter 'P'. I am talking about the Trading Plan. When I talk about a Trading Plan, I mean a very detailed plan or what you are allowed to trade every day, when and how you trade it, how you enter, how you mange, when you can change it, what strategies, and all the money management rules. This is not a 'cut and paste' from TPM or ATS. It is a well-planned version or what YOU are going to do every day, after acquiring all that knowledge from TPM and/or ATS. To make this simple, if you day trade without a trading plan you follow religiously every day, you WILL fail. You 'may' survive as a swing trader, depending on your background. We teach and coach Trading Plans primarily in our daily Graduate Trading and Dynamics Lab. They are talked about in TPM and ATS and HSTB also.
The other half of this third reason for failure is the inability to follow up. No Trading Plan is worth anything if it is not followed. Many traders have plans, but they sit in drawers. We teach a variety of methods of follow up that include printing charts, trading logs, and eliminating mistakes. Without these methods, there is little value to a trading plan.
Closing Comments:
This is the end of this three part series. To be sure, the number one reason traders fail is they do not receive a quality education. That is what we do at Pristine, provide the best education in the business. What I wanted to address here is, even after the education, why do some still fail. Lack of discipline, lack of focus, and the failure to create a trading plan and to follow up to make sure those first three are in place. That sums it up. Do you have these three eliminated? Eliminate these three reasons to fail, and you will have an outstanding chance for success.
Pristine Capital Holdings, Inc.
1-800-340-6477
Counselor@Pristine.com
http://www.Pristine.com
![]()
Pristine – A trading style often imitated, But NEVER matched
Chart of the Week - October 15, 2012
A free Pristine service published on select Mondays
Sponsored by www.Mastertrader.com
Is it Really Extended?
The chart and question shown was posted at the Pristine Facebook Group. Below is my posted answer.
The concept of being extended is difficult for most, if not everyone at some point for several reasons. I will discuss reasons generally and then in some detail. However, a complete understanding can only happen in class, but let's start here.
Extending means stretched out and suggests a return to a more "normal position." However, to most technical traders and investors, the word extended invokes the belief that the trend is close to over. Being extended has little to do with trends ending. Actually, extended initially suggests that the trend will continue.
The first step to clearing up the difficulty to understand extended is to realize that most taught methods of defining extended are based on completely subjective measurements. These have little to no consistency to define the end of a trend. Many times, they don't even result in a retracement to a believed normal position. This leads to confusion and of course a lack of confidence in the method. Exactly, what the question is communicating in the example using a moving average (MA) as a measure.
There are various technical tools to measure extended, but we'll discuss MAs now since that is what was used. As with all technical analysis tools there are choices to using them like the settings. Different settings will give different signals or measurements and then setup different beliefs based on them.
For example, if we use a simple 20-period moving average verses an exponential one we will see those MAs at different levels. Which one is the right one? Prices may appear to be extended from the simple type since it moves slower than the exponential.
What if we use a 10-period moving average instead of a 20-period? Prices may appear to be extended from the 20-period, but they are not from the 10-period. The 10-MA is averaging in the more recent prices were as the 20-MA is also averaging in the older prices as well and will be slower and further away.
Depending on what you have been taught or read, you will have a different set of beliefs about what is extended and possible. If you are convince to change the MA type or length, your beliefs change. Soon you'll be second guessing all of them. Been there?
Next, I am sure you have seen what is seemingly extended in one time frame that is not extended at all in another. For example, the 5-minute time frame may appear extended, but the 60-minute move has just started. In an example like that, traders focused on the 5-min. can be fearful of continuation patterns or breakouts and require a retracement. However, retracements often do not occur leaving those watching see the move become more extended. In fact, the chart and question is how to handle such situation. Without an understanding of how to interpret and combine multiple time frames anyone would be confused.
Lastly, and this comment is likely to raise a few eyebrows, but addresses a deeper understand of what the question relates to. The belief that prices are extended - even in a higher time frame - and that a trend is unlikely to continue is false. It will leave you scratching your head as you watch the extended prices become even more extended.
Here is the key and what I hope is a light bulb moment for you. Historically, prices will continue trended higher until the Pristine Price Void (PPV) is closed, Major Support (MS) is violated or resistance is created. In other words, there is no objective reason to think the trend will end, so don't. These concepts are covered in great detail in our Advanced Technical Strategies (ATS) class.
Pristine Trend Analysis is based on the concept that a trend will continue to a price reference point were traders will sell at. Without that reference point (a Void) to sell at, traders are just guessing at what is extended and where the trend may end. I wrote about this in a Chart of the Week (COTW) titled, "You Have Been Setup to Fail as a Trader." You read it at www.pristine.com. These COTW lessons are rotated and if it is not there by chance, e-mail counselor@pristine.com and request it. It will be sent.
The distance to a moving average alone is incomplete information and misleading. Adding additional indicators like oscillators will add to the confusion. There are hundreds of these indicators to choose from and when you add the choices of the settings possible, the combinations are endless. It's no wonder why there is mass confusion about technical analysis based trading.
Clearly, extended is a subjective idea if based on a single concept like the distance to a moving average. Students of the Pristine Method® learn to use Multiple Time Frames, Trend Quality, Relative Strength and Weakness, Support, Resistance and the lack thereof (Pristine Price Void), the influence of the Market or a Sector, Market Internals, Inter-Market Analysis and others. There is a lot to learn to become a professional in any field and technical trading/investing is no different.
If you are trading stocks, a futures contact like the S&P 500 e-mini, a commodity or a Forex currency pair based on generally accepted technical analysis tools. Odds are that you are thinking that there is no way you will ever understand price movement. You can and it does not have to be complicated. However, it does require the right education.
All the best,
Pristine Capital Holdings, Inc.
1-800-340-6477
Counselor@Pristine.com
http://www.Pristine.com
![]()
Pristine – A trading style often imitated, But NEVER matched
Pristine Facebook Group Post - October 11, 2012
http://www.facebook.com/groups/69054992817/
Sponsored by http://www.Mastertrader.com

Not every setup is going to work, that’s a fact that we all know from experience. With that in mind, here is an example of multiple candle concepts coming together that typically do produce higher prices, but didn’t.
Now, Pristine students learn to place candle patterns in a shorter time frame in the context of a higher and its support or resistance. In this case, the unfilled gap (void) from the open was calling.
In addition, the NYSE TICK showed that there was no power behind the bottoming pattern. All that being said, I would not blame someone for buying above the BT candle’s high based on the concept of retest patterns like the one that formed do “create support.” However, prices were not able to get above the BT high, which was a bearish sign in of itself.
Hope this little lesson helps.
All the best,
Pristine Capital Holdings, Inc.
1-800-340-6477
Counselor@Pristine.com
http://www.Pristine.com
![]()
Pristine – A trading style often imitated, But NEVER matched
Pristine Facebook Group
http://www.facebook.com/groups/69054992817/
Pristine Facebook Page
http://www.facebook.com/PristineOnlineTrading
Trading Lesson of the Week - oCTOBER 11, 2012
A free Pristine service published every Thursday
Sponsored by http://www.Mastertrader.com
Trading Less and Achieving More
Many of you know that I have a back ground in Stock Car racing. The more I think about it, the more I see similarities that racing and trading the markets have in common. Particularly that they both require intense focus.
I was thinking back on my racing days and I remembered a statement that my crew chief made to me. That statement not only gave me the edge in racing but virtually in every other venture that I was a part of. Are you ready for that magic set of words? Well, I think it would be prudent for me to explain a few things first.
You see, in racing, you are rewarded for being fast, having cautious aggressiveness and being the most consistent; in addition, everything is measured in fractions of seconds.... In some cases the decisions you make, or don't make for that matter, could injure you or even worse, could be fatal. When you hear these words that I am going to share with you, it may not make sense at first but experienced individuals know how important this is. OKAY, are you ready?
My crew chief said to me, "Jeff, if you want to go fast you have to slow way down." Now you can just imagine the confusion on my face when I was told this. I think my exact response was, "Huh?" He went on to explain to me that to be fast, you need to slow down in the corners so that you can set up the car for the exit. Most people drive off in a corner and man handle the car and as a result, they have a poor exit. By simply rolling into the corner rather than driving 100% into the corner, you will have more momentum in the majority of the track, which is in the straight away. I finally began to understand this concept and since then, I have applied it to many things in my life.
So, here is the big question... How does this apply to trading the markets? Many people that are embarking on a new career want the experience of success," YESTERDAY"! They "rev up" their trading account and go full-speed into the corner not giving any consideration to consistency. They don't even know what their car has under the hood. They start buying and selling stocks as if they were selling tickets to a Broadway show. No strategy, no plan, just pure adrenalin and emotion.
Most new traders feel that if you are in the trading business, you should be trading; not sitting and waiting. Unfortunately, a very high percentage of new traders never make a proper exit off the corner. Man handling their trading eventually causes them to end up in the wall, and I don't mean Wall Street. If they would just learn how to roll into the corner (paper trade) and set their car up for the exit (proper education FIRST) they would learn how to pass the majority of people down the straight away.
I had a conversation once with racing legend Bill Elliot who has gone down in history as one of the most winning drivers on the NASCAR circuit. This is basically what he told me: "Jeff, if you were to paint a line around the track where your front tires are tracking, the goal would be to only focus on hitting your marks." He went on to say "Sloppiness or inconsistency of your line around the track is one of the most damaging things a racer can do."
That made so much sense to me the more I thought about it. So many people spend so much time looking for the better way around or a better system that they lose the peril and momentum of consistency. By the time they find their "line" (the Holy Grail that does not exist) they have already used up their equipment. You do not need to trade 20 or even 100 trades per day to be a trader. The professionals ARE NOT TRADING the majority of the time, they are just following their line (only taking their setups and not looking for the newest and "better way" to make a lot of money in the markets.)
The sooner you learn and understand that taking less trades with more consistent setups is really the only way to achieve financial rewards in day-trading, the sooner you will be on your way to consistent profits.
Traders' Tip:
The Pristine Method has been proven time and time again as a technical approach that has been developed and time-tested over the past 18 years by Pristine Capital Holdings, Inc. This dynamic trading methodology is now used by professional and semi-professional traders all over the world. Pristine education is the single most pro-active ingredient one could learn prior to risking capital in trading.
Make sure to register for any of our other FREE programs that interest you the most.
I would be happy to see you join us and to answer any questions you may have.
Jeff Yates
Contributing Editor
Interactive Trading Room Moderator
Gap, Intra-Day and Swing Trading Specialist
Instructor and Traders Coach
Pristine Capital Holdings, Inc.
1-800-340-6477
Counselor@Pristine.com
http://www.Pristine.com
![]()
If you have any questions on this Lesson of the Week (LOW) or any other past edition, please send to staff@pristine.com as we would be happy to hear from you.
Pristine ESP Stock Screener Trading Tips - October 10, 2012
A free Pristine service published every Wednesday
Sponsored by http://www.Mastertrader.com
New Feature - Linking Windows
Just a quick reminder: if you have not been receiving these "ESP Tip of the Week" newsletters you can view all of the back issues at the ESP resource page on our website.
This tip of the week shows a little known and recently added feature of Pristine ESP v4.0 - the ability to link any window that has the little 'link' button (shown below at the cursor) in the bottom tool bar.
Most ESP windows have this button which allows you to link. You can take any 'list' and link it to any display window such as a chart or a montage window. You can set up multiple linked families based on the colors available. Below you see a news window that was added to the purple family. Any chart that was also a member of the purple family would display any symbol you click on in the news window.
Many traders have found a very popular use for this. There are basic charts in ESP and I often wondered why anyone would use them. I found my answer at a weekly ESP training class (Wednesdays at 2.00). Many who scan after hours know that all big name platforms get slower later at night. These charts are fast, so many use a list of their universe and link it to a daily and weekly or hourly chart and go through a list of symbols at blazing speed.
You see above the daily scan results finding Pristine setups on daily charts, linked to a chart window for after hours scanning. Play with the various combinations of linking you can do.
Look for more exciting tips in next week's "Pristine ESP Stock Screener Trading Tips". Make sure to check out the other resources available to you when using pristine ESP on our website at www.pristine.com/esp/Stock-Screener-Resources.aspx. You can take a free trial of ESP by clicking on the link on the right side of this page.
Pristine Capital Holdings, Inc.
1-800-340-6477
Counselor@Pristine.com
http://www.Pristine.com
![]()
Pristine Facebook Group Post - October 9, 2012
http://www.facebook.com/groups/69054992817/
Sponsored by http://Mastertrader.com


For those that have taken our Advance Technical Strategies seminar (ATS), this setup is an excellent example of creating resistance in a void to provide a high odds short. The first pivot high gives the reference point to focus on for the next reversal to form an M-Top.
http://www.pristine.com/Online-Trading-Education/Trading-Courses/Advanced-Technical-Strategies-Stock-Trading-Seminar/310/1
Pristine Facebook Group
http://www.facebook.com/groups/69054992817/
Pristine Facebook Page
http://www.facebook.com/PristineOnlineTrading
The Eyes of a Pristine Trained Trader - October 8, 2012
A free Pristine service published every Monday
Sponsored by http://www.Mastertrader.com
Good Morning All:
Over the years, I have written many articles. Hundreds, maybe even thousands if you include partial repeats and every short lesson. Sometimes the lesson is a partial re-write, or a new take, or a new way to explain or organize the information.
While there are many summaries out there on various topics, and while the topics on this lesson may be found somewhere else, I began last week answering a very direct question. What causes failure in trading? This will be a no-nonsense, nuts and bolts look at the question, not a philosophical dissertation. I will discuss the top three over three letters. Last week I discussed 'discipline'. Today I will discuss the second of the three reasons for failure. To clarify again, most people actually fail because they do not get an education. However, that is decision people make. I want to discuss why the people who really try, can still fail.
What Causes Failure? Part Two of Three
Last week I opened here telling you of an inescapable truth I discovered long ago. Everyone who enters trading is exactly the same, and stay the same for a long time. Reason number two for failure continues that tradition. Reason number two, is the lack of, or the inability to, focus.
Yes, all of these topics are somewhat interrelated. Nevertheless, they each also have their own merit. Discipline and lack of focus are not the same thing. You may not have focus due to a lack of discipline, but you may not have focus by design.
Many traders come to the market with the view that they have to become the master of all around them. They feel they need to learn about economic data, currency rates, foreign politics, and the list goes on. When traders learn technical analysis, the feel the need to put everything to use. I have seen trading plans that have 14 strategies spelled out for a new trader. Yet, all of that information is not going to change what a stock does that gaps over a red bar and pulls back to minor support. It will not change what happens to a stock that is in a perfect 15-minute uptrend. Take Trading the Pristine Method (TPM), or if you have, take Advanced Technical Strategies (2). Learn what is out there. Find what you love, become an expert.
We often make trading way more 'complicated' than it has to be. Yes, there is a lot to learn. But learn everything, then focus on one thing to make money. Maybe two. Maybe three someday. Learn them all at once, become an expert one at a time. It is no different from going to school. You need to learn math, language, and all that is taught. It prepares your brain to continue learning, and much of that information is needed. However, to make better than average money in the workplace, you have to specialize in one thing. To make big money, you have be an expert at one thing.
Closing Comments:
Perhaps you have read the book "Market Wizards" by Jack Schwager. You should take note of the point of the book. In this book, the author sets out to interview 25 successful traders to determine what they have in common. He wants to find out what strategy it is that they all do, or how the strategies are similar. He finds two things that all traders have in common. One of them, the one we care about, was that no two did anything remotely similar in strategy, however, they all focused on one unique thing, waited for it to happened, and did only that. Focus.
I will be teaching 'Trading the Pristine Method' this upcoming weekend, October 13-14th.
Pristine Capital Holdings, Inc.
1-800-340-6477
Counselor@Pristine.com
http://www.Pristine.com
![]()
Chart of the Week - October 8, 2012
A free Pristine service published on select Mondays
Sponsored by http://www.Mastertrader.com
Is it Really Extended?
The chart and question shown was posted at the Pristine Facebook Group. Below is my posted answer.
The concept of being extended is difficult for most, if not everyone at some point for several reasons. I will discuss reasons generally and then in some detail. However, a complete understanding can only happen in class, but let's start here.
Extending means stretched out and suggests a return to a more "normal position." However, to most technical traders and investors, the word extended invokes the belief that the trend is close to over. Being extended has little to do with trends ending. Actually, extended initially suggests that the trend will continue.
The first step to clearing up the difficulty to understand extended is to realize that most taught methods of defining extended are based on completely subjective measurements. These have little to no consistency to define the end of a trend. Many times, they don't even result in a retracement to a believed normal position. This leads to confusion and of course a lack of confidence in the method. Exactly, what the question is communicating in the example using a moving average (MA) as a measure.
There are various technical tools to measure extended, but we'll discuss MAs now since that is what was used. As with all technical analysis tools there are choices to using them like the settings. Different settings will give different signals or measurements and then setup different beliefs based on them.
For example, if we use a simple 20-period moving average verses an exponential one we will see those MAs at different levels. Which one is the right one? Prices may appear to be extended from the simple type since it moves slower than the exponential.
What if we use a 10-period moving average instead of a 20-period? Prices may appear to be extended from the 20-period, but they are not from the 10-period. The 10-MA is averaging in the more recent prices were as the 20-MA is also averaging in the older prices as well and will be slower and further away.
Depending on what you have been taught or read, you will have a different set of beliefs about what is extended and possible. If you are convince to change the MA type or length, your beliefs change. Soon you'll be second guessing all of them. Been there?
Next, I am sure you have seen what is seemingly extended in one time frame that is not extended at all in another. For example, the 5-minute time frame may appear extended, but the 60-minute move has just started. In an example like that, traders focused on the 5-min. can be fearful of continuation patterns or breakouts and require a retracement. However, retracements often do not occur leaving those watching see the move become more extended. In fact, the chart and question is how to handle such situation. Without an understanding of how to interpret and combine multiple time frames anyone would be confused.
Lastly, and this comment is likely to raise a few eyebrows, but addresses a deeper understand of what the question relates to. The belief that prices are extended - even in a higher time frame - and that a trend is unlikely to continue is false. It will leave you scratching your head as you watch the extended prices become even more extended.
Here is the key and what I hope is a light bulb moment for you. Historically, prices will continue trended higher until the Pristine Price Void (PPV) is closed, Major Support (MS) is violated or resistance is created. In other words, there is no objective reason to think the trend will end, so don't. These concepts are covered in great detail in our Advanced Technical Strategies (ATS) class.
Pristine Trend Analysis is based on the concept that a trend will continue to a price reference point were traders will sell at. Without that reference point (a Void) to sell at, traders are just guessing at what is extended and where the trend may end. I wrote about this in a Chart of the Week (COTW) titled, "You Have Been Setup to Fail as a Trader." You read it at www.pristine.com. These COTW lessons are rotated and if it is not there by chance, e-mail counselor@pristine.com and request it. It will be sent.
The distance to a moving average alone is incomplete information and misleading. Adding additional indicators like oscillators will add to the confusion. There are hundreds of these indicators to choose from and when you add the choices of the settings possible, the combinations are endless. It's no wonder why there is mass confusion about technical analysis based trading.
Clearly, extended is a subjective idea if based on a single concept like the distance to a moving average. Students of the Pristine Method® learn to use Multiple Time Frames, Trend Quality, Relative Strength and Weakness, Support, Resistance and the lack thereof (Pristine Price Void), the influence of the Market or a Sector, Market Internals, Inter-Market Analysis and others. There is a lot to learn to become a professional in any field and technical trading/investing is no different.
If you are trading stocks, a futures contact like the S&P 500 e-mini, a commodity or a Forex currency pair based on generally accepted technical analysis tools. Odds are that you are thinking that there is no way you will ever understand price movement. You can and it does not have to be complicated. However, it does require the right education.
Pristine - A trading style often imitated, But Never Matched
All the best,
Pristine Capital Holdings, Inc.
1-800-340-6477
Counselor@Pristine.com
http://www.pristine.com
![]()
Trading Lesson of the Week - October 4, 2012
A free Pristine service published every Thursday
Sponsored by http://www.Mastertrader.com
Dynamic vs. Static Risk Management for Swing Trading
Are you one of the many swing traders that takes the same level of risk notwithstanding the market conditions? Do you always trade "a thousand" shares just because that's an easy number to remember? I will discuss some finer points that might help you to become better at managing risk.
First and foremost, the Pristine Trained Trader (PTT) should have a Trading Plan outlining his money management rules. Here you should establish parameters such as a "maximum loss per week-month". When establishing a maximum loss per trade (because no one can know which trade is going to work out), the PTT has to decide whether he wants to follow a more "static" approach where all his potential losses will be similar, or whether to adopt a more "dynamic" set of guidelines created with the purpose of governing when to be more aggressive, less aggressive, or not active at all.
First and foremost, you have to understand the fact that not all market conditions present the same odds for a particular trade. Let's say for example that market "x" is in an up-trend, and has pulled back to support for several days. Today we get a reversal bar, and tomorrow the reversal is complete. Thus, the swing trader will likely find several high odds entries both today and tomorrow (depending on the tactics used, many of which are taught in our Trading The Pristine Method seminars. Then the third day comes along, the market continues to climb, and some more entries might be executed. As the market continues to rally, the odds of every new entry will diminish, as the probability of a reversal to the downside in market "x" is greater.
Based on this scenario, a swing trader might enter into larger positions on days one and two, and might reduce his share lots as the market continues to climb. There will be a time when the market has climbed for 5 or 6 days in a row, and so the Pristine Swing Trader will devote more and more of his time to manage already open positions, by selling partial lots and raising his stops, instead of being too active in entering new swing positions. (He might be more active in micro trading activities though)
Using some modified version of this basic concept, the Pristine Swing Trader can implement an intelligent way to participate in the markets, while reducing the risks of getting caught with big positions on a reversal contrary to his positions.
Come join us in a FREE online workshop. http://www.pristine.com/FreeEducation/FreeWebinars.aspx
Trade Well!
Kurt Capra
Contributing Editor
Instructor and Traders Coach
http://www.Pristine.com
![]()
Pristine ESP Stock Screener Trading Tips - October 3, 2012
A free Pristine service published every Wednesday
Sponsored by Mastertrader.com
Finding Great Plays 5
Just a quick reminder: if you have not been receiving these "ESP Tip of the Week" newsletters you can view all of the back issues at the ESP resource page on our website.
This tip is an example of another way to use Pristine ESP v4.0. One of the most basic ways is finding the patented Pristine proprietary setups using the Opportunity scanner shown below. On this day, McDonalds (MCD) showed up as a bearish play at 10.00. You can see it highlighted below.
ESP will find whatever you want it to. You then check to see if the potential play meets the requirements of your trading plan. Shown below are the hourly chart and the 5 minute chart of MCD.
Pristine trained traders can see several attributes of this find. The daily (not shown) had a bearish gap down a couple days prior. The hourly chart had a sell setup then developed a PBD (Pristine Break Down). Looking further, inside of that set up, the 5 minute chart began a LOD (Low of the Day) consolidation with huge RW (Relative Weakness). You will note at the top of the chart that this play was posted into the Pristine Method Trading Room by Jeff Yates at 10:22.
MCD eventually dropped below 90.80 by the end of the play for a huge gain.
Look for more exciting tips in next week's "Pristine ESP Stock Screener Trading Tips". Make sure to check out the other resources available to you when using pristine ESP on our website. Click here for other resources. http://www.pristine.com/esp/Stock-Screener-Resources.aspx
You can take a free trial of ESP by clicking here. http://www.pristine.com/Trading-Tools-Services/Stock-Screening-Software-ESP.aspx
Pristine Capital Holdings, Inc.
1-800-340-6477
Counselor@Pristine.com
Http://Pristine.com
![]()
Pristine Facebook Post - October 2, 2012
Sponsored by http://Mastertrader.com
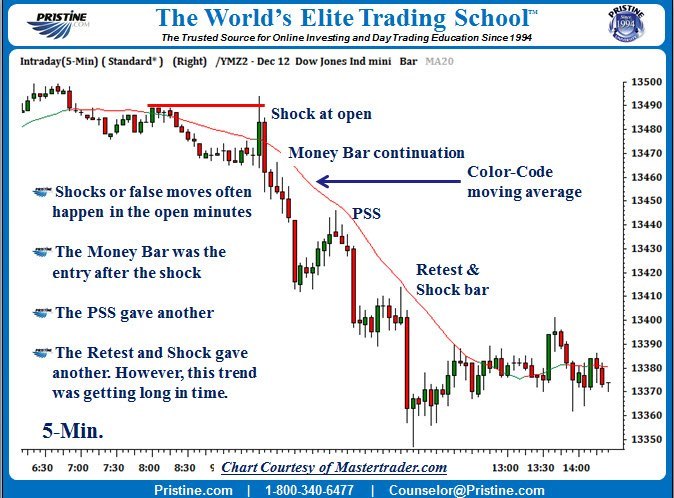
The markets this morning trended into the mid-day lunch period EST. Unfortunately, it doesn't happen as often as it used to. The opening fake out and shock was classic e-mini action to get as many as possible on the wrong side and caught. That being said, it can be hard to jump on board if you’re not familiar with this setup and it does happen fast.
Today, there were additional entries that I have marked on the chart. The Money Bar (MB) continuation setup came a few bars later. One of the key elements of the MB is that it forms near the beginning off the move. We cover this and many other concepts during seminars and follow up coaching sessions.
The next entry was a classic Pristine Sell Setup (PSS). The textbook PSS does not have a shock element to it, but it can form with one at times. When they do, it’s like shooting fish in a barrel. Either way, take the PSS when you see one in a downtrend like this. This PSS was the first retracement after the drop.
The last entry was the Retest and Shock. After a drop like what was seen, a retest of a pivot high creates new resistance and catches traders trying longs entries against the trend; not smart. This move was going on for about 2-hours and that is pretty long for an intra-day trend. For that reason, the odds weren’t high that this was going to move as far. It was also close to lunchtime.
If you use the NYSE TICK - and you should, you’ll notice that the TICK moved to an negative extreme on that last drop. A TICK extreme after a 2-hour downtrend typically signals that the move is close to over. A TICK extreme at the start of a move signals continuation. Common sense, if you know.
If you’re interested in learning more about Pristine and how we can help you learn trading strategies like this join us in a Free Webinar. You can sign up at www.pristine.com. Hope this short lesson helps. BTW, what I have shown you here applies to all tradable instruments. Stocks, Futures and Forex.
All the best,
Pristine Capital Holdings, Inc.
1-800-340-6477
Counselor@Pristine.com
![]()
Pristine Facebook Group
http://www.facebook.com/groups/69054992817/
Pristine Facebook Page
http://www.facebook.com/PristineOnlineTrading
The Eyes of a Pristine Trained Trader - October 1, 2012
A free Pristine service published every Monday
Sponsored by Mastertrader.com
Good Morning All:
Over the years, I have written many articles. Hundreds, maybe even thousands if you include partial repeats and every short lesson. Sometimes the lesson is a partial re-write, or a new take, or a new way to explain or organize the information.
So, while there are many summaries out there on various topics, and while the topics on this lesson may be found somewhere else, I thought I would take today to start answering a very direct question. What causes failure in trading? This will be a no-nonsense, nuts and bolts look at the question, not a philosophical dissertation. I will discuss the top three over three letters.
What Causes Failure? Part One of Three
After many years of seeing many issues in trading through the eyes of many traders, I have come to one inescapable conclusion. Something I now consider a fact. Everyone who enters trading is exactly the same, and stay the same for a long time. It is not until later in development, that some break out into 'unique' ground. So relax, everyone has gone through what you are, or have gone through.
You may not like the answers. However, you need to hear them. While education in technical analysis is absolutely needed, most who really try, receive that education. In addition, they receive enough to make them potentially successful. For those who do not get an education, it may be the biggest cause of failure. However, anyone can understand the education material once presented, and many who receive the education still fail, so lack of education, while critically important, is NOT making my top three list.
Number one quite simply is the ability to do what need to be done, and do it now. The word for that is 'discipline'. This is the number one reason for failure amongst traders. Initially it may be the lack of discipline to take a stop. Later it may be the lack of discipline to reach a target. Note that the trader knows what the stop is, and what the target is. This is why the 'education' doesn't make the list. The problem is, even those that know what to do and when to do it, do NOT do it. Lack of discipline.
It shows up in many other places. The lack of discipline to review material learned. The lack of discipline to review trades and make changes. The lack of discipline to create and use a trading plan. The lack of discipline to honestly analyze your trades and determine you need an education. All of the key things in trading are easily learned by someone who wants to learn them. However, they are not easily done. Lack of discipline is a number one reason traders fail. Do you suffer from a lack of discipline in your trading? Is it holding you back from your goals?
Closing Comments:
This is the first of three things we will look at. After seeing them all, you may disagree about the order. Do not. They will not be in any particular order. They are all important and it is like the 'chicken and the egg' argument. All three of them are critical, and the lack of any of them will cause failure, just like removing one leg of a three-legged stool.
October 13th and 14th I will be teaching our flagship course, Trading the Pristine Method. Feel free to email if you have any questions about what this course could do for you.
Pristine Capital Holdings, Inc.
1-800-340-6477
Counselor@Pristine.com
![]()
Chart of the Week - October 1, 2012
A free Pristine service published on select Mondays
Sponsored by http://Mastertrader.com
Bringing Common Sense to Trading
In this week's Chart of the Week, I'm going to share with you one of the concepts taught in Pristine seminars. After reading this I believe that you will have what is referred to as a Ha-Ha or Light- Bulb moment. The basis of this concept isn't a new revolutionary type of technical analysis, but it is a powerful common sense approach to understand the interaction between buyers and sellers. Find someone else teaching the same - and you'll have found a formal Pristine student.
Frankly, there isn't anything new or revolutionary when it comes to technical analysis. However, there are different ways of interpreting the same raw data that we all use. Most do this with a hodge-podge of indicators. Some even make a business out of selling you their proprietary indicators or indicator based system that will tell you what to do and when to do it.
Knowing what to do and when to do it sounds great and why so many buy into these marketing indicator schemes. Maybe you remember or bought the once popular red light - green light trading system that many paid thousands for in the mid-2000 period. If you're interesting in a long-term approach to technical investing or trading, the history of the red light - green light indicator approach (gone) and others like it isn't it.
The use of indicators or indicator systems attracts virtually everyone that becomes interested in trading the markets. I was no different when I started and tried many indicators and wrote a few of my own. The idea of removing the guess work and the uncertainty is attractive. It is also a powerful way of motivating those interested to buy into their marketing. Been there?
Here's the concept I want to share with you....... There are buyers at prior price support (a demand area) and sellers at prior price resistance (a supply area). If you're thinking; I knew that already, that's it? You don't realize what a power concept this is.
Let me explain.
Virtually all price indicators/oscillators (there are hundreds) attempt to define when prices have moved too far and will reverse, right? Sure, but it doesn't work except in hindsight.
These indicators have absolutely nothing to do with prices reversing. If you doubt it, think about why does what becomes overbought or oversold either stays that way or becomes more so without returning to the other extreme so often? It's not that you're using the wrong indicator or settings either. That's thing will keep you in search of the Holy Grail and the next indicator.
Next there are technical tools like Fibonacci Retracements, Gann Lines, Moving Averages, Elliot Waves, Andrews Pitchforks, Bollinger Bands, Regression lines, Median Lines, Trendlines and they go on and on. All of them are supposed to locate the area where prices will find support or resistance.
All of this hocus-pocus analysis is insane! So, what's the answer?
An in-depth understanding of price support and resistance pivot points or consolidations as reference points are where you need to focus. This is where buyers and sellers interacted in the past and will likely do so again. Once you have a reference point, wait for a price pattern signaling slowing momentum and reversal.
At Pristine, we define a Support Pivot as a bar or candle having at least two higher low bars to its right and left. A Resistance Pivot is a bar or candle having at least two lower high bars to its right and left; simple.
The trend of prices, the arrangement of the candles, changing ranges and volume are some of the other concepts to consider that increase the odds of follow through, but that's for another lesson. As far as where prices are likely to stall, it's the basics you need to follow. There are buyers at prior price support (demand) and sellers at prior price resistance (supply).
Let's look at a couple of chart examples.
As Google (GOOG) moved lower on the left side of the chart, it formed a Resistance Pivot. As you can see, sellers came in at the same location. You didn't need an indicator to guide you where sellers would be, did you? You only needed to look at the chart for a pivot high. Once the trend was violated, look for buyers (demand) to overcome sellers (supply) at a Support Pivot.
As prices move higher in an uptrend, the concept of what was resistance becomes support applies. However, in the strongest trends prices will not pull back to what was resistance. I'm sure you've seen that in the past. At these times, don't chase. Wait for a Support Pivot to form. Once it does, you have a new or created reference point of support where buyers will step in again. Reversal candles are you confirmation at those points.
In the chart of Facebook (FB), prices moved up from a low pivot point and there was no clear resistance area to the left. However, once a Resistance pivot formed there was a clear point where sellers (supply) overcame buyers (demand) and that would likely happen again. Once FB broke lower many will look for a retracement to sell, which is fine. However, when supply is overwhelming demand - prices cannot retrace that much. Don't chase out of fear of missing the move, even though that may happen. Wait for a Resistance Pivot to form. Once it does, use that reference point and your Candle Analysis to tell when to act.
In the chart of the New Zealand Dollar versus the U.S. Dollar (NZD/USD.FXB) a climactic move lower occurred. This created a Pristine Price Void above and once a pivot low formed we had a reference point where buyers (demand) would show up again. However, we cannot know for sure if that low will hold, and we don't want buy in such a strong downtrend without confirmation. Rather, we want to wait to see if a reversal will form in the same area. If it does, we have that confirmation on the retest and a strong buy signal.
It doesn't matter if you trade stocks, currencies, commodities or equity e-minis. Everything we have covered here and all Pristine trading concepts taught are universal to all tradable instruments.
I hope this Chart of the Week has provided you with the Light bulb moment I promised. If you're interested to learn more, I'll be doing a Free Webinar this Thursday after the market close. Please sign up for all our webinars to learn more about a Pristine education. You can also e-mail counselor@pristine.com.
All the best,
Pristine Capital Holdings, Inc.
1-800-340-6477
Counselor@Pristine.com
![]()
Pristine Daily Watch List - September 28,2012
http://www.facebook.com/groups/69054992817/
Sponsored by http://Mastertrader.com
Bullish: grpn, fb, xl, whx, vrlt, vclk, trmb, swn, srpt, pxd, pbr, pbi, ori, orex, knl, cpl, bpop.
Bearish: swy, sun, stwd, sre, snss, reg, pxp, pgh, petm, isis, hnt, fnfg, dtv, cva, chk, cbl, avg, arna.
Misc.: tsla, snx, payx, omn, omex, nsc, jbl, iqnt, hts, gtat, gevo, fwrd, deck, cvg, cmo, chk, bth, big.
Climactic: none.
Sami Abusaad
Pristine Capital Holdings, Inc.
1-800-340-6477
Counselor@Pristine.com
![]()
Pristine Facebook Group
http://www.facebook.com/groups/69054992817/
Pristine Facebook Page
http://www.facebook.com/PristineOnlineTrading
Pristine Facebook Group Post - September 27, 2012
http://www.facebook.com/groups/69054992817/
Sponsored by http://Mastertrader.com
Yesterday I posted the daily chart of AAPL and why it should turn in the coming days at the Pristine Group https://www.facebook.com/groups/69054992817/. The chart shown here displays the daily and 5-min time frames. It doesn't get easier than this. If you understand how to put it all together. It's not hard and doesn't take a lot of trading, you just have to know what to look for and then wait for it to setup.

All the best,
Pristine Capital Holdings, Inc.
1-800-340-6477
Counselor@Pristine.com
![]()
Pristine Facebook Group
http://www.facebook.com/groups/69054992817/
Pristine Facebook Page
http://www.facebook.com/PristineOnlineTrading
Online Stock Day Trading Profit $650 - 5 Min Pristine Breakdown Play Strategy

Trading Lesson of the Week - September 27, 2012
A free Pristine service published every Thursday
Sponsored by Mastertrader.com
A Positive Mental Attitude and the Right Mental Approach Leads to Mastery
Based on my own experience as well as working with hundreds of traders over the years, I have come to the conclusion that there are three major components to winning in the stock market. An excellent Method, a customized Plan that fits YOU, and the right Mental Approach. While mastery of each of them is paramount, building the right Mental Approach seems to be the most challenging to master for the majority of traders.
Without a winning attitude and the proper mindset, even the soundest of all methods will lead to lost money. In fact, a winner is more defined by mental make-up than by method. This is why the trader with a winning attitude and a faulty approach can still produce positive results, while the trader with a loser's mentality will stumble and fall, despite an excellent approach. Don't think so? What do you actually think causes one trader to play six winners in a row, and another to experience six consecutive losses? How can one trader use a daily newsletter and win, while another uses it and loses? What do you think differentiates the person who buys XYZ and wins, from the person who buys the same XYZ and loses? The difference lies in the Mind, plain and simple.
One of the most revolutionary axioms I have ever come across is this: "As a man thinks in his heart, so is he," and this universal truth is just as applicable to traders as it is to anyone else. Monitor the attitude of a winner and you will find a level of confidence and certainty that is almost beyond belief. And while most people will make the mistake of assuming that winners are confident and certain because they win; the truth is that winners consistently win because they are confident and certain. No method, however sound, will work for the trader who mentally pictures himself losing before each trade is placed. And no amount of Money, however large, will save the individual who secretly harbors the belief that, "Whatever I touch, turns to mush." As choice-making individuals, we must choose a winner's mindset. You can never fail, or even feel like a failure, if you recognize the simple fact that you are not your results. You create them, which means that you posses the power to alter them if you happen not to care for them. There is room at the top for all dedicated traders, but the first step is to actually believe that. The second is to start acting like it. Think the part, then act the part and the rest mysteriously takes care of itself. But don't take my word for it. Just try it.
Kurt Capra
Contributing Editor
Instructor and Traders Coach
Pristine Capital Holdings, Inc.
1-800-340-6477
Counselor@Pristine.com
![]()
Pristine Facebook Group Post - September 27, 2012
http://www.facebook.com/groups/69054992817/
Sponsored by http://Mastertrader.com
Daily watchlist for Thursday 9/27
Bullish: cpl, knl, velt, vclk, trmb, swn, rosg, pbi, orex, mdvn, fb/grpn, cy, deck.
Bearish: snss, petm, pep, mnst, hk, hnt, fran, fnfg, dps, chk, aro, arna, aap, vrng.
Misc.: tsla, qcor, payx, keg, iqnt, fwrd, big, bbby, nsc. Climactic: swi, px, pru, msm, jbl, ntap
Sami Abusaad
Pristine Coach & Moderator
Pristine Capital Holdings, Inc.
1-800-340-6477
Counselor@Pristine.com
![]()
Pristine Facebook Group
http://www.facebook.com/groups/69054992817/
Pristine Facebook Page
http://www.facebook.com/PristineOnlineTrading
Pristine Facebook Group Post - September 26, 2012
http://www.facebook.com/groups/69054992817/
Sponsored by http://Mastertrader.com
Daily Watchlist for Wed 9/26
Bullish: swn, orex, sync. Bearish: kbh, wmc, cde, wern, svnt, navb, hsy, hk, aro, arna.
Climactic: whx, wcc, open, knl, ipi, dlr, cy, cree, cqp, coh.
Misc.: xpo, unp, qcor, iqnt, bbby, amtg.
All the Best,
Sami Abusaad
Pristine Coach & Room Moderator
Pristine Capital Holdings, Inc.
1-800-340-6477
Counselor@Pristine.com
Pristine Facebook Group
http://www.facebook.com/groups/69054992817/
Pristine Facebook Page
http://www.facebook.com/PristineOnlineTrading
Pristine Facebook Group Post - September 25, 2012
http://www.facebook.com/groups/69054992817/
Sponsored by Mastertrader
Daily Watchlist for Tuesday 9/25
Bullish: sgen, pbi, mdvn, mdrx, hum, grpn, fst, fnfg, dre, auxl.
Bearish: stld, wern, vtr, tti, tkr, omx, nflx, navb, mitk, lrcx, dy, bby, aro, amat, adtn. Climactic: sph, svnt. Misc.: trgt, iqnt, hni, gcom, bbby.
All the Best,
Sami Abusaad
Pristine Coach & Room Moderator
Pristine Capital Holdings, Inc.
1-800-340-6477
Counselor@Pristine.com
![]()
Pristine Facebook Group
http://www.facebook.com/groups/69054992817/
Pristine Facebook Page
http://www.facebook.com/PristineOnlineTrading
Pristine Facebook Group Post - September 24, 2012
http://www.facebook.com/groups/69054992817/
Sponsored by http://Mastertrader.com
Daily Watchlist for Mon 9/24
Bullish: znga, wlp, sppi, sm, sgen, pbi, nfx, lscc, hpp, fst, hot, fnp, atrs, arna, wlt/aci/anr. Bearish: xel, wern, vtr, thld, rhi, regn, pay, nke, nflx, navb, mxim, mitk, hk, fmer, gntx, bby, adtn. Misc.: wms, wm, trgt, mlhr, jcp, hni, gcom, clc, cag, apog, amd, air.
Climactic: bpi, bre, sand, kbh, pphm, cytx, hts, mhk, sph.
All the best,
Sami Abusaad
Pristine Instructor & Coach
Pristine Capital Holdings, Inc.
1-800-340-6477
Counselor@Pristine.com
Http://Pristine.com
![]()
Pristine Facebook Group
http://www.facebook.com/groups/69054992817/
Pristine Facebook Page
http://www.facebook.com/PristineOnlineTrading
The Eyes of a Pristine Trained Trader - September 24, 2012
A free Pristine service published every Monday
Sponsored by Mastertrader.com
Good Morning All:
The Pristine Method is an incredible way to trade. It is the only way to trade as far as I am concerned. It is what I learned years ago. It was the first and only method I learned. I looked at others, and have studied others since, but nothing comes close. In a sense, you can argue that most of the components individually are not unique. With all the authors on technical analysis, it is hard to find something that has not been discussed. However, between our unique look at many old concepts, and the way the Pristine Method puts it all together, it becomes a method for true professionals, as long as you truly learn the method. In this, and following articles, I am going to look at a few of the common problems that traders have by not fully learning or understanding the method. By understanding these issues, it will help you to better use the Pristine Method. If you have not taken any of our courses, you will still find these concepts useful.
The Pristine Method Part 3 of 3 - Making it 'your own'...
Here at Pristine we teach a very specific method. It is a method however, and not a system. There is a difference. A 'system' is something that can be totally objective. It is always 'simple' in that it can be reproduced over and over by anyone. Even though the system may get to be long and involved, it is always simple and can be done by anyone. It can also be back tested. An example of a simple system would be to buy the first bar on a chart that trades above the average of the last 10 bars, and put a stop under the lowest of those 10 bars, and go for a target twice the size of the stop.
Systems are objective and simple and can be reproduced by anyone. So why not use them? Because they do not work. Not over time, not without adjusting them. And once you have to 'adjust' the system, it is no longer objective, you are sticking your fingers in the mix. The market is a zero sum game. We all cannot win. The winners feed off the losers. A system that works perfectly would work perfectly for all, and eventually not work for anyone. It is like me inviting you all to my house for a poker game because I have great new game; at the end of the game we all walk away winners. It cannot happen.
Now, a method means that there is a framework in place and an understanding of the process at hand. It becomes partly subjective, and individuals are called upon to make individual decisions inside of the framework. This is what makes a market. It is not back testable, because the variables by definition, at some level, are subjective and spontaneous based on an almost infinite series of events that happen (the real market).
Herein lays the problem for all new traders. The simplicity and objectivity of a system draws the attention for new traders. It is easy, it is lazy, it is simple. It also does not work. If there was a system that worked, couldn't you go Google it right now and use it? Couldn't we all? These are the back testers, and 'green light-red light' vendors of the world. They win the hearts of most traders. Most traders also fail.
Closing Comments:
The Pristine Method requires you to learn your trade and be involved in the decision making process. Any professional goes through this same process. Doctors and lawyers do not learn a 'system', they learn a method. Doctors have to make the final diagnosis based on their observations. Lawyers have to make an argument based on their facts. Traders have to make buy and sell decisions based on the chart they see. At Pristine we teach you how to read charts like a professional.
The next Trading the Pristine Method Seminar is October 13 and 14th and I will have the honor of teaching the course this time. Feel free to email me if you have any questions.
All the best,
Pristine Capital Holdings, Inc.
1-800-340-6477
Counselor@Pristine.com
Http://Pristine.com
![]()
Chart of the Week - September 24, 2012
A free Pristine service published on select Mondays
Sponsored by Mastertrader.com
Bringing Common Sense to Trading Part II
In last week's Chart of the Week (COTW), I explained why there would not be a severe market correction any time soon. However, I did tell you short term the odds are that a minor correction is not that far off as we are coming into what is historically the most bearish time of the year. That being said, we need a common sense way of measuring the likelihood of a historical cycle repeating, rather than blinding following history. Let's look.
For a short-term correction to occur there has to be a reason for that to happen, other than just the time of year. Many seasonal periods have failed to produce the expected based on the past. Here is what else has to be in alignment with this time of year.
First, in an uptrend, the Void of price resistance has to be closed. Without an area of price supply to the left, prices aren't likely to pullback much. Second, the majorities have to be willing to take on a historical high level of risk with bets that the trend will continue after having doubting it. This is seen through an acceleration of prices moving higher and an increase in speculative leveraged bets. In other words, the trend is now obvious to the latecomers and they are entering close to the worst possible time. This started happening last week.
In the chart above, prices of the S&P 500 measure by the ETF symbol SPY began accelerating higher the week before last and are nearing resistance. This resistance is also the all-time highs from 2007, so this area will be an obvious point that all will focus on. So why are so many increasing their buying into an area where selling will show up? It always happens that way and I believe that it's just human nature to ignore the obvious risk when greed kicks in. There is also the fear on the part of money managers that they have missed the move and are jumping in.
The second component needed is speculative leveraged betting and there is no place better to measure that than with the activity of options traders. The chart above displays the number of put options traded verses call options in equities on each day and a 5-day moving average of those daily closes. The 5-day moving average and the daily close have reached a historical level where short-term corrections are not far off. Combined with the upward momentum into prices resistance it tells us that the odds of a short-term correction are high during this bearish yearly time.
Historical cycles in the market can be a good guide to timing change, but alone they are not enough. It's the combination of technical concepts and market internals with historical cycles that make them valuable information.
All the best,
Pristine Capital Holdings, Inc.
1-800-340-6477
Counselor@Pristine.com
Http://Pristine.com
![]()
Pristine Facebook Group Post - September 21, 2012
http://www.facebook.com/groups/69054992817/
Sponsored by http://Mastertrader.com
Daily Watchlist for Fri 9/21
Bullish: znga, sgen, pbi, hsh, fst, fdo. Bearish: vt, mrvl, mitk, hk, dfs, adtn. Misc.: wms, stld, xel, hni, gcom, amd, agnc, lrcx, trgt, idix. Climactic: nus, dlr, cstr, bpi, amtd, acc, nktr, aray.
All the best,
Sami Abusaad
Instructor and Traders Coach
Pristine Capital Holdings, Inc.
1-800-340-6477
Counselor@Pristine.com
Http://Pristine.com
![]()

Pristine Facebook Group
http://www.facebook.com/groups/69054992817/
Pristine Facebook Page
http://www.facebook.com/PristineOnlineTrading
Watch today's Trade of the Day video --- read "Trading Lesson of the Week" --- Plus! Don't miss the FREE trading webinar, "Professional Traders Wealth producing Strategies Learn how professionals gain the EDGE in today's markets!" at 4:15pm ET
http://www.pristine.com/emails/weekly/thursday/20120920_web.html
Pristine Capital Holdings, Inc.
1-800-340-6477
Counselor@Pristine.com
Http://Pristine.com
![]()
Pristine Stocktwits Post - September 20, 2012
Http://stocktwits.com/Pristine
Sponsored by Mastertrader.com
Bullish: $DNR $CAG $SPRT
Bearish: $NSC $BBBY $CSX $RIO $SPG $HZNP $TCRD
JOIN US ON STOCKTWITS!

Http://stocktwits.com/Pristine
Pristine Capital Holdings, Inc.
1-800-340-6477
Counselor@Pristine.com
Http://Pristine.com
![]()
|
Followers
|
3
|
Posters
|
|
|
Posts (Today)
|
0
|
Posts (Total)
|
125
|
|
Created
|
03/22/11
|
Type
|
Premium
|
| Moderator Pristine Trading | |||
| Assistants | |||
| Volume | |
| Day Range: | |
| Bid Price | |
| Ask Price | |
| Last Trade Time: |


