 News
News  Market Data
  Discover
Support: 888-992-3836
Copyright © 2023 InvestorsHub Inc.


Register for free to join our community of investors and share your ideas. You will also get access to streaming quotes, interactive charts, trades, portfolio, live options flow and more tools.
I picked up another block this AM.
Oil rocks
- Oil prices sank below $61 per barrel Wednesday as the government reported unused gasoline held in storage surged yet again. Retail gas prices have fallen every day for more than two weeks. In just over one week, oil prices have fallen more than 17 percent. International Monetary Fund on Wednesday lowered its global economic forecast, the latest that would not support high energy prices. The Organization of Petroleum Exporting Countries predicted Wednesday that demand for crude has fallen so sharply, it will take another four years to recover to 2008 levels. Americans are driving billions fewer miles than they had in recent years with millions losing their jobs. Even though refiners have been slashing production, gasoline continues to pile up. The Department of Energy reported Wednesday that gasoline supplies grew by another 1.9 million barrels last week, the fifth straight week that storage levels have grown. Retail gasoline prices dropped again overnight, the 16th straight day, to a new national average of $2.593 per gallon.
http://www.google.com/hostednews/ap/article/ALeqM5i4_q7DtiEHvUTVNlJoaJ9ufkd1kgD99ACA601
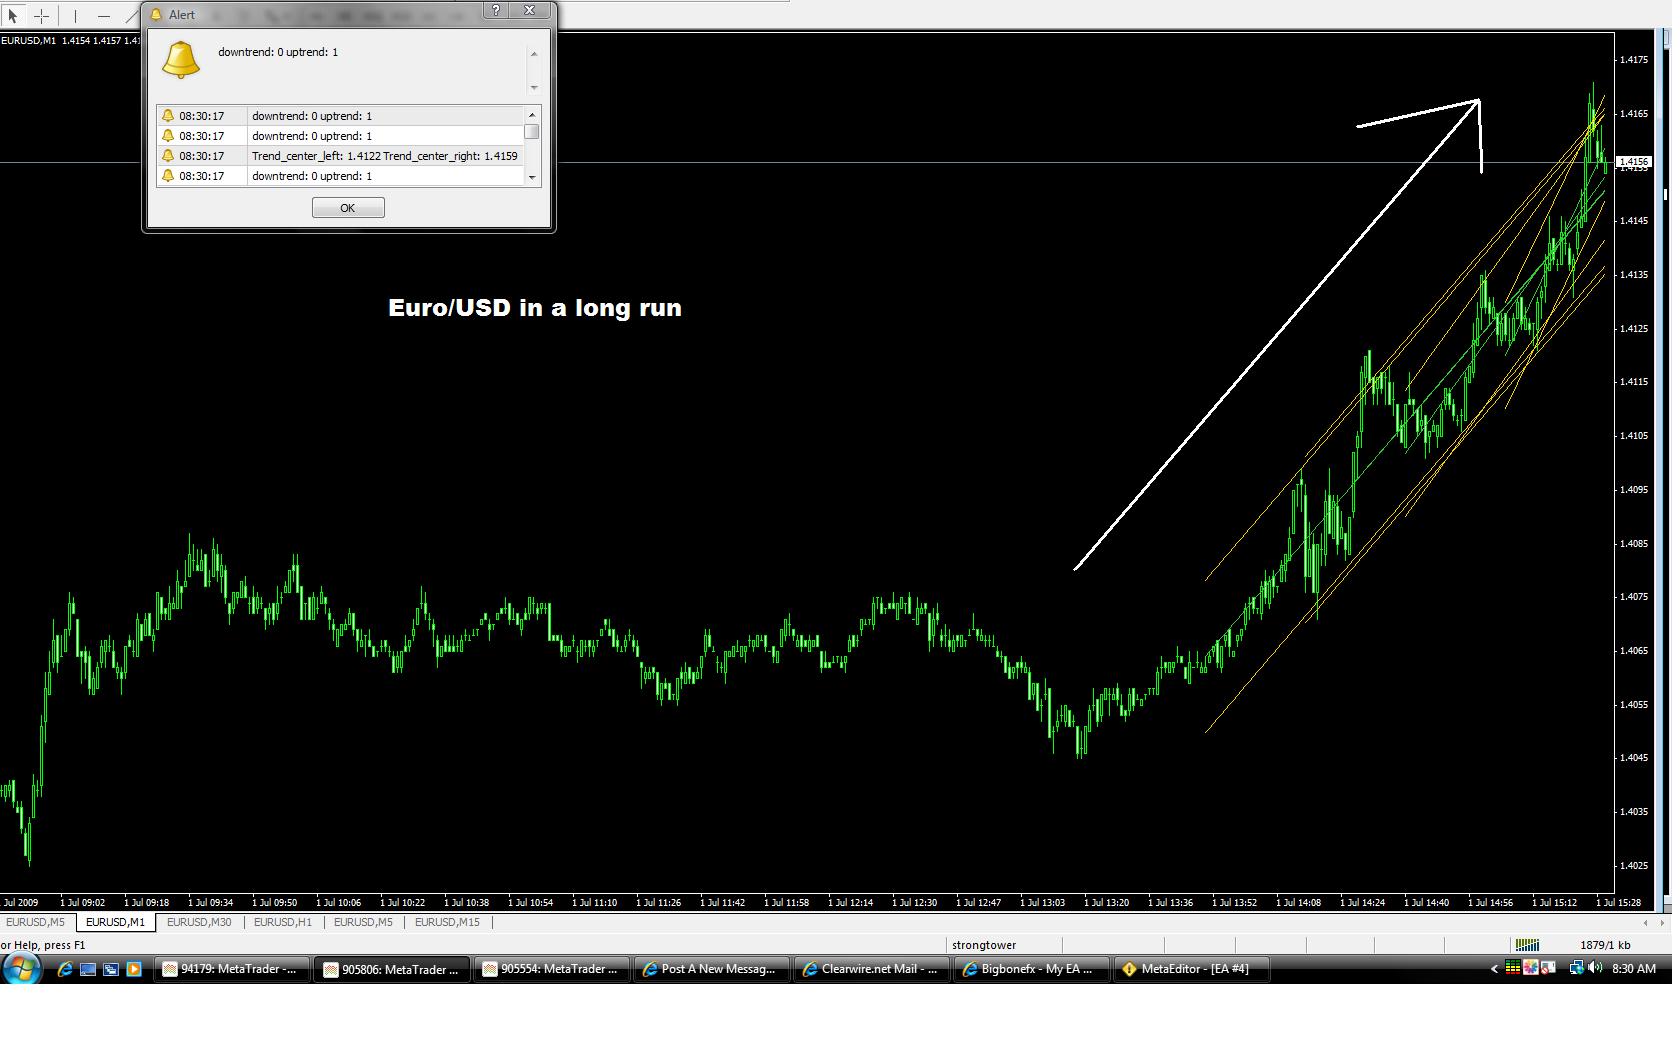
Oil downtrend is contributed to the dollar strength. It has gained .03 in the past 8 days. We don't know where bottom is right now. Techs say time for reversal which would push oil back up but the market says keep shorting

Oil in Downtrend, May Fall to $50: Technical Analysis
July 8 (Bloomberg) -- Crude oil is in a downtrend that may lead to prices falling as low as $50 a barrel, according to Schork Group Inc.
“Oil has indeed entered a bear channel,” said Stephen Schork, president of the Villanova, Pennsylvania-based consultant. “The market gapped lower, therefore that gap - in between $66.26 and $65.65 - is now the top of resistance.”
A decline of 12 percent since the start of last week has pushed prices into a descending channel on the daily continuation chart. It has also left a price gap between the low of July 2 and the high of July 6 that will present a hurdle to rising prices in the coming week, Schork said.
Oil reached an eight-month high of $73.38 a barrel on June 30 on speculation a recovery from the global recession will spur demand for fuels, and following a surge in Brent on London’s ICE Futures Europe exchange. Unauthorized trades at PVM Oil Futures Ltd., a unit of the world’s largest broker of over-the-counter oil derivatives, may have caused London oil prices to jump in the early hours of June 30, according to exchange data.
New York oil futures have since fallen, into a sustained descending channel. Prices are headed for a sixth day of decline after closing yesterday below the 50-day moving average for the first time in four months.
Crude oil on the New York Mercantile Exchange is in its longest losing streak since December. Oil for August delivery declined 74 cents to $62.19 a barrel at 1:14 p.m. Singapore time. Prices rose 41 percent in the three months to June, the biggest quarterly gain since 1990, and increased 39 percent so far this year.
Oil may fall to $50 a barrel only after breaking support levels near $60, according to Schork.
“The market is clearly trending lower,” he said. The support is in between the 50 percent and 62 percent retracements ratio scale, from $61.25 to $58.59, he said.
maybe 3.50 or so. It has had such a huge run it's in a big consolidation stage right now.
WHERE is the bottom ? 
DXO should have a nice pop this morning because the dollar is getting pounded right now.
Oil Above $71 On Inventory Drop, Nigeria
Oil rose above $71 a barrel on Wednesday following a large drop in crude inventories in the United States, the world's top energy consumer, and output disruptions from militant attacks in Nigeria.
U.S. crude futures were trading up $1.25 to $71.14 a barrel by 1008 GMT, having risen to as high as $71.28. London Brent crude rose $1.28 to $70.58.
Weekly oil data from a U.S. industry group released late on Tuesday helped oil prices to reverse the day's loss, which had been fuelled by weak U.S. consumer confidence.
Data from the American Petroleum Institute showed on Tuesday a 6.8 million barrel decline in U.S. crude inventories, larger than analysts' forecast for a drawdown of 2 million barrels.
"Maybe we have already seen the peaks in the stock levels and we could start entering a phase where we see a slow reduction (in stock levels)," Olivier Jakob with Petromatrix said.
Market focus has now shifted to a separate set of data from the U.S. government, which is seen as more reliable by investors, due out later on Wednesday.
The U.S. Energy Information Administration (EIA) is also expected to show a fall in crude inventories due to higher refinery runs ahead of the Independence Day weekend.
OPEC's policy to keep output cuts intact since last year has started to be reflected into some statistics and traders would be watching U.S. crude import volumes in the EIA statistics, Jakob said.
Export disruptions from Nigeria, an OPEC member and Africa's top oil producer, have also provided support to oil prices.
The recent escalation of civil unrest in Nigeria's oil rich Delta region has hobbled its output.
On Tuesday, oil major Royal Dutch Shell said attacks by Nigerian militants have cut its output to around half of what it was producing earlier this year.
Oil prices, which have tumbled from a record high of over $147 struck in July last year to the low $30s a barrel at the turn of the year, have rallied in recent months due mainly to hopes for economic recovery.
They marked a 42 percent gain in the second quarter -- the highest quarterly gain since 1990.
c c
Could be a head&shoulder formation on the 60 min., the implied target would be 3.60ish?
well consolidation was expected sooner or later so hope it's over.
Will The Price Of Oil Kill The Recovery?
Oil is the one commodity whose price is followed not only by traders and investors but by nearly all the citizens of G-10 economies and as gasoline prices in the US rise for 50th day in a row we have to wonder whether the spike in transportation costs will snuff out the nascent economic recovery. With oil price remaining above the critical $70/bbl level the price of gasoline is steadily inching its way towards the $3/gallon mark. Presently the range in the United States is between $2.55 in the Gulf states and $2.75/gallon on the West Coast.
As oil creeps higher every penny rise in the price of gas is acting as a painful tax on US consumers and diverting disposable income from the pocketbook to the pump. The US consumer is already burdened with heavy debt load, and a near double digit unemployment rate, therefore the sharp spike in the price of oil is especially painful in the present economic climate.
The latest US Retail Sales data confirms the fact that gas purchases are commanding an ever larger part of the consumer’s budget. Although Retail Sales last month beat expectations most of the increase came from gasoline receipts. Given the fact that between 60-70% of all G10 economies are driven by consumption, if this trend continues the recovery thesis will come under enormous stress as the year progresses as all of the inventory building in Q2 of this year by corporations will not find any final demand. This is one of the key reasons we continue to believe that the rally in risk currencies will have a very difficult time making new highs as long as oil prices remain at these elevated levels.
Has the Correction in Commodities Started?
Declines in the prices of gold, oil and copper at the start of this week’s trade are weighing heavy commodity dollars. After its parabolic run which saw prices double since March, oil has finally run into serious resistance at the $70/bbl level as investors question whether the rally can be sustainable under the current economic environment. With gas prices rising towards the $3/gallon level, at the same time as US unemployment approaches 10%, the likelihood of reduction in consumer demand appears to have increased.
Should oil prices fall through the psychologically key $70/bbl level the impact on USD/CAD could be significant. The pair has already bounced 500 points from recent lows at 1.0783, anticipating the stall in the oil rally, and may now target the 1.1500 level if crude falls into the $60’s.
Meanwhile, copper and gold prices have also retreated off their recent highs with yellow metal dropping well below the $950/oz. to trade $932.00 in today’s session as yields on the 10 year US bonds improve to 3.75% from nearly 4.00% reached last week. As fears of inflation begin to recede and gold possibly retraces to the $900/oz barrier the AUD/USD should follow suit. The pair tested but held the 8000 level in today’s trade, but could easily fall into the 70’s if the correction in commodities persists.
With markets starting to question whether the recovery trade has gone to fast too far, the synchronized correction in equities and commodities this week could pressure risk currencies especially if fundamental data begins to falter. Having been the greatest beneficiaries of the rally, the commdollars may now become the biggest victims of the correction if markets begin to drift lower as the week progresses.
me too. funny how it moves. but it always seems to get there.
good man. i was in and back out. then not again until $3.50. rats. oh well. its a an elevator ride.
looks like it broke 73 today thought DXO would be higher.
yeah that is around where I got in at
ST you may very well be right. nothing for the moment can seem to jar it from its course.
yeah in march this year dxo hit $2.06 and oil was $42 ??
so if you do the math from here it seems to be hitting a good lick
oil has broken 70's now. 70 was my top for this year but now it might be 80-85 at this rate imo
Rough estimates of DXO pps as to oil prices
70 per barrel=4.91
80 per barrel=6.15
90 per barrel=7.36
100 per barrel=8.56
120 per barrel=10.98
150 per barrel=14.60
you can't do that imo since DXO is new and last years price was not balanced right. Now next year I could but not now because those numbers did not truly represent the correct pps here.
no what I have seen everyday is when the market opens up whatever oil is the MM's gap up the price down or up 2X what oil is. So DXO is doing exactly what it should be doing. If you look at my estimates their not that very far off.
Could you make a 1 year chart of the price of Oil? The 20 chart is great but I wanted to see how DXO price compares the past year to the price of oil. The past year chart on the 20 year makes it to small.
Thanks.
Strong: take a look at PST ultra short 7-10yr Treasuries ETF as the dollar weakens or as the Fed hikes rates or as inflation creeps in.
I own some at 53 and have had it a while (kind of a slow climber) but it is improving now with the Fed rate climbing and the dollar weak and inflation fears in the wings.
hey guys ive been in this ETN for about 6 months now and we are starting to see some return...but i'm not very educated on ETN'S in general..so when oil goes up about 3% and DXO goes up only about 1% what is going on? we should be seeing at least be seeing 5% increase in DXO, should i be following a different underlying index? would appreciate some input in figuring this out ,thanks
yeah i kinda agree, thought 70 would be max. with summer here I don't see a strong consolidation coming yet.
well.. recently the shakes and the shieks seemed to think $75 was a sustainable number. oil seems to react like gold when times get scarey. in spite of the surplus. but yeah, no idea.
i keep thinking somebody is going to wake up and say hey...we have a huge surplus. lets throw a fire sale.
so has anyone seen any reports of where oil might top out for this year or might get to. Mine was 70 per barrel but now I think it might be 80.
any thoughts
yeah everytime oil goes up DXO goes up 2X. yes there is a 3X but I don't know the symbol.
Question DXO looks like a good place to put my money if inflation starts to go up. Also its called double, so does that mean the return is twice as good when oil goes up? So if oil doubles would we see 4X our money?
Also is there one that is triple like some of the gold ETF's?
Thanks.
yep. full rebound
DXO gonna be a good day, oil 69.22 currently
If consolidation is already over it was short lived
congrats now just enjoy the ride for awhile at least until summer.
I'm very happy this am :) go DXO
Posted by: FiremanDave Date: Wednesday, June 03, 2009 2:09:03 PM
In reply to: pkripper who wrote msg# 376 Post # of 391
IN DXO AT 4.12$ :)
yeah that was the first time I had ever seen something like that. all other emails are about currency pairs
Strong, ah just wondered since it seemd like nice summary info and I thought theoretically the site would provide it on different tickers and maybe for different time horizons.
Thx anyway.
no I don't, suprised I received this since it is strictly a fx site with technical analysis
strong do you have the same data info on other than intra day?
Crude Oil (Jul 09) intraday: key ST resistance at 67.5
Pivot: 67.50
Our Preference: SHORT positions @ 67.3 with 64.9 & 64.2 as next targets.
Alternative scenario: The upside breakout of 67.5 will open the way to 69 & 70.06.
Comment: the 60-min RSI calls for a new downleg. The price could reach the 50% Fib level @ 64.2.
Trend: ST Consolidation; MT Range
well...my stop kicked in. always wish i would have set it higher. but the pps is lower now. i'll pop back in before the end of the day. who knows. may gain a share or two.
low 4's is my guess with summer just starting oil consumption is just beginning
this is headed back over 100 per barrel, maybe not this year but eventualy
I missed the run here...I coulda/shoulda/woulda had the trade form filled out to buy DXO at 3.50$ and was gonna wait for it to drop more (obviously didn't happen). I've had to sit on my hands all day not to buy DXO in the 4.20's today. Where do you think a good first entry/how low do you think this will go before it heads back up again or how long would you wait?
GO GATORS :)
Strong just in time for heating season. lol
Just waiting on the oil mass speculation for some even bigger DXO moves. Wonder if or when that will occur?
lololol she is going up sweetly right now
looks pretty good strong. the stock you hate to love. going up like an elevator in a tall dept store.
looks like my estimates of DXO pps are not that far off
70 per barrel=4.91
80 per barrel=6.15
90 per barrel=7.36
100 per barrel=8.56
120 per barrel=10.98
150 per barrel=14.60
|
Followers
|
26
|
Posters
|
|
|
Posts (Today)
|
0
|
Posts (Total)
|
1166
|
|
Created
|
11/02/08
|
Type
|
Free
|
| Moderators | |||

 |


| Volume | |
| Day Range: | |
| Bid Price | |
| Ask Price | |
| Last Trade Time: |


