 News
News  Market Data
  Discover
Support: 888-992-3836
Copyright © 2023 InvestorsHub Inc.


Register for free to join our community of investors and share your ideas. You will also get access to streaming quotes, interactive charts, trades, portfolio, live options flow and more tools.
NASA Predicts total destruction of power grid! http://science.nasa.gov/headlines/y2009/21jan_severespaceweather.htm
oh that is BEYOND lame.. they only keep 5 minute data for a certain amount of time.. had I realized that I would have hosted the image myself LOL. linkback to see what I am complaining about.
Example Mind Map, built using FreeMind software, which can be downloaded for free at the following link
http://sourceforge.net/projects/freemind/files/
I have windows start FreeMind automatically at startup, and use it to navigate to any task I need throughout the day.
Very useful when combined with scripts and note taking.

Useful Mind Mapping Software for organization:
I'm sure all of you have your own software sets but I thought i would share at least this useful program. Maybe if you have not tried mind mapping yet, you should consider learning about it as an added value to your mental toolset.
FreeMind is an open-source (you don't have to pay) Mind Mapping program. I use it for everything from trading journal to project management, to time management(it has built in calendar alert system.) You can insert images or open external programs such as executeables and .pdfs all within the map structure, so it is great for taking notes and linking directly to the material you are working on, etc.
http://freemind.sourceforge.net/wiki/index.php/Main_Page
Here is an image example of a mind map, though this example was not created with the above software:
below image taken from http://daytradinglife.com/

Thanks that is my favorite stock ...
Nice move on your NM!
linkback twice for chart
Abundance videos:
These are all links to part 1 of each series, be sure to watch the whole series on youtube.
The Science of Getting Rich:
Trader Talk Series
http://www.lightspeed.com/index.php?page_id=50
I am the best...
at sitting on my hands.. even during +200 dow days LOL
Every day I make green calls, I watch small moves and huge moves... yet I sit on my hands. I know i could use stop loss orders to protect the account, yet I sit on my hands.
That $300 margin buffer is really digging in to me. If it was $3k instead of $300, would i still sit on my hands? No. But what is the difference? With proper money management the buffer should be able to be as small as $300..
So I will continue to work on this problem.
"If the trendlines on the macd and the slow stoch ema13 hold true, the bulls will be taking over the rest of the week."
;)
SPX annotated charts
Daily:
Successive dips each showed more weakness in the rebound than the previous dips. Current rebound is very weak, however at least it is showing signs of rebound. If the trendlines on the macd and the slow stoch ema13 hold true, the bulls will be taking over the rest of the week. But it has to get through those resistances formed by MA50, EMA34, and EMA21 now, whereas this was not as necessary on the recent 3 dips.
Daily:
Monthly:
needs to Close above ema21 !!!
Monthly:
Weekly:
lags the daily but could go either way here. still bullish on this scale but showing signs of wanting to come back down to, you guessed it, EMA21!!!
Weekly:
(p.s. I finally stopped using ema7 and switched to the proper ema8, there was not much difference so I might as well use the true Fibonacci sequence.)
UA 5 minute. This is another good example of some of the moving average behavior I have talked about previously:
p.s. this is a 'study' post, not a buy recommendation ;)
http://investorshub.advfn.com/boards/read_msg.aspx?message_id=41844119
Newcomers: Please check out the links in ibox.
Most important is this:
http://investorshub.advfn.com/boards/read_msg.aspx?message_id=42859259
can't wait to see those annotations and fib retraction levels, it's a fact that shipping is a leading indicator of the markets, and IMO NM is the best shipper there is.
there are probably some trendlines that can be drawn between the SMA50 and the EMA34, that might act as support before it would go as far as SMA50. I'll see about adding some.
p.s. i added fib retracement from november candle bottom.
wow thanks! I doubt it can see that 50DMA all hell would have to break loose for that to happen!
NM weekly
Looks like this one is following the declining market. it is not very 'ema' friendly on the daily. Here is weekly.
to note: MA50 dragged it down as it pierced the trading channel between may and july. It already fell through the EMA55 trading channel, and if it can't hold the ema34 and bounce off it, it might fall back towards MA50 on the weekly. There is a lot of resistance above or it would have managed to break those upper ema by now.
p.s. not a buy or sell recommendation, and i could be entirely wrong
very nice ionized! can i get you do do an evaluation Fibonacci chart for my favorite stock NM? So that i can learn from the levels, ty
Complex Systems Refresher
http://www.scholarpedia.org/article/Complex_systems
Videos relating to complex systems:
Modeling complex adaptive systems -
HSY 5 minute Fibonacci numbered Ema example.
Part of fibonacci sequence is 8,13,21,34,55,89,144,233
i use 7 instead of 8, and leave out the 13, relying on ema7 and ema21 behavior to determine possible trend. macd is based on 7/21/5
5 minute chart from 10/22/09
quote "There was a Geometry of Time itself!" Armstrong
Do you realize that the 51.2 year cycle that Armstrong describes as the long wave cycle, I realized coincides with the Maya long count calendar round, which is also just shy of a 52 year cycle. The correlations are unreal!
just because i have always loved the bands meaning and music
Fascinating article. I want more! LOL
-Dave-
The Secret Cycle
http://www.scribd.com/doc/20783434/cyclesnewyorker101209
I'm grateful to be alive in a time when we may see dramatic change on the planet, and in the local space environment. I am also grateful to understand the proper causes of these changes as being related to the larger scale systems that our solar system finds itself immersed within.
The universe is comprised of fractal patterns of oscillating organic energy. On the largest scales the plasma filaments that comprise energy flow between galaxies create a cellular structure throughout the cosmos. A neuronal energy pattern on the largest scales, with information flow between galaxies.
If our planet can no longer sustain when our system traverses a local change in near-space environment, I am glad to have witnessed and experienced this limited part of our great universal consciousness.
Life is a fantastic journey.
Jump in.

(me jumping in favorite waterfall, back in early/mid twenties during college)
other pictures from back then, I spent most of the time in nature:


The farmers almanac is predicting this winter to be the worst/coldest in a long time for mid-western states, including where I am in Michigan. So far we are having much lower temperatures than usual in this part of the state.
let me guess that will be the next mega market crash too!
It is the calm before the storm, which will begin within 3 years.
that guy looks right!
Also this post:
http://investorshub.advfn.com/boards/read_msg.aspx?message_id=41846056
for the above post you will need to look up the 5 minute chart on 9/24/09 for CHTP
Read these posts for a look into ema versus sma behavior:
http://investorshub.advfn.com/boards/read_msg.aspx?message_id=41819703
http://investorshub.advfn.com/boards/replies.aspx?msg=41819730
http://investorshub.advfn.com/boards/read_msg.aspx?message_id=41843161
edit I just realized the chart in my last post which was perfect example, I did not save as snapshot so that post will only be valid for today. In other words, you will have to look up the osur 5 minute chart for 9/24/09 and reference that to see what I am saying.
S&P Fib Analysis Video:
http://broadcast.ino.com/education/sp500twoforces/
No Sun Activity= Rising stock market! Proven fact!
The absence of solar activity is conducive to a rising stock market!
Get a load of this! IHC.com lol
http://www.instituteforhumancontinuity.org/
What are your thoughts on negative ions? and products that emanate or produce them?
breaking news! ABOUT THE SUN and Galaxy! READ!
http://news.yahoo.com/s/space/20090827/sc_space/deathraysfromspacehowbadarethey
|
Followers
|
5
|
Posters
|
|
|
Posts (Today)
|
0
|
Posts (Total)
|
201
|
|
Created
|
07/30/09
|
Type
|
Free
|
| Moderator Ionized | |||
| Assistants investorwisdom | |||
"The plasma exhibited striations, double layers, and an assortment of oscillations and instabilities...
In short, it was a field which was not well suited for mathematically elegant theories."
- Hannes Alfven, in his book Cosmic Plasma


Similar to a plasma, the stock markets behave in the manner of a complex, non-linear, open system.
This board should be used to expound on some of the ideas found in 'econophysics'.
I don't mean the status-quo, mainstream, academic apologist swill that is used as an excuse for science these days. Skeptics and Apologists will be shown the door.
Here we are not afraid to admit that the Markets are inefficient, non-linear, complex systems.
Here we also admit the universe is vast yet partly understandable, and fundamental principles of
universal process can be discovered and described through interdisciplinary research.
Feel free to talk about 2012 and the coming shift in our near-space electromagnetic environment, plasma cosmology,
and also process metaphysics if you get really bored.
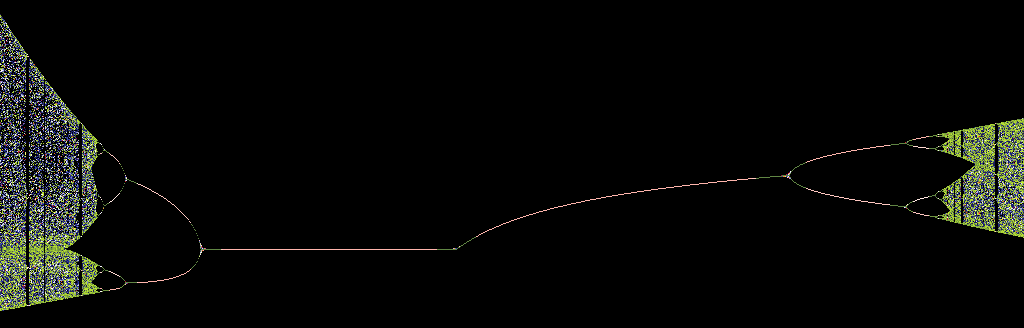
Bifurcation Diagrams: images.google.com/images

| Plasma, physics and cosmology: |
| video.google.com/videoplay www.youtube.com/watch |
| en.wikipedia.org/wiki/Plasma_(physics) www.plasmacosmology.net |
| Hannes Alfven: www.youtube.com/watch Ilya Prigogine: www.youtube.com/watch David Bohm: www.youtube.com/watch plato.stanford.edu/entries/process-philosophy/ |
| Miscellaneous: |
| Ancient Astronauts: en.wikipedia.org/wiki/Ancient_astronauts |
| Unrelated Music: |
| Benoit is scared: www.youtube.com/watch |
| What is Technical Analysis? stockcharts.com/school/doku.php |
| Volume | |
| Day Range: | |
| Bid Price | |
| Ask Price | |
| Last Trade Time: |


