 News
News  Market Data
  Discover
Support: 888-992-3836
Copyright © 2023 InvestorsHub Inc.


Register for free to join our community of investors and share your ideas. You will also get access to streaming quotes, interactive charts, trades, portfolio, live options flow and more tools.
CMG Breakout On Daily Squeeze
Technically it busted out Friday and as of now we're in day two
of the breakout on the daily. However, CMG is in the weekly squeeze also and it hasn't yet broken out in that period. So far we've seen a fifty dollar move from the bottom around 633.00 to this morning.
The Mar 645 Calls are at 63.20 from 45.60 entry. Closed the puts for green on the rebound off the low after this trade began.
Creating my own voodoo lines on a daily & 30 min period chart keeps me in the trade as we push up into higher lines and get rejected, supported by lower lines, and bouncing back north through the prior R into the next R areas.
Cheers

Happy New Years
Goodies & Cheers
Weeeeeeeeee
TSLA Fib Timing / H&S Update
TSLA had a fib timing cluster on 12-15, 16, & 17.
Price also moved more than halfway past a 127.2 extension coming near the 161.8 extension. If price continues north we have R between 232.45 & 235.32, then another cluster at 237.89 thru 238.66. Don't know if a reversal has begun or if this was just a counter trend cycle.
Cheers

NFLX Fib Timing & Price Crossing
A fib price cluster should have an extension, a retracement, and symmetry in a fairly tight range. Here in NFLX we only have two out of three. We do have a fib timing cluster which is always composed of fib extensions. For timing we have a 227.2%, 161.8% & 261.8% clustered on 12-15 & 12-16 with two of three falling on 12-16.
The low on 12-16 was 316.00 which didn't breach the suggested support of 311.06 thru 314.14. The timing & price cross could signal a reversal. The pattern post earnings into 12-16 could also be the not so obvious algos hunting for stop loss orders. Because it looks exactly like what is shown, price pushed past the prior swing low and past the low on 10-16. Nothing is certain. If we get the 8/34EMA crossover to the upside with a DMI crossover combined,
I might do 60 day calls, selling weekly puts spreads along the way.
Cheers

$GMCR Annotated Chart
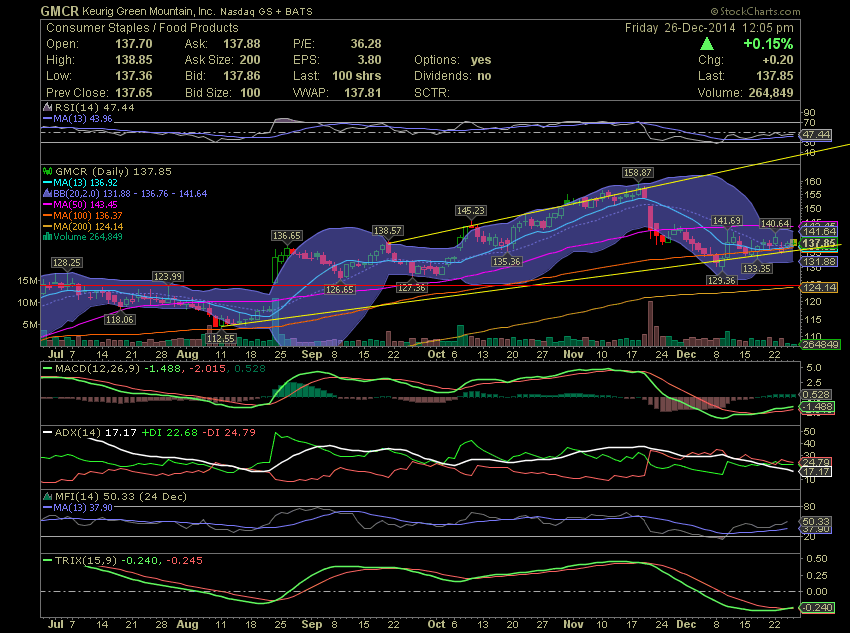
$GMCR Breakout Alert 137.70, short term going for jan15 140call@3.05, 50ma resistance is my short term target. My stop here is the 100ma support
New StockGoodies FREE Learning Center!
New to Board and Enjoy 1000%+ GAINS?? If your new to trading it really is about who u follow that can help landing that next penny stock winner! It is confusing sorting out all the stock tickers and noise here on investors hub. Lots have a agenda like some that have frontloaded shares or groups trying to push a stock. We are technical traders here at StockGoodies and if u have followed us over the past 4 years or so you will see the pattern. We love to follow charts and alert folks to reversals, hot promotion high flyers that have pulled back and or news that could potentially send a stock or sector of stocks higher. $MGON is just one example. Reversal Watch @.0086-.095, Follow me and the Goodies and catch that Next 1000% Runner

StockGoodies Learning Center http://www.stockgoodies.com/chart-school.html
SIGN UP FOR 100% FREE ALERTS HERE
Newsletters or Texts to your Phone!
Website http://www.stockgoodies.com/
Free Newsletter http://stockgoodies.com/
Lightening Fast Text Alerts to Your Phone! TEXT “Stocks” to 31279
Ihub Mailer http://bit.ly/PnsdN5
JOIN OUR STOCKGOODIE SKYPE CHAT ROOM! (FREE of Course)
http://www.stockgoodies.com/stock-chat.html
MERRY CHRISTMAS TRADERS!!!!
CMG Breaks Downtrend Line
Still technically consolodating as the daily and weekly squeeze haven't yet fired, CMG has broken a downtrend line on the daily and weekly period. After a retracement into the 61.8 off the daily, price moved north slamming into the 127.2% extension off a 30 min period move. Along the way it bumped into overhead resistance at a cluster of two fib levels and a symmetry fireline between 656.50 & 657.83. We hit this cluster twice and retraced with a second luster of two fib levels and a symmetry fireline providing support. Yesterday, price action sliced through that overhead cluster, pulled back to a smaller extension/symmetry fireline which provided support, moved back up to close on top of the downtrend line.
Cheers

$EOG Back to the 200ma rinse repeat Annotated Chart
CMG Support Cluster
641.41 - 643.67
Comes from four prior symmetry projections,one 127.2 extension
and a 50% fib retracement...
Last week took the Mar 645 call and 640 put, long biased with
a 20 point delta difference. The bracket trade is down a bit here
but if it continues downward the deltas will swap and it could
go green again. There is the 161.8% extension down at 638.41 in
the cluster. I'd like to see that hold but if it doesn't I won't
be sweating it.
Cheers
CMG Coiled For A Breakeout
CMG has been consolodating for a while now.
It's in a weekly, daily, hourly, and fifteen minute squeeze.
The probability is 75% for an upside break. Then there is the
the other side, 25% as there is no certainty in markets. There is
a way to configure a trade going out three to four founths
to limit risk. Buy delta 70's calls and then buy puts as near
to 20 deltas lower than your calls as you can get. The further
expirations reduce theta decay. Once CMG breaks to the up or downside, pick up some near term calls or puts to capitalize
on the directional move.

Cheers
TSLA Head & Shoulders
It's there, on the daily and weekly.
However, is it there on it's own or did it get some help.
With Algos and HF's creating patterns to suck in traders
now, we don't know. It's broken up through a downtrend line
on the hourly. Previous swing high is 217.73.
It's made a fib extension to the downside and a symmetry
support line at 204.12 wasn't violated.
Cheers

GLD Cycles And Price Hurdles
http://www.fibonacciqueen.com/public/GLD-the-next-decision.cfm?inf_contact_key=e13722d0054574d4425246dae8e352320489631a5bcf9c213ecf05460cc437ce
Cheers
Just sold $CELG Calls for a loss
Just grabbed $CELG $116 DEC5th Calls at $.40
Just sold $SPG Calls from $.52 to $.69 Profit. Nice 32% profit right there!
Just grabbed $SPG $185 DEC20th Calls at $.52
Just grabbed $GOOG $537.50 NOV22 CALLS at $1.60
Just grabbed $CMG $630 NOV7 PUTS at $.80
Just sold those $JNPR $21 NOV7 Calls from $.26 to $.31 Profit!! 3 Profits in a row now!!!!
Just grabbed $JNPR $21 NOV7 Calls at $.26
Sold $JOY $52 NOV7 Puts earlier from $.58 to $.69 Profit!!
Just grabbed $JOY $52 NOV7 Puts at $.58
I like it going to look for an entry
$EOG 91.11, Lots of upside in this chart premier oil driller thats already been cut in half dipping below the weekly 100ma and bounced back. Oil stocks have been taking a beating but imo its overdone and imo bottoms in on this one. Been trading swings ever since 85 and options are pretty liquid. Weekly MACD is almost there.
$X 34.00 Radar 34 calls here on the pull back
$AEM Hitting 33.25, the 200ma resistance from 28.39 Watch. Looking for a pullback to the 20ma for a possible continuation
$INO 11.84 Alert Breakout Chart, Ebola stock
ManicTrader Member Level Tuesday, 10/14/14 02:37:09 PM
Re: [SMART MONEY] post# 1458462
Post # of 1461310
Look at $INO 11.00, she has options and charts breaking out, 200ma is my stop on the daily chart
EBOLA stocks as you know have been on fire but one has been late to the party but making gains when markets been bleeding. 12 calls 400% today
Thanks DM, Hope they call me lol. Good looking out
ATTENTION~~~~ IF ANY OF YOU GUYS RECIEVE A PHONE CALL FROM A 202 AREA CODE NUMBER AND THEY TELL U IN A RECORDING THAT THEY ARE FILING A LAWSUIT AGAINST YOU FROM THE IRS ITS A HUGE SCAM. I JUST RECIEVED ONE THIS MORNING FROM THIS NUMBER 202-864-1176. IF IT WAS REALLY THE IRS AND THEY WANTED ME THAT BAD MY MAILBOX WOULD HAVE BEEN FLOODED WITH IRS LETTERS AND EVERYTHING ELSE. AND A RECORDING WOULDNT LEAVE A MESSAGE. IT WOULD BE AN ACTUAL PERSON GIVING THEIR AGENT NUMBER ALONG WITH THE CALL.
Thanks buddy, yeah it took like 11-12 weeks but all seems good now
Sorry to hear this Manic. I have just recently had surgery and getting over it. It has been little over 4 weeks and it took a toll on me. Doctor told me 4-6 weeks before I get back like I was before surgery. Hope everything is improving for ya my friend!
Stocktraderva
$AEM 30.30, Oversold premier gold miner. In 32.5 & 35 call.

Thanks for info MT. It is appreciated. 
Good stocks going on SALE! green light specials lol
$SINA -4.99% close, 44.77 retest of support was 44.85, thats the new support to watch. Should see uptrend continue we hold
Market selling pressure giving up gains in alot of our stocks!
Welcome to the board. I am not a financial advisor or anything of the sort. But what i do on a long term trade such as you mentioned. XYZ stock is at 6.50 and in a year i think it will go up 8.00 or higher i would choose the 7 & 8 strike but thats just me.
So much you have to educate yourself on with options but they can be very profitable as well as not if your wrong but you can only lose whatever money u spent. But is very appealing being able to control shares of quality stocks for much less then buying the shares.
Read and learn all you can and i highly recommend paper trading options, thats the best way to put what u learn to use. optionmonster.com has a pretty decent platform & prices. Its free but u have to register.
New to options: can I ask the board a question? I have been in stocks for 30 years and am 67 years old, but just started to "dabble" in call options.
So if I may ask a general question to anyone who is nice enough to answer me:
If for example I like a stock that is currently at $6.40, and think it will rise within a year or so, is an "in the money" Mar202015 $5 call for $1.75 a good strategy, or a good buy?
It seems that "in the money" long term calls are good to sell about 3 to 4 months before the expiration date from what I have read, so maybe I would look to sell it around December if it goes up as I think it will into Christmas?
Now "IF" the stock goes to say $8.00 by then, what could I expect the option to sell at if it has a delta of about .80?
Any reply is appreciated.
Thanks.
SINA Reversal Alert 47.70, Annotated Charts, to hold 100ma resistance now becoming new support.


$ISIS Breakout Alert 41.29, Annotated Charts, long term target, retest of highs imo. Staying ITM options short term and OTM options longer term


$GEVO looking like potential bottom here!
Slim pickens though.. lol
https://www.google.com/finance/option_chain?q=NASDAQ%3AGEVO
Refined And Tested
Across four trades now taking 15% to 20% in five days or less.
No homeruns but that isn't the plan. For a bullish bias trade,
buying the delta 50 calls 60 to 90 days out, and buying the put
as near to delta 20 less than the call side. So delta 50 calls,
delta 30 puts. I lost a little on trade five, but the delta spread
was too wide. So I refined it to the above.
Price action can move either direction and produces at worse
case a break even trade. If you want to ride it longer for more loot
you can sell credit spreads one standard deviation out on weeklies
entering on Tuesday to capture premium decay to offset theta decay
if price is stagnant. If it's a bullish bias trade sell put credit spreads and vise versa for a bearish bias trade. This is risk management eliminating the gambling aspect. I'm still using TTM squeeze & waves combined with Fibqueen analytics to determine tickers to hit. ToS added symmetry data to the Trendline drawing
tool. They still lack the ability to plot the put/call ratio but rumor has it they're working on adding this.
Cheers
$AMZN BREAKOUT!!!!!! 335 & 340 sept calls @8.15 & 5.70
Trade Structure
IBM Oct monthly.
71 days out. Low theta.
I give this five days to work out.
If price is still near where it was on entry I bail
down about 60 bucks from theta decay. But if I get
a 10 dollar move either way in the next five days,
it's green. This is a bullish biased set up. Buying
a put at half the delta roughly, as the call. A larger
move, more than 10 bucks either way is desirable.
That is unless my figuring is wrong. The arrows are
pointing to the theo price which is typically my fill.
Cheers

Feed The Ducks
Left the TSLA trade at a 161.8 extension on the 15 min.
Calls took in 750
Puts lost 250
Five benjamins to the good side.
Cheers
TSLA Trade Monday Entry
Sep Mnly 240 Call @ 12.70 / Delta 49 or so
Sep Mnly 215 Put X 2 @ 4.48 / Delta 21 or so
Dec Mnly 295 Call @ 7.20 / Delta 20 or so
TSLA just broke out of a weekly squeeze this week,
and it's two dots into a daily squeeze break also.
This is a bullish trade with the puts as a hedge.
When price rises my puts go down in delta at the same time
the call deltas rise, and vise versa.
If broad markets weren't so volatile, selling the weekly
put credit spread five dollars wide down at 230 or so
would have been first choice to capture and profit from
theta decay. The calls combined with PCS is an 80% probability
set up. It wins with anything except a quick sharp decline.
Cheers
|
Followers
|
82
|
Posters
|
|
|
Posts (Today)
|
0
|
Posts (Total)
|
4721
|
|
Created
|
05/16/11
|
Type
|
Free
|
| Moderator ManicTrader | |||
| Assistants Mt. Blanc Justified RIPPER | |||


|
Posts Today
|
0
|
|
Posts (Total)
|
4721
|
|
Posters
|
|
|
Moderator
|
|
|
Assistants
|
| Volume | |
| Day Range: | |
| Bid Price | |
| Ask Price | |
| Last Trade Time: |


