 News
News  Market Data
  Discover
Support: 888-992-3836
Copyright © 2023 InvestorsHub Inc.


Register for free to join our community of investors and share your ideas. You will also get access to streaming quotes, interactive charts, trades, portfolio, live options flow and more tools.
NY Crude Oil Futures »» Weekly Summary Analysis
By: Marty Armstrong | March 29, 2024
NY Crude Oil Futures closed today at 8317 and is trading up about 16% for the year from last year's settlement of 7165. Up to now, this market has been declining for going into 2024 reflecting that this has been only still a bearish reactionary trend.
Up to now, we still have only a 2 month reaction rally from the low established during December 2023. We must exceed the 3 month mark in order to imply that a trend is developing.
MARKET OVERVIEW
NEAR-TERM OUTLOOK
The historical broader tone of the NY Crude Oil Futures has been a bearish consolidation following the high established back in 2008. Since then, this market has created 2 reaction highs which have been unable to break this overall protracted bearish consolidating trend. Still, the major low was made in 2023 and the market has bounced back for the last year. The last Yearly Reversal to be elected was a Bullish at the close of 2023.
This market remains in a positive position on the weekly to yearly levels of our indicating models. Nevertheless, it closed last year on the weak side down from 2022. Pay attention to the Monthly level for any serious change in long-term trend ahead.
Looking at the indicating ranges on the Daily level in the NY Crude Oil Futures, this market remains in a bullish position at this time with the underlying support beginning at 8265.
On the weekly level, the last important high was established the week of March 18th at 8312, which was up 14 weeks from the low made back during the week of December 11th. So far, this week is has moved to the upside exceeding last week's high of 8312 reaching 8321. A closing above last week's high would be a technical signal that the advance is still in motion just yet. This makes the current rally 1 weeks to date. .
When we look deeply into the underlying tone of this immediate market, we see it is currently still in a semi neutral posture despite declining from the previous high at 8312 made 0 week ago. Still, this market is within our trading envelope which spans between 6295 and 8977. The broader perspective, this current rally into the week of March 18th reaching 8312 has exceeded the previous high of 7960 made back during the week of November 27th. Right now, the market is neutral on our weekly Momentum Models warning we have overhead resistance forming and support in the general vacinity of 7584. Additional support is to be found at 7141. Looking at this from a wider perspective, this market has been trading up for the past 14 weeks overall.
INTERMEDIATE-TERM OUTLOOK
Looking at the longer-term monthly level, we did see that the market made a high in September 2023 at 9503. After a four month rally from the previous low of 8346, it made last high in September. Since this last high, the market has corrected for four months. However, this market has held important support last month. So far here in March, this market has held above last month's low of 7141 reaching 7141.
Some caution is necessary since the last high 9503 was important given we did obtain one sell signal from that event established during September 2023. That high was still lower than the previous high established at 12368 back during June 2022. Critical support still underlies this market at 6700 and a break of that level on a monthly closing basis would warn of a further decline ahead becomes possible. Nevertheless, at this time, the market is still weak.
 DiscoverGold
Natural Gas Eyes Bullish Reversal from Retracement Low
By: Bruce Powers | March 28, 2024
• Natural gas bounced from 1.69 low, eyes bullish reversal above 1.76 with potential to eventually breakout of double bottom pattern.
Natural gas falls to a new retracement low of 1.69 before finding support and bouncing intraday. It is possible that today completes a two-day retracement as a 61.8% Fibonacci level was just below today’s low at 1.68. Today’s high of 1.76 found resistance at the 20-Day MA (purple). Today’s candle sets up for a bullish reversal signal on a decisive rally above today’s high. Natural gas would then be heading for the recent swing high of 1.83 with the potential to breakout above that price level.

Rally Above 1.83 Confirms Strength
A rally above 1.83 would trigger a continuation of the rally begun from the recent swing low at 1.59 (C). That low is a second bottom that sets up a potential double bottom bullish reversal pattern. It triggers on a move above the March 5 swing high at 2.01. Until then it is a potential double bottom. The target derived from the pattern is approximately 2.50. If reached, it would put natural gas a little below the 200-Day MA, currently at 2.57.
Eyes Breakout Above Long-term Downtrend Line
If natural gas can close above the 1.83 swing high it will have broken back above the long-term downtrend line, which has represented dynamic resistance since the end of January. That would provide a clear sign that the price of natural gas is continuing to strengthen and that the current rally has the potential to reach higher targets. Subsequently, we will need to see further confirmation of strength to indicate that it can keep rising. The 50-Day MA is a target and it currently sits at 1.91. A daily close above it will indicate improving demand and improve that chance that natural gas keeps rising.
Rise Above 2.01 Needed for Sustainable Signs of Strength
Resistance was seen on the last advance at 2.01 (B). That is right around previous support seen at the prior trend lows in 2023. A daily close above that level would provide a sign that demand is continuing to strengthen on the way up. It triggers a breakout of the double bottom and confirms a continuation of the counter-trend rally. The next higher target would then be the February 1 swing high of 2.17.
Read Full Story »»»
DiscoverGold
Biden Panic Buying. The Energy Report
By: Phil Flynn | March 28, 2024
What does it say that the Biden administration is starting to buy oil back for the Strategic Petroleum Reserve (SPR) above their stated $70.00 to $67.00 a barrel buying price, purchasing oil at $81.32 a barrel? Is it possible that the Biden administration is fearful that we’re going to get another spike in price? Or are they trying to fill it up in anticipation of something more ominous? Are they worried about the report from energy consultancy Wood Mackenzie that warns that more than one firth, or 21%, of global refining capacity is at risk of closure due in part because of what Saudi Aramco Chief Executive Amin Nasser said this week was a failed and flawed energy transition? Are they starting to worry that major reporting agencies like the International Energy Agency are starting to predict an oil deficit something The Energy Report of course has been warning about for over a year? Perhaps they are starting to worry about more predictions like that of Morgan Stanley about calls for a return to $100.00 a barrel of oil. Are they worried that heading into an election year, we’re seeing gasoline prices start to rise and the defense of their green energy policy is not going to play well on Main Street America?
Perhaps they are concerned that their political motivated use of our strategic reserves has left the country more vulnerable as the Biden foreign policy has failed to reduce risk to global energy supply and global supply chains. Biden’s presidency has seen the risk to global energy supply higher than it has been in at least a half of century. The easing up on Iran has allowed Iranian oil production to hit the highest level since 2018 and has put billions of dollars in their coffers so they can fund their friends in Hamas, Hezbollah, and the Houthi rebels. Perhaps there is worry that the country is not going to be able to respond to a major oil price disruption.
Of course it doesn’t help that the Biden administration has demonized the US oil and gas industry and created more regulations with heavy-handed tactics that are not based in real science and is discouraging investment in the US oil and gas space which is leading some people to predict that US energy production will peak and start to fall. It doesn’t help that the Biden administration killed the Keystone XL pipeline for purely political purposes. Government studies show that the Keystone Pipeline would not have added to greenhouse gas emissions so the decision to kill the Keystone XL pipeline was purely political. Now with the global supply of oil being exceedingly tight, especially that of heavy oil, the Keystone Pipeline could have moved oil much more efficiently and safely than it’s being moved today.
Regardless of the oil and oil products, the fundamental outlook must be putting major pressure on this administration that is trying to convince you that they have reduced inflation even as everyone knows that the opposite is true. Perhaps they are upping the purchases or the SPR regardless of price because of previous comments by Energy Secretary Granholm’s impossible promise to refill the reserve by the end of the year. She was quoted as saying, “By the end of this year, because of crude purchases, the reserve is expected to “be back to essentially where we would have been had we not sold during the invasion of Ukraine,” after accounting for the cancellation of 140 mn bl of congressional mandated crude sales that were scheduled through 2031. Or maybe it’s just a realization that they’re starting to panic because they used the Strategic Petroleum Reserve as a measure to lower gasoline prices before the war in Ukraine started and now the world is at risk of a major supply shortage and they might not have enough well in the bank to cover in the event of a global disruption.
The Biden administration misused the SPR by changing the definition of the reserve as a reserve to be used in the event of an emergency not in the event of a political crisis. It was never meant to be used as a price control mechanism.
What does it mean when a People’s Bank of China adviser admits that the Chinese past regulatory tightening has hurt the confidence of investment in China? No, US Treasury Secretary Janet Yellen has the nerve to call out China saying that they should never flood the world with cheap energy exports saying it would disrupt global markets and harm workers. Of course, that’s pretty funny because she supported Biden’s release from the Strategic Petroleum Reserve. Is she trying to say that Biden’s release from the Strategic Petroleum Reserve didn’t distort global markets and harm workers? Is she saying that the killing of the Keystone Pipeline didn’t harm workers? Is she saying that the drilling moratorium and regulatory environment didn’t hurt workers in the US oil and gas industry?
Well, the reality is that we’re starting to see oil prices start to react to the global situation. Crude oil prices are surging back to the high after they put into perspective yesterday’s Energy Information Administration report that wasn’t nearly as bearish as the American Petroleum Institute report. Gasoline supplies on the West Coast seem to be tightening significantly which means California is going to see another price spike in gasoline and leave the nation with higher prices.
The EIA said that U.S. commercial crude oil inventories (excluding those in the Strategic Petroleum Reserve) increased by 3.2 million barrels from the previous week. At 448.2 million barrels, U.S. crude oil inventories are about 2% below the five year average for this time of year. Total motor gasoline inventories increased by 1.3 million barrels from last week and are about 1% below the five-year average for this time of year. Finished gasoline inventories decreased while blending components inventories increased last week. Distillate fuel inventories decreased by 1.2 million barrels last week and are about 6% below the five-year average for this time of year. Total commercial petroleum inventories increased by 5.3 million barrels last week. Total products supplied over the last four-week period averaged 20.1 million barrels a day, up by 2.2% from the same period last year. Over the past four weeks, motor gasoline product supplied averaged 8.9 million barrels a day, up by 0.9% from the same period last year. Distillate fuel product supplied averaged 3.8 million barrels a day over the past four weeks, up by 2.2% from the same period last year. Jet fuel product supplied was up 0.4% compared with the same four-week period last year.
Berkeley, CA had to reverse its ban on natural gas. Hopefully the rest of the country will do the same, especially in New York where the natural gas ban and new building is going a have devastating effects on the New York economy. Of course the New York economy it’s a mess anyway. Natural gas traders are hoping for a resumption of the Freeport LNG terminal quickly so LNG exports can start to surge. Natural gas production is showing some signs of easing off.
Read Full Story »»»
DiscoverGold
Natural Gas Symmetry Pattern Points to Higher Targets
By: Bruce Powers | March 27, 2024
• Natural gas is testing support at the 8-Day MA and 1.70 level, with a bullish reversal indicated on the weekly chart.
Natural gas pulls back below Tuesday’s low to test support at the 8-Day MA. Support and the low of the day for Wednesday was at 1.70, at the time of this writing, and the 8-Day line is at 1.70. As of Monday’s 1.59, swing low (C), natural gas began the second leg up of a rising ABCD pattern. It remains valid unless there is a drop below 1.59.

Higher Swing Low Points to Improving Demand
Since there is now a higher swing low at 1.59, natural gas is showing improving underlying demand. It is still early but that is the situation currently. Therefore, the expectation is for the initial target from the ABCD pattern to be reached. It completes at 2.08, which is where there is price symmetry between the CD leg and the AB leg of the pattern. That target is then watched as any pivot level may be. Either resistance is seen or a breakout through the target zone follows and natural gas heads towards higher price levels.
Resistance Seen at Long-term Downtrend Line
Nevertheless, the next potential barrier that needs to be busted for further signs of strength is yesterday’s high of 1.83. Notice that resistance was seen right at the long-term downtrend line. That line was successfully tested as resistance twice previously (red circles). Therefore, it represents the next important barrier to be broken if the bulls are going to take back control. If it is exceeded to the upside, the next target zone would be around the 50-Day MA.
50-Day Line at 1.94 Also Upside Target
The 50-Day line is currently at 1.94 and is confirmed by the important prior trend low from April 2023. It was critical support at the same price in 2023 and now it is potentially significant resistance. That also means that a bust-up through that price level should see demand increase as it will mark a key improvement in the developing uptrend. Although, keep in mind that it is a counter-trend rally within a larger downtrend price structure.
Weekly Bullish Reversal Signaled
Currently, natural gas is showing a bullish reversal on the weekly chart, which is an outside week. A weekly close above last week’s high of 1.77 will provide a stronger sign of strength than a close below that level.
Read Full Story »»»
DiscoverGold
API Surprise. The Energy Report
By: Phil Flynn | March 27, 2024
As the market prepares for the upcoming Easter holiday and with the oil market closed on Good Friday, a shocking build in crude supply might be a bit hard to shake off. The American Petroleum Institute (API) reported a massive 9.337-million-barrel increase in crude supply along with a much larger-than-expected 2.392-million-barrel increase in crude oil supply. The surge in crude supplies would be welcome news for refiners but it does have people questioning how we could have seen such a large increase in just one week. We do know that refinery maintenance issues helped increase supplies at Cushing, OK. We know that ongoing refinery maintenance issues could be partly to blame. Regardless, the increase in size was stunning just to say the least.
Oil exports and oil production are going to be monitored very closely if it weren’t for the fact that we saw a very large 4.437 million barrel drop in gasoline inventories, the market might have fallen apart on light volume that gets lighter as we get closer to the end of this shortened trading week. Distillates barely moved the needle, increasing by just 531,000 barrels. Today the market is going to analyze the Energy Information Administration report to see if this build is an aberration or if there’s something in the data that suggests a significant drop in demand.
We do know that consumer confidence, according to yesterday’s data, took a big hit. The consumer confidence board reported that the consumer confidence index fell to 104.7 this month from a revised 104.8 (originally106.7) in February and below market expectations. Consumers feeling the heat from inflation not only in rising gasoline prices but also at the grocery store are raising concerns that they may pull back when it comes to driving vacations and discretionary spending. Gasoline demand is going to be watched very carefully because if it drops, it means to consumers have hit a point where they need to pull back.
Even Russia’s commitment to cut production to 9 million barrels a day by June didn’t seem to have a lasting impact on prices. Still, the reduction in Russian oil production combined with reduced refining capacity should continue to keep the squeeze on supplies in Europe and globally. This comes as increased sanctions on Russia lead to payment delays. Reuters is reporting that, “Russian oil firms face delays of up to several months to be paid for crude and fuel as banks in China, Turkey and the United Arab Emirates (UAE) become more wary of U.S. secondary sanctions, eight sources familiar with the matter said. Payment delays reduce revenue to the Kremlin and make them erratic, allowing Washington to achieve its dual policy sanction goals – to disrupt money going to the Kremlin to punish it for the war in Ukraine while not interrupting global energy flows.”
Going into the Easter holiday we are seeing gasoline prices that are higher than they were yesterday, higher than they were a week ago, higher than they were a year ago. Today gasoline prices are clocking in at $3.53 .5 per gallon. That is up two cents from a week ago, 22 1/2 cents from a month ago and about a dime higher than they were a year ago. The trend of falling gasoline supplies needs to be reversed. It’s going to be interesting to see if there are any signs that that will happen in the Energy Information Administration report.
The market is trying to assess its supply chain issues when it comes to the tragic Francis Scott Key bridge collapse in the port of Baltimore. Close Point LNG said that their operations are going to continue as normal as their facilities were south of the bridge collapse therefore their exports will not be impacted. Car manufacturers, mainly Mazda, is going to have significant supply chain issues until the port is reopened. The port of Baltimore is the major import and export point for many automakers especially some of the higher end brands. It is a major hub for Domino sugar and some of their products also could be harder to find.
Fox News is reporting that safety investigators will probe whether dirty fuel contributed to Francis Scott Key Bridge collapse. They write that, “A safety investigation into the Francis Scott Key Bridge collapse in Baltimore, Maryland, will include whether contaminated fuel was a factor in a cargo ship losing power and crashing into the bridge. Investigators had not boarded the ship, a 948-foot-long container ship called the Dali, as of late Tuesday while it remained stuck on a pillar of the collapsed bridge, and the vessel could stay there for weeks. Rescue crews spent much of Tuesday searching for potential survivors, but officials announced that the search and rescue had been turned into a recovery operation.
Fox News said that, “blackouts at sea are uncommon, but they do happen and have long been viewed as a major accident risk for ships on the water. One cause of ship blackouts is contaminated fuel that can create problems with its main power generators, said Fotis Pagoulatos, a naval architect. He said a complete blackout could result in a ship losing propulsion and that smaller generators can kick in, but they are unable to carry all the functions of the main ones and take time to start.
The Wall Street Journal reports that “The owner of the Domino Sugar refinery at Baltimore’s port says the plant has six to eight weeks of raw sugar stockpiled at the facility and that it expects no short-term disruptions to its operations from the bridge collapse blocking the mouth of the harbor. The refinery, which boasts the last working smokestack on Baltimore’s increasingly residential waterfront, began operations in 1922. A spokeswoman for Domino owner ASR Group said a ship is currently unloading raw sugar at the refinery’s dock and another ship finished unloading on Monday.”
Natural gas continues to be one of the cheapest hydrocarbons on the planet. It’s good news for the industry that the Cove Point LNG export terminal is still operational because they really can’t afford to see anymore export terminals shutdown. The truth is that natural gas continues to be a bridge fuel for any energy transition and maybe that reality is starting to dawn on people. Even people in places like Berkeley CA..
The AP reports that, “The city of Berkeley, California, has agreed to halt enforcement of a ban on natural gas piping in new homes and buildings that was successfully opposed in court by the California Restaurant Association, the organization said. The settlement follows the 9th U.S. Circuit Court of Appeals’ refusal to reconsider a 2023 ruling that the ban violates federal law that gives the U.S. government the authority to set energy-efficiency standards for appliances, the association said in a statement last week. “While the Ninth Circuit’s ruling renders this particular ordinance unenforceable, Berkeley will continue to be a leader in climate action,” Berkeley City Attorney Farimah Faiz Brown said in an email to The Associated Press.
Read Full Story »»»
DiscoverGold
Natural Gas Bullish Weekly Reversal Signals Strong Potential for Higher Targets
By: Bruce Powers | March 26, 2024
• Natural gas shows bullish signs with a reversal above key levels, indicating potential for higher targets, first around 1.95 to 2.01.
A bullish reversal triggered today in natural gas as it got back above the 20-Day MA line (purple) and above the most recent interim swing high of 1.77. Further, a weekly bullish reversal was also triggered as last week’s high of 1.77 was exceeded to the upside. If natural gas can stay above the 20-Day line, currently at 1.77, it has a chance to test higher target levels.

Next Target Zone is 1.95 to 2.01
The next higher target zone looks to be around 1.95 to 2.01. That price zone includes the prior bottom of the downtrend at 1.95, please the 50-Day MA (orange), and the bottom of the descending trend channel (blue dash). In addition, the top of the range is from the most recent swing high on March 5. That high is now the neckline of a potential double bottom bullish reversal pattern. If Monday’s low of 1.59 continues to be the low of the most recent retracement, natural gas should continue to advance from that low.
Rising ABCD Pattern Symmetry at 2.08
A rising ABCD pattern hits its first target at 2.08 and identifies that price level as a key pivot. Either resistance is seen there, as it marks the point of symmetry between the two legs of the pattern, or buyers remain in control and there is a breakout through that price zone. If a breakout occurs, the next higher price zone is 2.17, the bottom boundary of a prior gap.
Of course, an advance above 2.17 puts the price of natural gas into the gap and increases the chance it might eventually fill. The second target from the ABCD pattern is at 2.21. It is derived by applying the 127.2% Fibonacci ratio to the AB leg of the pattern and then that new price distance is applied to the C point to identify a D target.
Potential Double Bottom
As noted above, a potential double bottom has now formed on the chart. A decisive rally above the mid-point at 2.01 triggers a pattern breakout. By taking the height of the pattern in price and adding it to the neckline, a target of 2.50 is calculated from the double bottom.
Read Full Story »»»
DiscoverGold
Roasted Chickens. The Energy Report
By: Phil Flynn | March 26, 2024
You all know that old saying that ‘the chickens come home to roost’ is sadly taking part in the global oil market and the scariest thing is there is not a lot of bearish news anywhere you look. Just a lot of chickens or roosters – whatever. The seasonal gas price rise along with declining global inventory and reduced refining capacity has AAA calling for gas prices to hit $4.00 a gallon this summer, the highest level since 2022.
This comes as Russia showed its commitment to OPEC production cuts as Vladimir Putin laid down the gauntlet to the Russian oil producers decreeing that they have to reduce oil output to 9 million barrels a day by the end of June. Knowing Putin, they better comply if they know what’s good for them. OPEC also announced that they would continue with their production levels and will confirm that at their April 3rd meeting.
This comes with reports about falling US oil output and conflicting predictions on whether the heavy-handed regulatory environment is going to cause a drop in future US oil production. Regardless, the Biden Team must be starting to worry as they are running out of options to cool off red-hot pump prices. Instead of dealing with reality, they doubled down on their job-killing and environmental electric car push based on political ideology and not on science.
So, Biden’s plan to refill the strategic reserve at $67.00 a barrel to $70.00 a barrel is starting to unwind and for strictly political purposes Biden may have to tap the reserve again to try to save his presidency. Under Biden, Iranian oil production has hit record highs and he’s turning a blind eye to Venezuelan oil sanctions that he lifted in return for what was supposed to be a free and fair election that never happened. Still this morning Bloomberg reports that India may cut purchases of Venezuelan oil ahead of the Biden waiver that expires on April 18th and is probably good news for Russia.
While the US energy industry has squeezed more blood out of every oil rig, there are more questions about whether the techniques that the producers have used in the shale patch are going to start giving us diminishing returns. Goldman Sachs came out with a report suggesting that U.S. oil production had declined by 400,000 barrels a day since December to 12.6 million barrels a day. This number doesn’t agree with the headline number from the Energy Information Administration (EIA) which they have already started to revise downward.
Yet Macquarie Group Ltd. is once again betting on the ingenuity of the US oil and gas industry to overcome obstacles. Macquarie is predicting that US energy production will hit 14.5 million barrels a day as falling costs and improved drilling efficiency overshadow subdued growth plans from publicly listed companies. That’s higher than EIA’s call for 13.2 million barrels a day. Macquarie stood out among analysts last year with its projection of increased US shale production and ultimately was proved correct. Its latest forecast comes as shale oil explorers are vowing to rein in production growth for a fourth straight year and consolidation in the industry presents headwinds to further growth. The US government expects production to edge up to 13.2 million barrels a day this year.
The devastating and heartbreaking news of the cargo ship hitting the Francis Scott key bridge in the port of Baltimore could have ramifications for a lot of commodities today. The Port of Baltimore is the second-largest port in the United States for coal exports, shipping about one-fifth of the country’s coal exports. In 2023, the port’s top export destinations were Australia, India, Belgium, Japan, and the Netherlands. Our prayers are for all of those involved in this horrific event.
What’s so much bullish news the market may need to take a breath. Inventories today in the Energy Information Administration aren’t expected to be overly bullish. We are looking for slight draws across the board. Some people think that the report has to make up for under-reporting drawdowns last week. We shall see but guesses are all over the board. The thing to remember is that even if we get builds in supply, we’re still below and behind the 8 ball heading into the summer driving season.
The attacks on Russian refineries caused the diesel crack to outperform gasoline but it’s going to be a cat and mouse game as refiners have to decide what type of product they’re going to need to meet demand. In the meantime, the possibility of a gasoline price spike continuing is very very high and while AAA is looking for $4.00 this summer, it could go higher if we see any supply disruptions around the globe. Hedge funds are starting to embrace the long side of the market after fighting this market every step of the way. We’re afraid that the prices are going to have some making up to do as it seemed to ignore bullish fundamentals in the past and now we will have to pay the price in the future for that lack of vision.
Yet now according to John Kemp, the oil market has seen a frenzy of hedge fund buying. He wrote that, “LONDON, March 25 (Reuters) – Investors have purchased oil at the fastest rate for more than four years, amid optimism that Saudi Arabia and its OPEC? allies will continue to restrict production while an improving economic outlook boosts consumption.
Ukraine’s drone attacks on oil refineries and export terminals in Russia, which threaten to disrupt production and exports of both crude and fuels, have turbocharged the shift in sentiment to more bullishness. Over the seven days ending on March 19, hedge funds and other money managers purchased the equivalent of 140 million barrels in the six most important futures and options contracts linked to petroleum prices.
The buying was the fastest since December 2019, and among the ten fastest weeks since records began in 2013, according to position reports filed with exchanges and regulators.
Another bad day for natural gas prices and US producers. The Freeport LNG export terminal being down for extended maintenance and other maintenance issues is going to increase the glut of natural gas. We still want to short on the front end. We expect to see more production cutbacks in the natural gas space. Do you think that there’s any chance that the Biden administration will provide a bailout for the US natural gas industry. I doubt it.
Read Full Story »»»
DiscoverGold
Natural Gas Continues to Build a Base
By: Christopher Lewis | March 25, 2024
• The natural gas markets fell slightly during the early hours on Monday, but then turned around to bounce back. This suggests that we are still building a massive base pattern.
Natural Gas Technical Analysis
Natural gas initially fell during the trading session on Monday, but it does look like we are trying to turn around and bounce a bit. Ultimately, the $1.50 level underneath, I think, continues to be a major floor in the market that you need to pay attention to. And of course, we have the 20 day EMA above offering a little bit of resistance that people will be watching as well. Ultimately, I think this is a scenario that eventually we do rally, probably to the $2 level initially. There is a major floor at $1.50 going back multiple years, and an area that has a lot of drillers thinking about bankruptcy and walking away from the fields. This could bring down supply, eventually. However, it could take time for that to show up in the price charts.
So, I do think that if you are looking for an investment, this might be a decent market to be involved in. But I would put an accent on the word investment due to the fact that it is not going to move quickly, and you may see quite a bit of volatility. The last thing you want to do is have a massive amount of leverage in this position as it can jump back and forth. In general, I think this is a situation where if you can find low leverage or an ETF like I trade, then it’s a nice investment for probably the rest of the year. You will have the occasional shakeout, but if we can break above the $2 level, then we could start to pick up momentum to $2.50.
Read Full Story »»»
DiscoverGold
Oil Continues to Find Support Just Below
By: Christopher Lewis | March 25, 2024
• The oil markets have recently been bullish, but the last couple of sessions have been more about finding stabilization after a massive breakout.
WTI Crude Oil Technical Analysis
The West Texas Intermediate market bounced ever so slightly during the early hours on Monday as the $80 level continues to be of importance. Furthermore, we need to pay close attention to the moving averages underneath, forming the so-called golden cross as the 50-day EMA gets ready to break above the 200-day EMA. In general, this is a market that I do like, and I think cyclically speaking, it’s a good trade to have on. After all, demand does pick up this time of year, and of course, we have a lot of geopolitical concerns. Breaking above that $80 level was crucial for attitude as well. So, I think we’ve got a shot of this market truly taking off to the upside. I like buying pullbacks, and I think $85 is your next target.
Brent Crude Oil Technical Analysis
Brent markets look very similar, with $84.50 being the support underneath. If we can break out to the upside, the $90 level will be the target, and I think we could get there over the course of the next couple of months. I don’t necessarily think that the market is going to shoot straight up in the air, but I do recognize that we have a scenario where the market is very bullish overall, and now we are doing that pullback to a breakout kind of thing that a lot of markets will do.
I look for short-term drops to pick up, and I have no interest whatsoever in shorting this market. All things considered, I believe this is a market that should continue to go higher over the next several months, and I plan on being involved to the upside in both grades of oil.
Read Full Story »»»
DiscoverGold
Bases Loaded. The Energy Report
By: Phil Flynn | March 25, 2024
Oil prices are building a base over $80 a barrel as global supplies tighten, the US rig count falls and geopolitical risk rises. The energy gloves are off as Russia retaliates from Ukraine’s attacks on their oil refineries by attacking Ukraine with hypersonic missiles on their energy infrastructure. Reports say as much as 25% of Russia’s refining capacity could be shut down at a time when global supplies of diesel and gasoline are below average for this time of year.
This comes after the horrific Friday terror attack on a concert hall near Moscow that Russia blames on Ukraine, but it appears it was an attack by a rejuvenated ISIS. Russia lashed out with aggressive attacks on Ukraine’s energy infrastructure. Russia attacked critical infrastructure in Ukraine’s western region of Lviv with missiles early on Sunday, Kyiv said, in a major air strike that saw one Russian cruise missile briefly fly into Polish airspace, according to Warsaw as reported by Reuters.
Reports say as much as 25% of Russia’s refining capacity could be shut down at a time when the global supplies of diesel and gasoline are below average for this time of year. Reuters reported that Russian oil refining capacity that was shut down in the first quarter due to Ukrainian drone attacks on at least seven refineries amounts to about 4.6 million tons (370,500 barrels per day), or some 7% of the total, Reuters calculations show, on top of maintenance related to other causes. The United States has urged Ukraine to halt drone strikes on Russian energy infrastructure, warning they risk provoking retaliation and driving up global oil prices, the Financial Times reported on Friday, citing people familiar with the matter. Russia’s oil refining production forecast for 2024 remains unchanged and close to last year’s level of around 5.5 million barrels per day, Energy Minister Nikolai Shulginov said on Wednesday.
While things heat up between Russia and Ukraine, the Red Sea attack risks are still high even as Israel reportedly gave a proposal to Hamas for a ceasefire that could allow for the release of 40 hostages held by Hamas. This comes as Israel attacks the hospital hideout of the Hamas terrorists who used hospitals as a shield.
Oil Price reported that the total number of active drilling rigs for oil and gas in the United States fell by 5 this week, according to new data that Baker Hughes published on Friday, bringing the total rigs gained this year to just 2. The total rig count fell by 5 to 624 this week, compared to 758 rigs this same time last year. The number of oil rigs fell by 1 this week after seeing a gain of 6 in the week prior. Oil rigs now stand at 509–down by 84 compared to this time last year. The number of gas rigs also fell this week, by 4 to 112, a loss of 50 active gas rigs from this time last year. Miscellaneous rigs stayed the same at 3.
Natural gas prices are trying to find a bottom and there is some criticism of natural gas producers that they didn’t react fast enough to the warm temperatures and the lack of demand thereby creating a glut. But maybe it’s possible that natural gas producers are going to get smarter in the future with the use of artificial intelligence. Last week reports said that EQT the country’s largest natural gas producer announced a deal to buy pipeline equations and streams according to Barrons. They wrote that artificial intelligence is the hottest theme in investing right now, and its growth could boost even the prospects of the latest major energy deal. EQT, the country’s largest natural gas producer, announced a deal on Monday to buy pipeline company Equitrans Midstream. The $35 billion merger will create a behemoth that controls nearly every step from getting natural gas out of the ground to delivering it to customers. Shares of EQT were down 8% on Monday, partly because it will be taking on billions of dollars in Equitrans’ debt. Equitrans shares were up 2.7%. EQT says it can pay down the debt quickly. Executives also highlighted the growth possibilities from the deal. EQT CEO Toby Rice said on a conference call after the acquisition was announced that the growth in demand from data centers used to run AI applications could boost the fortunes of the most important pipeline that EQT is buying.
Read Full Story »»»
DiscoverGold
$CRB #Commodities - Update. Striving to push on up from that Bull 'Pennant'...
By: Sahara | March 25, 2024
• $CRB #Commodities - Update.
Striving to push on up from that Bull 'Pennant'...

Read Full Story »»»
DiscoverGold
WTI Crude Oil CoT: Peek Into Future Through Futures, How Hedge Funds Are Positioned
By: Hedgopia | March 23, 2024
• Following futures positions of non-commercials are as of March 19, 2024.
WTI crude oil: Currently net long 337.1k, up 54.6k.

West Texas Intermediate crude formed a potentially bearish candle at crucial resistance. A weekly gravestone doji showed up this week. Tuesday, the crude tagged $83.12, which, if stuck, would have easily cleared resistance at $81-$82. For a year and a half now, WTI has played ping pong between $71-$72 and $81-$82. By Friday, the range would stay, as the crude gave back the intra-week gains to only edge up 0.1 percent to $80.63/barrel.
The path of least resistance for now is lower crude prices.
In the meantime, as per the EIA, US crude production in the week to March 15th was unchanged week-over-week at 13.1 million barrels per day; until three weeks ago, output was at a record 13.3 mb/d. Crude imports increased 787,000 b/d to 6.3 mb/d. As did stocks of distillates, which grew 624,000 barrels to 118.5 million barrels. Inventory of crude and gasoline, however, decreased two million barrels and 3.3 million barrels respectively to 445 million barrels and 230.8 million barrels. Refinery utilization increased one percentage point to 87.8 percent.
Read Full Story »»»
DiscoverGold
NY Crude Oil Futures »» Weekly Summary Analysis
By: Marty Armstrong | March 23, 2024
NY Crude Oil Futures closed today at 8063 and is trading up about 12% for the year from last year's settlement of 7165. At present, this market has been rising for 2 months going into March reflecting that this has been only still, a bullish reactionary trend. As we stand right now, this market has made a new high exceeding the previous month's high reaching thus far 8312 while it has not broken last month's low so far of 7141. Nevertheless, this market is still trading above last month's high of 7962.
Up to now, we still have only a 2 month reaction rally from the low established during December 2023. We must exceed the 3 month mark in order to imply that a trend is developing.
ECONOMIC CONFIDENCE MODEL CORRELATION
Here in NY Crude Oil Futures, we do find that this particular market has correlated with our Economic Confidence Model in the past. The Last turning point on the ECM cycle low to line up with this market was 2020 and 2009 and 2001 and 1998 and 1994. The Last turning point on the ECM cycle high to line up with this market was 2022 and 2018 and 2011 and 2000.
MARKET OVERVIEW
NEAR-TERM OUTLOOK
The historical broader tone of the NY Crude Oil Futures has been a bearish consolidation following the high established back in 2008. Since then, this market has created 2 reaction highs which have been unable to break this overall protracted bearish consolidating trend. Still, the major low was made in 2023 and the market has bounced back for the last year. The last Yearly Reversal to be elected was a Bullish at the close of 2023.
This market remains in a positive position on the weekly to yearly levels of our indicating models. Nevertheless, it closed last year on the weak side down from 2022. Pay attention to the Monthly level for any serious change in long-term trend ahead.
From a perspective using the indicating ranges on the Daily level in the NY Crude Oil Futures, this market remains moderately bearish position at this time with the overhead resistance beginning at 8067 and support forming below at 7957. The market is trading closer to the resistance level at this time. An opening above this level in the next session will imply that a bounce is unfolding.
On the weekly level, the last important high was established the week of March 18th at 8312, which was up 14 weeks from the low made back during the week of December 11th. So far, this week is trading within last week's range of 8312 to 8030. Nevertheless, the market is still trading downward more toward support than resistance. A closing beneath last week's low would be a technical signal for a correction to retest support.
When we look deeply into the underlying tone of this immediate market, we see it is currently still in a semi neutral posture despite declining from the previous high at 8312 made 0 week ago. Still, this market is within our trading envelope which spans between 6295 and 8977. The broader perspective, this current rally into the week of March 18th reaching 8312 has exceeded the previous high of 7960 made back during the week of November 27th. Right now, the market is neutral on our weekly Momentum Models warning we have overhead resistance forming and support in the general vacinity of 7584. Additional support is to be found at 7141. Looking at this from a wider perspective, this market has been trading up for the past 14 weeks overall.
INTERMEDIATE-TERM OUTLOOK
YEARLY MOMENTUM MODEL INDICATOR
Our Momentum Models are declining at this time with the previous high made 2021 while the last low formed on 2023. However, this market has declined in price with the last cyclical low formed on 2023 warning that this market remains weak at this time on a correlation perspective declining in both price and Momentum.
Looking at the longer-term monthly level, we did see that the market made a high in September 2023 at 9503. After a four month rally from the previous low of 8346, it made last high in September. Since this last high, the market has corrected for four months. However, this market has held important support last month. So far here in March, this market has held above last month's low of 7141 reaching 7141.
Some caution is necessary since the last high 9503 was important given we did obtain one sell signal from that event established during September 2023. That high was still lower than the previous high established at 12368 back during June 2022. Critical support still underlies this market at 6700 and a break of that level on a monthly closing basis would warn of a further decline ahead becomes possible. Nevertheless, at this time, the market is still weak.
DiscoverGold
Signs of Weakness Emerge on Natural Gas
By: Bruce Powers | March 22, 2024
• Natural gas prices show weakness, consolidating within a range. Resistance at 8-Day MA suggests a market shift. Key support at 1.64 holds for now, but a failure could trigger a downtrend.
Natural gas remains in a consolidation range that is starting to show further signs of weakness. Up until Wednesday natural gas was consistently running into resistance around the 20-Day MA. Then, on Thursday resistance was seen near the shorter 8-Day MA, which is more sensitive to price movements. This relationship reflects a weakening market.

Declining ABCD Pattern Points to 1.64
Nonetheless, the price of natural gas remains above the key near-term support level at 1.64. That price level is a swing low that is potentially part of the developing uptrend price structure of higher swing lows. If it fails to hold then natural gas would be moving into a declining ABCD pattern in the short-term (see chart). An early downside target of 1.55 is identified as it completes 61.8% of the price decline seen in the first AB leg down. Similarly, using the 78.6% Fibonacci ratio arrives at 1.49, which happens to match a second Fibonacci extension price. A 127.2% extension of the full advance up from the prior trend low hit in April 2023, is also 1.49. Both a short and long-term Fibonacci measurement points to the same price target.
Fibonacci Says 1.49
We could see an undercut and run strategy set up if the 1.49 level is reached. It is under the most recent trend low of 1.52 and above the historical low of 1.44. It would be a perfect spot to see a bullish reversal once stops get hit from the decline below 1.52. Two Fibonacci levels lining perfectly like that is the market telling us to pay attention. An undercut and run strategy first looks for a continuation of the dominant near-term trend, which takes out weak holders and triggers stops. If price quickly reverses (relative) and closes above the prior trend low, it gives a strong bullish signal. Keep in mind that this is an aggressive strategy.
Weekly Price Levels
In the near-term, if the 1.64 level is broken and the price of natural gas continues to decline. Note that such a drop would also trigger a bearish continuation on the weekly chart. The four-week low of 1.59 would then provide the next lower target in the weekly time frame.
Read Full Story »»»
DiscoverGold
Natural Gas Continues to Build a Base
By: Christopher Lewis | March 22, 2024
• The natural gas markets will continue to bounce around going forward, as the markets are trying to do everything, they can to find some kind of bottom.
Natural Gas Weekly Technical Analysis
We continue to meander around the bottom in this market. I believe that natural gas is in the midst of a base building pattern, but this could take the better part of three months, maybe even longer than that. The main reason being is the market is extraordinarily cyclical, and this is typically the weakest time of year, we might get the occasional last ditch winter storm in the United States, or maybe we get a heat wave in the middle of summer that could drive up natural gas demand, but as things stand right now, we have plenty of supply out there. And quite frankly, we’re at the point where drillers are starting to discuss walking away from the field.
That could cause a bit of upward pressure later this year, but there is so much natural gas and storage that the only way to play this from the long side, and I am doing just that, is through an ETF and just ignore it for a while. It’s just something that is going to be able to be bought into and then cashed out later this year, possibly even as late as November. So, keep that in mind.
Short-term trading is almost non-existent. Long-term trading is going to have to be investing because eventually things will turn around. As drillers step away, they will plunge supply, but we’re nowhere near that right now. There are still a lot of companies out there doing everything they can to hang on. I think a good move later this year might be to the $3 level.
We’ll see, I’m not expecting anything above that, but again, I am invested through ETFs, so the day-to-day fluctuations really don’t affect me, and that’s the only way you can stay in this market, unless you have a tiny CFD position, but make sure you pay attention to any rollover charges at the end of each session.
Read Full Story »»»
DiscoverGold
Crude Oil Continues to See Upward Pressures
By: Christopher Lewis | March 22, 2024
• The crude oil markets continue to see a lot of bullish pressure, and as a result we are likely to see a lot of buying on dips, just as we have on Friday.
WTI Crude Oil Weekly Technical Analysis
The WTI crude oil market initially surged during the course of the week but gave back quite a bit of the gains after the breakout. Ultimately, it is worth noting that the Friday candlestick looks like it’s going to be somewhat supportive, so I don’t know that this exhaustion candlestick shows anything other than a potential short-term pullback, and I do believe the traders will be paying close attention to it.
The $80 level, of course, has a certain amount of psychology attached to it, and it does make sense that we’ve seen buyers jump in on short-term charts, just as we saw buyers chase the market above the $80 level last week. I think at this point in time, the target is going to be $85, but oil is going to be very volatile.
And that does make a certain amount of sense. After all, there are a lot of geopolitical concerns out there, and I think you’ve got a situation where you have to look at this through the prism of perhaps trying to find value. When you look at the weekly chart, you can see that we have formed a massive double bottom, and now that we are heading into a cyclically strong time of year, I don’t see any reason why this doesn’t mean something bigger.
Brent Crude Oil Weekly Technical Analysis
Brent looks very much the same, initially rallying during the week and then pulling back towards that $84.50 level that I’ve been talking about for a while. Nonetheless, it looks like Friday is a recovery day, so I think Brent has a real shot at going to the $90 level given enough time.
Short-term pull backs continue to be buying opportunities, the 50-week EMA underneath could be support, and Brent has all of the same fundamental drivers that WTI Crude Oil does and on top of that, there’s even more geopolitical concern when it comes to Brent. Ultimately, I do think that we are heading into a very bullish time of year, and we are about to see that play out in the crude oil markets.
Read Full Story »»»
DiscoverGold
False Peaks. The Energy Report
By: Phil Flynn | March 22, 2024
Whether it’s peak oil production or peak oil demand, it appears the peak theories have once again come crashing back to the market-based realities. Twenty years ago or so, I used to give presentations explaining to a skeptical crowd that the world was not going to run out of oil in the near term or even the long term. The simple explanation was that high prices would cure high prices and when they got high enough, they would find plenty of oil. This so-called finite resource would eventually be found on land and sea in places yet undiscovered. Besides 71% of the earth’s surface is covered by water so there is still plenty of oil discoveries to be made when the price is just right. That’s on top of the 1.56 trillion barrels of proved crude oil reserves, excluding oil sands that we already know about.
Of course, in the last couple of years, the so-called peak freaks have reversed course in predicting that global demand has already peaked and that we would see demand for crude oil start to fall as the world moved to more unreliable forms of alternative energy and started to drive electric cars that would be powered by alternative clean energy source or perhaps fairy dust. Yet despite spending untold trillions of dollars to force us out of our internal combustion engines and try to force investment out of fossil fuels, oil demand will hit an all-time high next month.
Yesterday it was the Energy Information Administration (EIA) that had to increase its price projections for crude oil and petroleum products for the remainder of 2024. They also had to lower their forecast for world oil production in the second quarter of 2024 (2Q24) to 101.3 million barrels per day (b/d) in March. While the EIA blames the extension of the OPEC production cuts for the reason for the change, the reality is that it was clear to most market watchers that OPEC would stay the course and extend cuts even when their last report was released. The EIA also predicts a global supply versus demand deficit, which the Energy Report has been predicting all along. The EIA says that, “the draw on global oil stocks during 2024 will keep Brent crude oil prices elevated, averaging $88/b in 2Q24, $4/b higher than we had forecast in the February STEO. Prices will remain relatively flat for the rest of the year before falling to $82/b by the end of 2025 as OPEC+ supply cuts expire and production increases.”
Yet OPEC cuts or no OPEC cuts, what this report tells you is that the only spare oil production capacity of note in the world is in the OPEC cartel. What that means is that traders buffer against supply shocks in a world where global demand is going to be at record highs has to be at one of the lowest levels in history. That increases the possibility of sudden and violent price spikes if we see a major outage or disruption.
The EIA acknowledges the geopolitical risk factors as a wild card that could spike prices. They point out that, “No crude oil or product tankers have been lost because of the ongoing attacks on commercial shipping in the Red Sea, but many ships are rerouting to avoid the area. Rerouting lengthens the trip and increases costs. Attacks continue to threaten ships that transit the Red Sea, which could increase prices further.
They also warn that, “Stronger demand growth than our forecast would reduce global stocks and raise oil prices, just as less demand growth would increase global stocks and reduce prices.” Now if you look at the fact that both the EIA and the International Energy Agency have underestimated demand, this becomes a real market risk. That is especially true after the Fed seemed intent on its path to cutting interest rates.
The EIA also had to raise their gasoline price forecast as well by $0.20 a gallon for June, July and August from their last estimate as they forecast driving activity—measured by vehicle miles traveled (VMT)—will increase to all-time highs in the United States during 2024 and 2025.”
Yet at the same time, they seem to pin their hopes that Biden’s electric car push will keep gas prices under control. They say that, “Despite our forecast of more driving, increased fleetwide vehicle fuel efficiency will keep motor gasoline consumption relatively flat through 2025.” Good luck with that.
So now if you look at West TX intermediate oil, a few weeks ago it was a battle to get above $80 and now it’s a battle to stay above $80. Technically the market looks ripe for a correction. It also looks like it’s consolidating, potentially setting the stage for another major upside price move. It is possible that this is going to be a staging area for a move up towards $85 and eventually testing $90.00 a barrel. Some technical analysts are pointing to the golden cross formation. Blomberg reported that the WTI crude oil approaching a Golden Cross formation with a cross of the 50-day and 200-day moving average. The last Golden Cross signal saw oil soar to its highest prices since August/September 2022.
It’s getting harder to hide the looming global oil supply deficit. And while prices may be restrained on reports of a potential ceasefire deal between Israel and Hamas, the reality is that we’re going headlong into an oil shortage. You can’t blame OPEC completely because even if they pumped all out, the corresponding drop in price would lead to a demand surge that would push us to the brink without any spare capacity in the globe. In some ways, OPEC is showing the world a favor by keeping some barrels in reserve and keeping prices elevated because without that, we could see prices spike even higher. If you look back at it the major failure that has led us to the brink of a potential price spike has been the misguided policies of the ESG movement and the green energy movement. The government can inspire us to move in one direction or another but it has to be based on reality and market-based fundamentals.
While the diesel crack collapsed, the gasoline crack seemed to be heating up. And with the real possibility of a supply deficit building, that should keep refiners busy. The FT is reporting that the Biden Whitehouse is telling Ukraine to stop attack Russian oil facilities. The FT says that “The repeated warnings from Washington were delivered to senior officials at Ukraine’s state security service, the SBU, and its military intelligence directorate, known as the GUR, the people told the Financial Times. Both intelligence units have steadily expanded their own drone programs to strike Russian targets on land, sea and in the air since the start of the Kremlin’s full-scale invasion in February 2022.
One person said that the White House had grown increasingly frustrated by brazen Ukrainian drone attacks that have struck oil refineries, terminals, depots and storage facilities across western Russia, hurting its oil production capacity.” Must read
Natural gas prices really can’t get a break. Even with the late winter blast the possibility of another Freeport LNG outage is weighing on the concerns of natural gas producers as it could create another glut especially if it is an extended outage. EBW analytics reports that although Henry Hub spot prices have rebounded on increased heating demand early this week, last week’s extreme weakness may be an early warning sign for the April contract ahead of next week’s final settlement. The storage surplus vs. the five-year average, after adding 525 Bcf since late January, may finally peak this week as extreme blowtorch weather dissipates. Still, even with weather-driven demand edging higher this week and potential Bakken freeze-offs into late March, it may take several weeks to gradually erode a North American storage surplus that has ballooned to 900 Bcf. While the long-term fundamental outlook is strengthening, it will require a prolonged period of low natural gas prices this spring to maintain price-induced power sector demand and incentivize producers to keep supply off the market.
Read Full Story »»»
DiscoverGold
Energy Daily Market Movers (% Price Change)
By: Energy | March 22, 2024
• Top Movers
AU - Queensland Base-Load Electricity Futures 0.59 %
• Bottom Movers
London IPE Gas Oil Futures 0.95 %
NSW Baseload Electricity Continuous 0.85 %
NY Heating Oil Futures 0.82 %
NY Natural Gas Futures 0.76 %
NYMEX RBOB Gasoline Futures 0.26 %
*Close from the last completed Daily
DiscoverGold
April also just-so-happens to be a KILLER month for $XLE over the last 20 years: 70% win rate and average return of +4.38%
By: TrendSpider | March 21, 2024
• April also just-so-happens to be a KILLER month for $XLE over the last 20 years:
70% win rate and average return of +4.38%

Read Full Story »»»
DiscoverGold
Natural Gas Downtrend is Clear but Rally Above This Week’s High is Bullish
By: Bruce Powers | March 21, 2024
• Despite recent weakness, natural gas shows potential for a bullish ABCD pattern, contingent on staying above 1.64.
Natural gas continued to weaken on Thursday, following a bearish day on Wednesday. It continues to respect the recent swing low support at 1.64 (C), however. If it continues to stay above that swing low there remains a chance for a rising ABCD pattern to follow through. It recently set up with that swing low but only if it continues to be a swing low. A drop below 1.64 would violate the pattern as point C would move to a new swing low, whenever that occurs. And only if the price of natural gas stays above the latest trend low at 1.52 (A).

Stuck in Consolidation Range from 1.64 to 1.77
The last five days of trading occurred within a consolidation range defined by the high and low levels seen on March 14 and 15. It shows a range from 1.64 to 1.77. Today would have been a perfect day for more serious selling to occur following Wednesday’s decline and break below the prior day’s low. if it was going to do so eventually, this would be the day. Instead, natural gas fell below yesterday’s low to 1.65, where it found support and rallied. It continues to advance towards the open at the time of this writing.
Today’s Range Provides Near Term Price Levels
Today’s high and low provide price levels to use to identify the next direction for natural gas. If the high of 1.77 is exceeded there is a chance it will continue to strengthen, at least towards the top of the range. The low today is 1.65. If that price level fails to maintain support the chance for a test and possible decline below the recent swing low of 1.64.
Recent Price Action Rallying into Resistance is Bearish Behavior
As discussed previously, natural gas is in a clear downtrend in all time frames. Since it failed to rally above resistance at 2.01 recently, the chance for a bearish continuation remains a real possibility. That price zone previously represented support. So, support becomes resistance, which is a sign that downtrend is showing signs of continuing. Further, the 20-Day MA failed to maintain support on March 12, and it has marked resistance on each of the past five days.
Advance Above 1.77 is Bullish
Sometimes when a pattern is very clear, the opposite of what is expected occurs. That may or may not happen in this case. The market is clearly showing bearish signs but that changes in the short term on a rally above this week’s high of 1.77, assuming that is the high for the week.
Read Full Story »»»
DiscoverGold
Energy Daily Market Movers (% Price Change)
By: Marty Armstrong | March 21, 2024
• Top Movers
AU - Queensland Base-Load Electricity Futures 0.74 %
AU - Victoria Base-Load Electricity Futures 0.69 %
• Bottom Movers
NY Natural Gas Futures 2.58 %
London IPE Gas Oil Futures 2.47 %
NY Heating Oil Futures 2.13 %
NY Crude Oil Futures 1.76 %
London IPE Brent Crude Spot 1.64 %
*Close from the last completed Daily
DiscoverGold
Natural Gas Critical Resistance at 20-Day MA Leads to Selloff
By: Bruce Powers | March 20, 2024
• Natural gas faces resistance at 20-Day MA after five days of failed rallies, indicating a possible shift to bearish momentum.
There have been five consecutive days of rallies into resistance around the 20-Day MA and each time price has been rejected to the downside. Today is the fifth but with one important difference relative to the previous three days. Trading has occurred below yesterday’s low, and natural gas is on track to close below that low, which was 1.70. This would indicate greater weakness than what was seen in the past couple of days when the lows were above the prior day’s low and the close was green, above the open.

Sellers Back in Control
Today’s drop indicates that the sellers are back in control. After five days of failing to break through the 20-Day line supply became more aggressive, driving prices lower. That is a change in character from recent days. If it can’t go up, then down or sideways are the two choices. It has been going sideways but today indicates maybe a further decline may be forthcoming. The 8-Day MA crossed below the 20-Day three days ago and it continues to be pointing down.
Depending on what happens next, as today is only one day, if the selling pressure continues the recent 1.64 low may be at risk of being busted. If it does fail to hold as support, the 78.6% Fibonacci retracement level is at 1.63. Weekly support could be seen around 1.64, which was last week’s low.
Increasing Chance of Bearish Continuation
All the signs are there for a possible bearish continuation of the trend. There is a clear downtrend in both the near and long-term price structure and natural gas is below all its moving averages from the 12-Day and up. However, it is sitting at a long-term support zone that includes the lowest traded prices in 28 years. The lowest price of the range is 1.44. It therefore becomes likely that support and a bullish reversal would be seen above that low price.
Recent price action may end up being part of a bottoming process given the significance of the support zone. If that turns out to be the case, the first thing that should happen is a rally above the six-day high of 1.77, followed by a daily close above it. After that the price of natural gas may head higher.
Read Full Story »»»
DiscoverGold
Prices Stabilize as Colder Weather Spurs Increased Demand
By: James Hyerczyk | March 20, 2024
Key Points:
• Colder weather forecasts elevate natural gas demand after weeks of decline.
• U.S. natural gas production falls, with significant drop in February.
• Potential Freeport LNG train restart may boost demand and prices.
U.S. Natural Gas Market Overview
U.S. natural gas futures remained stable on Wednesday, following a notable increase the day before. This rise was spurred by colder weather forecasts and an anticipated surge in heating demand.
At 12:34 GMT, US Natural Gas is trading $1.747, up $0.003 or +0.17%.
Weather Impact on Demand
Current weather patterns, characterized by colder temperatures in the northern U.S., are expected to drive moderate demand for natural gas over the next week. This shift comes after seven weeks of substantially lower-than-normal demand. The increased need for heating due to cooler weather in the north and central U.S. through March’s end is set to intensify demand. However, this may be somewhat mitigated by a strong upcoming performance in wind energy generation.
Production and Supply Trends
A key factor supporting futures is the continued decline in U.S. gas output, which dipped to a three-and-a-half-year low in February. This decrease is linked to collapsed gas prices and reduced drilling activities by major energy firms. Additionally, the potential resumption of operations at one of Freeport LNG’s liquefaction trains in Texas is expected to heighten demand, further influencing prices.
Storage and Price Fluctuations
Natural gas stockpiles are currently estimated to be about 40% above typical levels, a result of near-record output and reduced winter demand. The low prices experienced recently are projected to drive record U.S. gas consumption in 2024, though they are also anticipated to curtail production for the first time since the 2020 COVID-19 pandemic.
Weather and Production Influencing Gas Futures
Looking ahead, the financial firm LSEG notes a decline in gas output in the lower 48 U.S. states for March. In contrast, gas demand, inclusive of exports, is forecasted to rise slightly. Analysts are monitoring the potential full return to service of Freeport LNG’s Texas plant, which could significantly impact U.S. LNG feedgas levels.
Market Forecast
In the short term, the U.S. natural gas market is leaning towards a bullish outlook. The confluence of rising demand due to cooler weather, a decrease in production, and the potential increase in LNG export capacity positions the market for an uptick in prices and demand. However, the strong performance in alternative energy sources like wind and the high levels of gas in storage could moderate these bullish trends.
Technical Analysis

Daily Natural Gas
U.S. Natural Gas futures are consolidating for a sixth session on Wednesday. The daily chart indicates the short-term trend could turn higher if the buying is strong enough to take out $1.774.
If the upside momentum shifts enough on the move, there is an outside chance of a strong surge into the 50-day moving average at $1.991. Although we expect sellers to re-emerge on a rally into this important moving average, the intermediate trend could turn up if it is taken out with conviction.
Read Full Story »»»
DiscoverGold
Oil Apprehension. The Energy Report
By: Phil Flynn | March 20, 2024
Oil apprehension is growing after the front month WTI hit the highest price since last October as expectations of supply deficit start to get priced in as more are predicting a potential peak in US oil production. Yet a not-so-bullish American Petroleum Institute (API) report and high anxiety ahead of today’s big FOMC meeting are causing a bit of a pullback in oil and a drop in diesel cracks is raising some demand concerns.
The API, while not bearish, did not live up to the whisper market expectations heading into the report. The API did show a larger-than-expected 1.519-million-barrel draw, but there was some talk of a much larger draw. We were looking for 3.0 million which may still happen in today’s Energy Information Administration (EIA) report at 9:30a central time but it might not matter if the Fed starts to back off rate cuts as the market has priced in. The API also reported a 1.574 million barrel drop in gasoline supply which is a much smaller drop than last week but not scary enough to drive the crack spread. The diesel crack is under pressure as the supply shortage has eased a bit with a slight increase of 512,000 barrel in the weekly API. John Kemp at Reuters pointed out that hedge funds started to cover positions with the combined position in U.S. diesel and European gas oil down to 55 million barrels from 87 million five weeks earlier.
In today’s EIA report there will be a focus on the demand numbers partly due to an adjustment in how the EIA counts production. The amount of production fell to 13.1 million barrels. Last week the EIA said that their crude oil production estimate incorporates a re-benchmarking that decreased estimated volumes by 177,000 barrels per day, which is about 1.3% of the production total. Yet in a world of growing demand and underinvestment in supply, the longer-term outlook for US energy production is going to become more critical.
S&P global reports that ConocoPhillips CEO Ryan Lance at the CERAWeek by S&P Global conference said U.S crude oil production growth in 2024 will likely drop to about 300,000-400,000 b/d in 2024, down from around 1 million b/d in 2023. S&P Global is also reporting that oil product stocks jumped to an 8-month high amid Ramadan. They put the Middle East crude runs to exceed 9 mil b/d for the first time. Total inventories are up 16% since end-2023. Stockpiles of oil products at the UAE’s Port of Fujairah jumped 10% to an eight-month high in the week ended March 18, with regional demand for some products typically slowing during Ramadan observations, according to the Fujairah Oil Industry Zone and historical data. Total inventories increased to 20.049 million barrels as of March 18, the highest since July 10, the FOIZ data published March 20 showed. Stockpiles have increased 16% since the end of 2023.
The Fed worries have slowed momentum, but the underlying outlook is bullish. After the Fed fallout, look for spots to buy.
Natural gas is headed towards a glut but in the big picture could natural gas hit $800. Bloomberg News reports that, “The chief of the largest US producer of natural gas has warned that a lack of pipelines and storage facilities will trigger dramatic price swings in the years ahead, causing them to surge as much 350%. He said, “Gas demand in the US has jumped 50% since 2010, while pipeline and storage capacity have increased just 25% and 10% respectively, EQT Corp. Chief Executive Officer Toby Rice said during an interview at the CERAWeek by S&P Global energy conference in Houston. That leaves the market prone to wild price swings, ranging from today’s level of about $1.75 per million British thermal units to as high as $8, Rice said. “This is the world we live in unless we get serious about getting more infrastructure built,” said Rice, whose company last week agreed to buy Mountain Valley Pipeline developer Equitrans Midstream Corp
Rice is a long-standing and vocal critic of the US regulatory framework and permitting process that he says holds up the construction of new pipeline infrastructure. In November, he warned that a pipeline crunch threatened to trigger an energy crisis. Rice also said in December that falling prices would lead to a slowdown in drilling and that prices were well below the break-even cost of production.
Read Full Story »»»
DiscoverGold
Natural Gas: Consolidation Continues, Watch for Breakout
By: Bruce Powers | March 19, 2024
• Natural gas remains in consolidation near resistance, with prices trading within a narrow range. A breakout above 1.77 could signal a bullish turn.
Natural gas remained in consolidation on Tuesday, as it once again tested resistance around the 20-Day MA (purple). It continues to trade within a five-day range with a high of 1.77 and a low of 1.64. Natural gas briefly advanced above the 20-Day line in late-February after being below it since mid-January. However, the current retracement took it back below the line last week, where it has remained.
Although there has been no continued selloff since then as consolidation has ruled, several successful tests of resistance at the 20-Day MA occurred recently and it reflects bearish price behavior. That would change with a decisive rally above 1.77. But until then, the chance for a bearish continuation remains.

Downtrend on Multiple Time Frames
As can be seen on the chart, natural gas is in a downtrend on multiple time frames. Highlighting the decline starting from the October 27 swing high of 3.64, a series of lower swing lows and highs can be seen on the chart with the most recent lower swing low occurring at the February 20 trend low. There was a brief high swing low generated on January 22, but that attempt to rally quickly faded and led to the most recent lower swing low. Last week’s low was a second attempt at a higher swing low, if it can be maintained.
Bulls Watch for 1.77 Breakout
A decisive breakout above the consolidation high at 1.77 prior to a drop below 1.64 will increase the chances for a higher swing low. This is important as the swing low forms the structure of the trend. One of the first signs that the trend might be attempting to turn up after being down for a while is the occurrence of a higher swing low.
A daily close above 1.77 would confirm that upside breakout and the higher swing low. Natural gas would then be heading towards the bottom zone of the declining blue dashed parallel trend channel. Resistance was seen in that area during the recent rally to the 2.01 peak (B). Next up is the 50-Day MA at 2.10. A simple rising ABCD pattern would complete close to that price level at 2.13.
Read Full Story »»»
DiscoverGold
Gas Demand Follies. The Energy Report
By: Phil Flynn | March 19, 2024
The first sign of spring is rising gasoline prices. Gasoline prices are surging as RBOB futures hit the highest level since last September on refinery outages and seasonal factors but also because the weak global gasoline demand narrative is filling up with reality. Gasoline demand in the United States is stronger than people had anticipated and if you listen to Exxon Mobil, global gasoline demand has never been better.
ExxonMobil says that global gasoline demand is through the roof and the electronic car movement hasn’t cut into global demand like people assume that it would. Even with all the money that we’ve spent trying to convince Americans to drive electric cars, it seems that that push is falling flat on its face. This of course is probably a good thing because let’s face it, the production of all those electronic vehicles adds to greenhouse gas emissions.
While there is no doubt that people are feeling the impact of higher gasoline prices, so far the demand for gasoline, if you look at the trends, is going to continue to stay strong. The good news for drivers is that the Whiting, IN BP refinery is reportedly back online. But we still have supply shortages around the globe everywhere you look. Refinery outages due to Ukrainian drone attacks in Russia are going to tighten global supply even more and the world will look to the United States to fill that void. I have said before the possibility for price spikes is extremely high when you have oil supplies that are heading into a global deficit and when you have product supplies below average throughout the world, the risk of higher prices and price spikes continues to be high.
Also, if you want to feel better, John Kemp at Reuters points out that gasoline prices were slightly below the average since the turn of the century last month, after adjusting for inflation. Nationwide pump prices (including taxes) averaged $3.33 per gallon in February 2024, which was in the 43rd percentile for all months since 2000 after adjusting for core inflation, explaining why fuel prices have been a political non-issue in recent months.
Today we’re going to get another weekly report from the American Petroleum Institute to find out just how tight supplies are becoming. We expect that we will see a drawdown of 3,000,000 barrels of crude oil this week. We should also see a similar drawdown in gasoline as well as distilled inventories. If that sounds bullish to you then you better hang on to your hat because some of the whisper numbers that we’re hearing from different sources suggest that we could see a crude oil drawdown of over 7 million barrels.
While oil prices may see a little bit of slowing momentum due to the rising dollar and fears about what the Fed may do on interest rates, the reality is that when it comes to supply versus demand I’m afraid we’ve already had the results baked in. Yes, it was historic that Japan raised its interest rates for the first time in 17 years but that was widely expected. If you look at the market action for oil today, it seems to be divorcing itself a little bit from some of the macroeconomic concerns that was driving oil over the last couple of months.
We are in a global supply crunch when it comes to everything petroleum. As we have been running for months, supplies are below average across the globe and now we’re starting to see the demand narrative unwind. This is why we’ve been recommending to be hedged for the long term and continue to recommend that.
Natural gas prices are getting a little bit of hope with a little blast of winter and hope it will see some production cutbacks. Still, negative pricing in some basins may put many producers out of business.
Gold prices have pulled back after its recent record-breaking run and silver. Peter Thomas Chairman at AUSECURE says, “After a week of continuous new highs in the gold market followed by a break triggered by the CPI this week started off very quietly with both the funds and the banks holding off trade as we all wait for the FOMC to be released. Gold spent most of the early trade lower on the day and then tremors out of Russia started after President Vladimir Putin warned NATO that he is fully prepared to use his nuclear weapons. Putin coined a new term not heard before in which he said “sanitary zone” between Ukraine and Russia. Gold rallied up to $6.00 higher on the day but drifted slowly lower over the midday trade. The attitude of the trading day felt neutral towards the close.
Read Full Story »»»
DiscoverGold
$WTIC $OIL - Into that 1st Target from the Inv Bull Plot...
By: Sahara | March 19, 2024
• $WTIC $OIL - Latest
Into that 1st Target from the Inv Bull Plot...

Read Full Story »»»
DiscoverGold
Energy Daily Market Movers (% Price Change)
By: Marty Armstrong | March 19, 2024
• Top Movers
NY Natural Gas Futures 2.9 %
NY Heating Oil Futures 2.4 %
London IPE Gas Oil Futures 2.15 %
NY Crude Oil Futures 1.96 %
London IPE Brent Crude Futures 1.82 %
• Bottom Movers
NSW Baseload Electricity Continuous 0.28 %
*Close from the last completed Daily
DiscoverGold
Shattered Ceilings. The Energy Report
By: Phil Flynn | March 18, 2024
Brent Crude traded over $86 a barrel posting a new high price for the year as bearish narratives around oil and demand and the fallacies of the energy transition have started to fall apart. The oil markets are starting to price the realities of an undersupplied market after the International Energy Agency had to admit that they were way off in its projection of oil demand and OPEC compliance should be improving with a major announcement by Iraq.
There are reports overnight that Iraq’s oil minister is going to reduce its crude oil exports by 3.3 million barrels a day in the coming months to absorb any increase in registered production that they made in January and February. In other words, they’re cutting back production to make up for the cheating that they’ve done previously.
This should offset the extra oil coming out of Russia because of the damage done to their refineries by the Ukrainian drones. Reports are saying that Russian oil exports from its western ports will be up by 10% to 2.15 million barrels a day. Reuters reports that long-range Ukrainian attack drones launched by the SBU domestic security service have hit 12 Russian oil refineries during the war so far, a Ukrainian intelligence source told Reuters on Sunday. Officials in the southern Russian region of Krasnodar said Ukrainian drones had attacked the Slavyansk oil refinery, 70km (45 miles) north of the regional capital, overnight. The Ukrainian source said the refinery, which processes about 4.5 million metric tons of crude a year and produces fuel mainly for exports, had been attacked in an operation staged by the SBU security service and other Ukrainian forces.
At the same time, the inability of the refineries to produce diesel is causing a surge in diesel prices. This morning we also saw a gasoline surge as well and the reports of weak demand were greatly exaggerated.
That means crack and diesel crack looks to be breaking out on the upside as the market is starting to realize that there’s going to be strong demand for both.
This comes on a week when the market must balance ongoing attacks in the Red Sea and how the rising cost of oil is going to impact the Fed’s plan to cut interest rates. Underneath the oil movement, oil stocks are gaining momentum as the ESG movement is facing the reality that it is contrary to sufficient reason. Decisions made by governments surrounding the green energy transition have made it almost impossible for the US to meet energy demand in the short term and long term.
Reuters reported that in February this year, the IEA predicted demand would rise by 1.22 million barrels per day (bpd) in 2024, while in its February report, OPEC expected 2.25 million bpd. The difference is about 1% of world demand. The difference between between the International Energy Agency and OPEC is a major problem the International Energy Agency is having a moment where they have to start to face up to the reality that the world is going to need a lot more fossil fuels than they have originally reported they have to get back to their mission of energy security from for Europe. The energy agencies and their bad predictions fed into the energy and security loss that we’ve seen in Europe.
Now that the market is starting to realize something that we have been warning about for some time, there is extreme risk to the upside. The globe is heading into a supply deficit and that means that we are still going to be very vulnerable to price spikes. Make sure you are hedged. As we mentioned before we thought there was huge value in energy stocks. ExxonMobil has outperformed the S&P 500 over recent months.
Can there be any hope for a natural gas rally? A surprise increase in rig counts is a head-scratcher. EBW Analytics reported that plunging natural gas prices cleared as low as $1.24/MMBtu last week as extremely mild temperatures nationally—more akin to late April than mid-March—slashed demand for natural gas and pulled the April contract lower to retest contract lows at $1.64/MMBtu. Still, a combination of technical support, weather adding 16 gHDDs over the weekend, supply stabilizing at low levels 3.5 Bcf/d below February highs, and peaking storage surpluses may all help the NYMEX front-month find support near-term and attempt to turn higher.
Read Full Story »»»
DiscoverGold
$WTI - Crude oil has reached the upper weekly BB and the 50% retracement of the September-December decline. The 24 week cycle high was due this week, so there's a high probability that it topped at 81.50. I expect a bearish reversal next week.
By: CyclesFan | March 16, 2024
• $WTI - Crude oil has reached the upper weekly BB and the 50% retracement of the September-December decline. The 24 week cycle high was due this week, so there's a high probability that it topped at 81.50. I expect a bearish reversal next week.

Read Full Story »»»
DiscoverGold
WTI Crude Oil CoT: Peek Into Future Through Futures, How Hedge Funds Are Positioned
By: Hedgopia | March 16, 2024
• Following futures positions of non-commercials are as of March 12, 2024.
WTI crude oil: Currently net long 282.5k, down 10.4k.

Oil bulls maintained their onslaught at the upper end of an 18-month range between $71-$72 and $81-$82. Intraday Thursday, West Texas Intermediate crude tagged $81.62 before retreating to end the week up 3.3 percent to $80.58/barrel.
From the bulls’ perspective, the good thing is that the crude has trended higher since bottoming at $67.71 last December. Thursday’s high was the highest since early November last year. WTI remains above both the 50- and 200-day, with the former rising and the latter flattish. At this rate, a golden cross between the averages is just a matter of time.
With that said, the range resistance mentioned previously is standing firm. Plus, conditions – the weekly in particular – are in overbought territory.
In the meantime, as per the EIA, US crude production in the week to March 8th fell 100,000 barrels per day week-over-week to 13.1 million b/d; until two weeks ago, output was at a record 13.3 mb/d. Crude imports decreased 1.7 mb/d to 5.5 mb/d. As did stocks of crude and gasoline, which respectively dropped 1.5 million barrels and 5.7 million barrels to 447 million barrels and 234.1 million barrels. Inventory of distillates, however, increased 888,000 barrels to 117.9 million barrels. Refinery utilization increased 1.9 percentage points to 86.8 percent.
Read Full Story »»»
DiscoverGold
NY Crude Oil Futures »» Weekly Summary Analysis
By: Marty Armstrong | March 16, 2024
NY Crude Oil Futures closed today at 8104 and is trading up about 13% for the year from last year's settlement of 7165. Immediately, this market has been rising for 2 months going into March reflecting that this has been only still, a bullish reactionary trend. As we stand right now, this market has made a new high exceeding the previous month's high reaching thus far 8162 while it has not broken last month's low so far of 7141. Nevertheless, this market is still trading above last month's high of 7962.
Up to now, we still have only a 2 month reaction rally from the low established during December 2023. We must exceed the 3 month mark in order to imply that a trend is developing.
ECONOMIC CONFIDENCE MODEL CORRELATION
Here in NY Crude Oil Futures, we do find that this particular market has correlated with our Economic Confidence Model in the past. The Last turning point on the ECM cycle low to line up with this market was 2020 and 2009 and 2001 and 1998 and 1994. The Last turning point on the ECM cycle high to line up with this market was 2022 and 2018 and 2011 and 2000.
MARKET OVERVIEW
NEAR-TERM OUTLOOK
The historical broader tone of the NY Crude Oil Futures has been a bearish consolidation following the high established back in 2008. Since then, this market has created 2 reaction highs which have been unable to break this overall protracted bearish consolidating trend. Still, the major low was made in 2023 and the market has bounced back for the last year. The last Yearly Reversal to be elected was a Bullish at the close of 2023.
This market remains in a positive position on the weekly to yearly levels of our indicating models. Nevertheless, it closed last year on the weak side down from 2022. Pay attention to the Monthly level for any serious change in long-term trend ahead.
From a perspective using the indicating ranges on the Daily level in the NY Crude Oil Futures, this market remains in a bullish position at this time with the underlying support beginning at 7962.
On the weekly level, the last important high was established the week of March 11th at 8162, which was up 13 weeks from the low made back during the week of December 11th. So far, this week is trading within last week's range of 8162 to 7679. Nevertheless, the market is still trading upward more toward resistance than support. A closing beneath last week's low would be a technical signal for a correction to retest support.
When we look deeply into the underlying tone of this immediate market, we see it is currently still in a semi neutral posture despite declining from the previous high at 8162 made 0 week ago. Still, this market is within our trading envelope which spans between 6253 and 8917. The broader perspective, this current rally into the week of March 11th reaching 8162 has exceeded the previous high of 7960 made back during the week of November 27th.
Right now, the market is above momentum on our weekly models hinting this is still bullish for now as well as trend, long-term trend. Looking at this from a wider perspective, this market has been trading up for the past 13 weeks which from a timing perspective warrants concern.
INTERMEDIATE-TERM OUTLOOK
YEARLY MOMENTUM MODEL INDICATOR
Our Momentum Models are declining at this time with the previous high made 2021 while the last low formed on 2023. However, this market has declined in price with the last cyclical low formed on 2023 warning that this market remains weak at this time on a correlation perspective declining in both price and Momentum.
Looking at the longer-term monthly level, we did see that the market made a high in September 2023 at 9503. After a four month rally from the previous low of 8346, it made last high in September. Since this last high, the market has corrected for four months. However, this market has held important support last month. So far here in March, this market has held above last month's low of 7141 reaching 7141.
Some caution is necessary since the last high 9503 was important given we did obtain one sell signal from that event established during September 2023. That high was still lower than the previous high established at 12368 back during June 2022. Critical support still underlies this market at 6700 and a break of that level on a monthly closing basis would warn of a further decline ahead becomes possible. Nevertheless, at this time, the market is still weak.
DiscoverGold
Natural Gas Bearish Momentum Reigns After Brief Bullish Reversal
By: Bruce Powers | March 15, 2024
• Natural gas sees bearish price action after a brief bullish reversal, encountering resistance near the 20-Day MA.
Natural gas got hammered today with bearish price action following yesterday’s one-day bullish reversal. Following an outside day yesterday and strong close that tested resistance at the 20-Day MA, natural gas encountered resistance today near that line following the day’s high of 1.77. That high briefly exceeded yesterday’s high. At the time of this writing, natural gas continues to trade near the lows of the day as it tests support heading towards yesterday’s low of 1.64. If today ends near the lows of the day or below yesterday’s low, the risk of further downside increases.

Next Lower Support Zone Starts at 1.63
Potential support around the 78.6% Fibonacci retracement is close by at 1.63, along with prior support at 1.61. These levels can be looked at as a potential support range from 1.63 to 1.61. Moreover, there is a more significant price level at 1.59 as it is a weekly low. Earlier this week a bearish reversal was triggered on the weekly chart as the price of natural gas dropped below last week’s low of 1.755. A drop below the three-week low at 1.59 would indicate further weakness and increases the chance that the downtrend may continue below the recent trend low of 1.52. Two weekly support levels failing within one week is bearish.
Resistance was seen recently at 2.01, which is the bottom of the blue dashed descending trend channel. It shows prior support levels now acting as resistance since the price levels were busted on the way down. This behavior reflects the remaining weakness from the long-term downtrend.
Negative Reaction to Thursday’s Intraday Advance
Given today’s negative reaction to yesterday’s bullish price action, the indication is that the downtrend still dominates. It seems fair therefore to use this week’s high of 1.84 as an important price level to key off. If natural gas remains below that weekly high downward pressure remains and the downtrend rules. A rally above that high would be needed to improve the chances for a sustainable rally and bottom reversal.
Weekly High for Bullish Signal
If a bullish reversal from this week’s candle does occur natural gas will next be heading up into potential resistance at the bottom of the declining trend channel. Further, the recent swing high of 2.01 marks the next higher possible resistance zone. Nevertheless, a daily close above the lower trend channel line (blue dash) will increase the chance that natural gas can eventually rally above 2.01.
Read Full Story »»»
DiscoverGold
Oil & Gas Equipment & Services ETF Resumes its Uptrend
By: Arthur Hill | March 15, 2024
The Oil & Gas Equipment & Services ETF (XES) is showing strength here in March as it breaks back above its 40-week SMA. More importantly, the long-term trend is up and this week's breakout argues for a continuation of this uptrend.
The chart below shows XES with a big breakout surge in the fourth quarter of 2020. Even though this move reversed the long-term downtrend, the advance over the last three years is quite choppy. The green dashed lines show a rising channel with the 40-week SMA (red line) in the middle. XES crossed this moving average several times as it slowly zigzagged higher. Despite choppy trading, the long-term trend is clearly up on this chart.
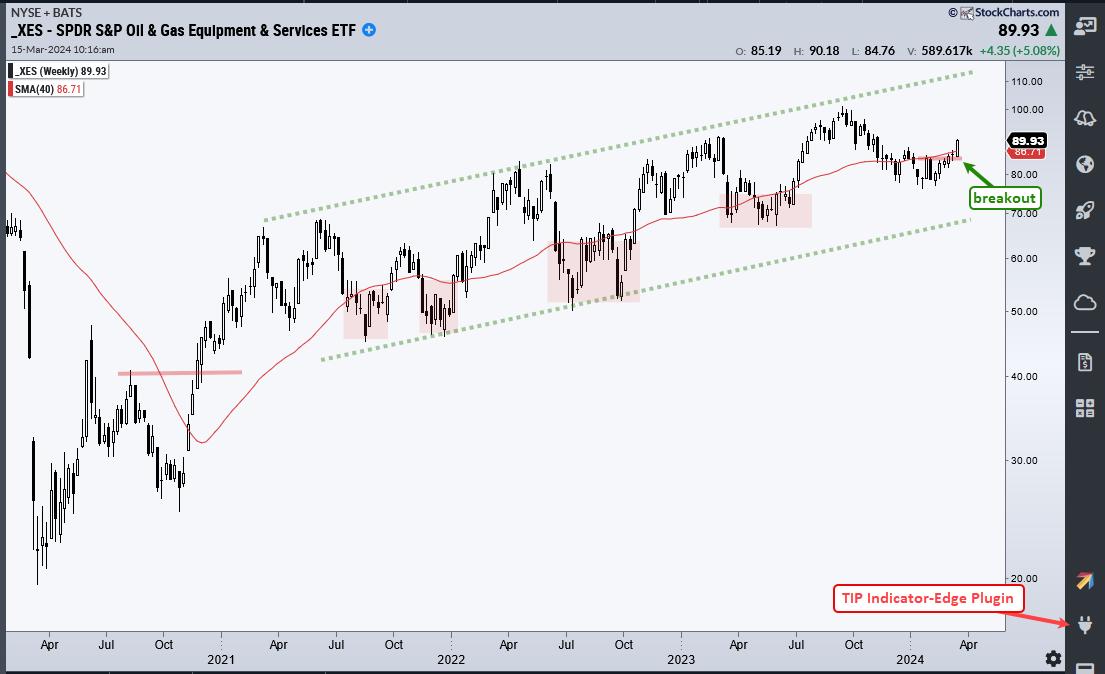
Short-term, I am seeing a breakout after a pullback. The red shadings show prior dips below the 40-week and each dip represented more of an opportunity than a threat. XES dipped below the 40-week SMA in December and remained below from early January to early March. The ETF turned up the last few weeks and surged above its 40-week SMA this week. This move reverses the downswing within the rising channel and argues for a continuation of the bigger uptrend. The upside target is around 110 and a closes below 81 would argue for a re-evaluation.
Read Full Story »»»
DiscoverGold
Natural Gas Continues to Look For Bottom
By: Christopher Lewis | March 15, 2024
• Natural Gas markets continue to look for a bottom in what has been a horrific market over the last year or so.
Natural Gas Weekly Technical Analysis
The natural gas weekly chart has shown a negative candle for the week as we continue to bounce around the bottom. At this point though, we are so low and at such a significant barrier that I do think longer term buy and hold types are starting to come into the market. I have gotten involved in an ETF again. I don’t want to get over levered in a market that could take months to turn around, but we are clearly in an area that in the past, we have seen a lot of support.
This will be the third time we’ve visited it since 2015. So historically it has worked out quite well for a bounce to about $3, maybe even as much as $4. Now, having said that, the trick of course is that you don’t want to be overly levered because you could get hurt.
On the other hand though, if you have an investment type of frame of mind, then you can really start to see how this could play out in your favor. Again though, time is something that you’re going to have to be able to deal with. This is not likely to be a quick payout, unless of course we get some type of nasty winter storm at the end of the season in the Northern Hemisphere. We could very well just spend most of spring and summer just consolidating.
Read Full Story »»»
DiscoverGold
A month ago we turned bullish on $USO and $XLE and were looking for $80 and $88 targets, respectively. We remain Bullish on both for as long as they stay above their 200d SMA and Ichimoku Cloud.
By: Intelligent Investing | March 15, 2024
• A month ago we turned bullish on $USO and $XLE and were looking for $80 and $88 targets, respectively.
#XLE surpassed its minimum target elegantly. And has further to run.
#USO is now playing catch up.
We remain Bullish on both for as long as they stay above their 200d SMA and Ichimoku Cloud.


Read Full Story »»»
DiscoverGold
Ides and Tight Spaces. The Energy Report
By: Phil Flynn | March 15, 2024
I’m the friendly stranger in the black sedan. Won’t you hop inside my car? Beware the Ides of March as the International Energy Agencies’ (IEA) prophecies are questionable and may be a betrayal of their energy security mission.
Global petroleum markets must reassess their outlook after the (IEA) soothsayers had to admit that they once again underestimated demand and overestimated supply. That led to many hedge funds with questionable positions that may have to be liquidated. Now the market must get a handle on just how large the supply deficit is going to get and just how tight supply is going to become. The market must now realize that the possibility of an oil price spike could help derail the Fed rate cut plans. Inflation is still too hot but at the same time, consumers are feeling pain as retail sales start to falter. Faulty data from the IEA led to hedge fund selling in the market and now that they know it’s wrong, must start getting out of bad positions.
US producer prices on a year-over-year basis increased by 1.6%, the biggest move since September 2023 as the cost of goods like gasoline and food surged. Yet the Fed may have a problem not cutting rates as retail sales rose 0.6% last month, less than expected after falling a revised 1.1% in January.
There is talk of a breakout in the Commodity Price Index. Hedge funds that have been betting on lower to sideways markets will have to reassess positions as they have to look at the signs of the times. Bloomberg News reported that, “commodities got sucked into a global short volatility trade. They say that, “Traders are betting against volatility in raw materials prices, countering the commodity sector’s notoriously boom-and-bust history. Whether it’s an oil market that is stuck firmly in a range due to OPEC+ cuts and abundant spare capacity, or copper prices torn between surging renewable demand and strains in more traditional consumption areas, there have been plenty of factors keeping the world’s commodity prices stuck in recent months. Gas volatility is back to where it was before a supply crisis in Europe. It makes for another sector in global markets where one of the most dominant trades has been betting against big swings. Macro volatility has been grinding lower as equities push higher and billions of dollars pour into exchange-traded funds wagering on continued calm.“’
Yet now with the International Energy Agency and OPEC talking about supply deficits and the possibility they could be much larger, the hedge funds may have to cover that could lead to an explosive move not unlike what we saw recently in copper and it could mean sharply higher prices at the pump after the price spike. The Fed will have to reassess their rate cutting schedule. They’re in a tough place because to back off a rate cut going into an election year might be viewed as political so beware the ides of March because the soothsayers have got it wrong.
The Energy Information Administration reported that In 2023, the world produced an estimated 101.8 million barrels per day (b/d) of petroleum and other liquids: mostly crude oil but also lease condensate, natural gas liquids, biofuels, and other liquids from hydrocarbon sources. We expect the global petroleum and other liquids supply to increase by about 0.4 million b/d in 2024 and 2.0 million b/d in 2025. This growth will be driven primarily by rising crude oil production from four countries in the Americas—the United States, Guyana, Canada, and Brazil—which would partially offset near-term voluntary production cuts in 2024 that we expect from countries participating in the OPEC+ agreement.
Collectively, OPEC+ countries accounted for 43% (43.7 million b/d) of global liquids production in 2023. The EIA forecast that OPEC+ petroleum liquids production will fall by 1.0 million b/d this year and then increase by 0.9 million b/d in 2025 after most existing production cuts expire. We assume OPEC+ members will maintain some voluntary production cuts through 2025 to offset slow demand growth. The OPEC+ production targets are based on crude oil volumes rather than all petroleum liquids, and we expect the crude oil portion of production in these countries to decline by 1.1 million b/d in 2024 and then increase by 0.9 million b/d in 2025.
The gasoline crack spread looks like it’s on the verge of breaking out to the upside. Diesel crack is a little bit more subdued. It’s probably time to start putting on those hedges. Natural gas did get a bit of a bounce as more talk of production cutbacks are starting to make the rounds. The huge contango in the natural gas market is giving some hope that there could be some relief down the road. The question is whether that relief comes with increased demand or just lower production. As we recommended before, to be short the front end of the curve along the back has really paid off.
Read Full Story »»»
DiscoverGold
Crude Oil Continues to Look Bullish
By: Christopher Lewis | March 15, 2024
• Crude oil markets continue to look bullish, despite the fact that we did pullbacks slightly during the day on Friday. Crude oil markets continue to look bullish, despite the fact that we did pullbacks slightly during the day on Friday. Ultimately, we are hanging around previous resistance, so I do think there is a certain amount of support that’s waiting to come into the market.
WTI Crude Oil Technical Analysis
You can see that we have stalled somewhat during the Friday session as it looks like we are trying to do everything we can to take a bit of a break. Ultimately, I think this is a situation where even if we do pull back from here, there should be plenty of buyers and therefore I think the overall trend continues. The question is whether or not we can have enough momentum to continue to push this higher.
I think we do eventually, but this is a grinding type of market and therefore it’s going to be very, very difficult to get overly aggressive and of course you will have to be patient. I still like buying the dips, I still think that the WTI grade goes to the $85 level.
Brent Crude Oil Technical Analysis
Brent is very much in the same situation, it looks like we are doing everything we can to tread water right around the crucial $84.50 level, and that will continue to be a scenario that I think a lot of people look towards. I do think that this is more likely than not going to be a market that follows right along. And I would expect to see Brent go to the $90 level sometime over the next several months. So in the meantime, my job as a trader is just to simply buy the pullback and take advantage of value if and when it occurs.
Ultimately, I do think that that value will show up and those pullbacks will be looked at as such. It’s worth noting that both grades of oil are starting to get close to forming the so-called golden cross when the 50-day EMA turns upward and crosses above the 200-day EMA. So keep that in mind as well. Either way, I don’t have any interest in shorting the market. I do recognize these pullbacks come and go, but with the tight supply of the geopolitical concerns, the Middle East and of course just the fact that we are heading into the summer season suggests that we are going higher.
Read Full Story »»»
DiscoverGold
Natural Gas Buyers Likely to Drive Prices Higher
By: Bruce Powers | March 14, 2024
• Despite resistance zones, a breakout above the recent swing high could lead to further gains, with a first higher target around 2.13.
Natural gas may have completed a bottom for the retracement today with a new pullback low of 1.65. Although the 78.6% Fibonacci level at 1.63 was not reached today’s price action indicates a possible switch from the sellers being in charge to the buyers taking control of price action. There is an increased likelihood of a rally off today’s low. Yesterday’s high of 7.72 was exceeded as a high of 1.76 was reached today following a drop to new trend lows. That high is at the time of this writing, and it may be higher by today’s close. A daily close above yesterday’s high will be a slightly more bullish indication than a close below it.

Signs of a Bottom and Bullish Reversal
Today is the first day of the retracement where the price of natural gas exceeded a prior day’s high, which is a sign of strength. It sets up a potential rally that has the potential to breakout above the recent 2.01 swing high. This scenario is supported by the behavior of the 8-Day and 20-Day moving averages.
The 8-Day line crossed back above the 20-Day line on March 4 for the first time since late-January, and it stayed above it during this current retracement. If the scenario plays out the first higher target looks to be around 2.13. That is where a rising ABCD pattern utilizing today’s low would hit its first target (see chart).
Resistance on the Way Up
Nonetheless, there are price areas of concern on the way up. First, is the price zone around the recent swing high. It stopped the ascent and led to a retracement. That zone is derived from previous long-term support zones (now resistance) from 1.95 to 1.97. Further, it is in the area represented by the lower blue dashed trend channel line.
The recent swing high hit resistance very close to the line and it could do so again. Notice that the line represented support on December 12 and then resistance in early-February and most recently. In other words, the market has clearly identified this line. Therefore, it could represent resistance once again. In addition, a decisive breakout above the recent swing high would have the added significance of breaking through the trendline.
Read Full Story »»»
DiscoverGold
Energy Daily Market Movers (% Price Change)
By: Marty Armstrong | March 14, 2024
• Top Movers
NYMEX RBOB Gasoline Futures 2.93 %
NY Heating Oil Futures 2.84 %
NY Crude Oil Futures 2.78 %
London IPE Brent Crude Futures 2.58 %
London IPE Brent Crude Spot 2.58 %
• Bottom Movers
NY Natural Gas Futures 3.27 %
AU - Queensland Base-Load Electricity Futures 1.51 %
NSW Baseload Electricity Continuous 1.1 %
AU - Victoria Base-Load Electricity Futures 1.09 %
*Close from the last completed Daily
DiscoverGold
Dereliction Of Duty. The Energy Report
By: Phil Flynn | March 14, 2024
Some might say that The International Energy Agency (IEA) has been derelict in its duty to secure energy security for Europe because they have been taken over by a green energy agenda.
Not it appears they must acknowledge they were wrong about stopping investments in fossil fuel but today, they have to acknowledge what I have been saying for months and that is that hat the world is headed into a crude oil supply deficit supply deficit.
Oil price broke back above $80 a barrel WTI after the IEA that the global oil market will face a supply deficit having to backtrack on their previous forecast of a supply surplus. As I have written many times in the past, the IEA has constantly underestimated demand and overestimated production in some cases to make their green energy models work and to try to make them look somewhat feasible, when it’s not.
The IEA had to change its global oil demand growth forecast by 270,000 barrels a day and now says that the world will see growth of 1.7 million barrels a day which will be a new record high.
The IEA says that “Global oil demand is forecast to rise by a higher-than-expected 1.7 mb/d in 1Q24 on an improved outlook for the United States and increased bunkering. While 2024 growth has been revised up by 110 kb/d from last month’s Report, the pace of expansion is on track to slow from 2.3 mb/d in 2023 to 1.3 mb/d, as demand growth returns to its historical trend while efficiency gains and EVs reduce use.”
Maybe the International Energy Agency hasn’t been paying attention to what’s been going on in the electronic vehicle market. Pinning your hopes that electronic vehicles are going to reduce demand growth significantly doesn’t match up with the reality that we’re hearing in the real electronic vehicle world. EV sales s are horrible and companies are losing massive amounts of money on the electronic vehicle. Not only did Apple abandon its car yesterday, but it was also reported that Porsche is abandoning its electric vehicles.
The IEA National Energy Agency blamed OPEC, and they say that they expect OPEC will continue their cuts through the end of 2024. The IEA blamed OPEC saying they changed the assumptions and shifted our implied balance into a slight deficit rather than a hefty build in last month’s report.
The IEA put world oil production is projected to fall by 870 kb/d in 1Q24 vs 4Q23 due to heavy weather-related shut-ins and new curbs from the OPEC+ bloc. From the second quarter, non-OPEC+ is set to dominate gains after some OPEC+ members announced they would extend extra voluntary cuts to support market stability. Global supply for 2024 is forecast to increase 800 kb/d to 102.9 mb/d, including a downward adjustment to OPEC+ output.
The IEA also had to acknowledge another thing I have been warning about and that is the tight global oil supply despite the historically warm winter that we had in many places even as they try to spin it to look better.
The IEA said that Global onshore oil stocks fell a further 38 mb last month, taking the drawdown since July to 180 mb, according to preliminary data.
Over the same period, oil on water surged. Trade dislocations from the rerouting of Russian barrels and more recently due to unrest in the Middle East, have boosted oil on water by 115 mb. In February alone, oil on water surged by 85 mb as repeated tanker attacks in the Red Sea diverted more cargoes around the Cape of Good Hope. At nearly 1.9 billion barrels as of the end of February, oil on water hit its second-highest level since the height of the COVID-19 pandemic.
The bottom line is that the International Energy Agency tried to sell us a bill of goods and now they have to admit they were wrong, They weren’t wrong by a little bit by a long shot. For years I have warned about the International Energy Agency and the loss of their mission their fixation on the energy transition had them lose their. Direction sadly Matt blow to their credibility it’s going to take some time to repair. When I first started to point this out I seemed to be in the minority but more and more people in the oil industry are starting to take the International Energy Agency predictions with more skepticism than they have before. It’s a shame when we used to look to the International Energy Agency as a non-biased reporting agency and now have to realize that they have an agenda and the agenda sadly is energy security for Europe.
Today’s breakup of $80.00 is significant especially if we can hold it into the close above $80.00 a barrel should induce short covering his hedge funds continue to favor the short side of the market.
.And after yesterday’s Energy Information Administration (EIA) report showed that US petroleum inventories (crude, SPR, refined products) are at the lowest point since end-2022 the market is starting to face up to a new reality. The reality is that the expected crash in global oil demand is not going to happen. They also have to face up to the reality that EV’s are not going to cut into gasoline demands nearly as badly as many had predicted.
US production had fallen to 13.1 million barrels a day in part because (EIA) may have been over-reporting it in the first place, The EIA said that this week’s domestic crude oil production estimate incorporates a re-benchmarking that decreased estimated volumes by 177,000 barrels per day, which is about 1.3% of this week’s estimated production total.
The EIA that gasoline supplies falling significantly is going to create further challenges for US refiners if they are going to rise to the occasion to meet the demand which is much better than the International Energy Agency has been telling them it would be.
The EIA said that “U.S. commercial crude oil inventories (excluding those in the Strategic Petroleum Reserve) decreased by 1.5 million barrels from the previous week. At 447.0 million barrels, U.S. crude oil inventories are about 3% below the five-year average for this time of year. Total motor gasoline inventories decreased by 5.7 million barrels from last week and are about 3% below the five-year average for this time of year. Both finished gasoline and blending components inventories decreased last week. Distillate fuel inventories increased by 0.9 million barrels last week and are about 7% below the five-year average for this time of year.”
Gasoline demand rose again last week as supply tightened, Gas demand week over week hit 9,044 million barrels a day up 30,000 barrels from the week before.
The EIA said that total oil product demand based on products supplied over the last four-week period averaged 19.9 million barrels a day, up by 1.0% from the same period last year.
Over the past four weeks, motor gasoline product supplied averaged 8.7 million barrels a day, down by 1.3% from the same period last year but up over last week.
Distillate fuel product supplied averaged 3.7 million barrels a day over the past four weeks, up by 0.5% from the same period last year.
Jet fuel product supplied was up 2.0% compared with the same four-week period last year.
Natural gas producers are in bad shape with historically low prices and spot prices that have gone negative. The question is will we be able to cut back production enough to save some of the producers,.
The EIA said that Winter storms have disrupted U.S. natural gas production ›
Over the last four winters, winter storms Uri (February 2021), Elliott (December 2022), and most recently, Heather (January 2024) interrupted weekly U.S. natural gas production by more than 15 billion cubic feet per day (Bcf/d), according to daily estimates from S&P Global Commodity Insights. These declines were the largest interruptions to U.S. natural gas production during the past four years.
Although the impacts of these disruptions appear more muted over a month, winter storms Uri and Elliott still drove declines in monthly average natural gas production of 3 Bcf/d to 7 .
Read Full Story »»»
DiscoverGold
Natural Gas Retreats from Recent Highs, Eyes Key Support Levels
By: Bruce Powers | March 13, 2024
• Natural gas prices retreat further from recent highs, indicating that sellers remain in chart. Key support levels at 1.63 and 1.58 should hold if it is to have a chance to rally.
Natural gas continued to pull back on Wednesday from the recent 2.01 swing high hit last week. Today’s decline put it below yesterday’s low and at a new retracement low of 1.65. It looks to be on its way to the 78.6% Fibonacci retracement at 1.63, while the previous pullback low is at 1.58.

Long-term Downtrend Dominates
The long-term pattern in natural gas is a downtrend. Last week’s high found resistance at previous support, which is typical price action in a bearish environment. Further weakness is seen this week as both the 20-Day MA and 61.8% Fibonacci level failed to stop the decline. Further, a bearish signal occurred on a drop below last week’s low of 1.755. If support is seen around the 78.6% retracement followed by a bullish reversal, a rally may follow to test last week’s highs and possibly exceed them. The trend low was at 1.52 and it was in a price zone where long-term support was seen in the past.
Sitting at Long-term Support Range from 1.64 to 1.44
Specifically, support was seen in 2016 and then again in 2020. In 2020 the price of natural gas hovered around a price range from 1.64 to 1.44 for about six months. During the recent decline the lower prices of the range were not reached but they may still be. The next indication that the price of natural gas is getting weaker would occur on a drop below the weekly low of 1.59 and then the daily minor swing low at 1.58.
Bullish Reversal off Support Could Lead to Another Rally
If support is seen above the weekly low, followed by a bullish reversal, natural gas may rally again to test resistance levels. Initially, a test of the lower line of the declining blue dashed parallel trend channel is anticipated. That could lead to another lower swing high. That lower line has been recognized by the market several times starting with the December 13 swing low. Although it will likely be resistance again a decisive breakout above the line could lead to an eventual advance above the 2.01 swing high and further up into the channel.
Read Full Story »»»
DiscoverGold
Naive. The Energy Report
By: Phil Flynn | March 13, 2024
I guess if you believed some of the energy narratives over the last couple of years you must be naïve, I guess. Claire Coutinho, the UK’s Secretary of State for energy security and net zero, stated as much today when she said: “Anyone who tells you that we can just stop oil and gas is not just wrong but naive”. Well, that’s a little harsh. It is kind of like when the Biden administration tells you that gasoline prices are coming down, even though they are not, unless you adjust for inflation, that they tell you are going down, even though it isn’t.
Not only did we see the Consumer Price Index (CPI) come in higher than expected we also saw that the Energy Information Administration (EIA) sharply raised its gasoline price forecast on a day when the American Petroleum Institute reported a rather large 3.75 million barrel drop in weekly supply as refinery issues and better than expected demand significant are tightening supply. This is against a bullish backdrop of a bigger than expected 5.521 million barrels drop in crude oil supply a 1.162 million barrel drop in distillate and a 998.00 barrel drop in supply at the Cushing, Oklahoma delivery point. The CPI came up 0.4% for the month and 3.2% from a year ago. The core CPI rose 0.4% on the month and was up 3.8% on the year.
This came out before that EIA predicted that the U.S. average retail gasoline price will be about $3.50 per gallon this year, almost 20 cents/gal higher on an annual average basis in 2024.
It is also like telling the International Energy Agency that it was flat out ridiculous to tell the world to stop investing in fossil fuels immediately in a nod to the green energy lobby. A call that was widely panned as either extremely stupid or at the very best, naïve. Yet The IEA seemed to remember that their mission is energy security and not green energy lobbying.
It seems that the International Energy Agency (IEA) had a moment of clarity that OPEC was very keen to point out. In a report, OPEC put out a note called, “Oil Security: vital for All” OPEC called out the IEA by saying “We took note of the International Energy Agency (IEA) reaffirming the significance of oil security to energy transitions in its most recent commentary: “A strong focus on oil security will be critical throughout the clean energy transition”. In other words, OPEC was taking a victory lap because the International Energy Agency (IEA) had to backtrack from some of the ridiculous naive projections about supply and demand in the need for fossil fuels.
OPEC wrote, “At OPEC, we are encouraged by this message and the reference to the continuing importance of oil to the world. The IEA says in its commentary: “An enduring focus on oil security is a consequence of the continued need for oil to fuel cars, trucks, ships, and aircraft, as well as to produce the petrochemicals necessary to manufacture countless everyday items”. OPEC has strongly voiced these messages for many years, and we will continue to reiterate that energy security, energy affordability, and reducing emissions need to go hand-in-hand, as we look to an all-energies, all-technologies and all-peoples approach to energy transitions. OPEC also said that, “it is important to stress that the IEA’s talk of the need for no new oil and natural gas fields in its net zero pathway has contributed significantly to this uncertainty, which has the potential to lead to major energy chaos, not the desired energy security.”
Oil also found support because of more Ukrainian drone attacks on Russian oil facilities. Yesterday a report that a Russian refinery was on fire raised concerns about the ability of Russia to produce more oil. At the same time a report that Amos Hochstein of the Biden administration’s Special Presidential Coordinator for Global Infrastructure and Energy Security. He is working with India to allow them to buy more oil from Russia. So let me get this straight. We are trying to put sanctions on Russia but at the same time helping India buy more Russian oil. Mr. Hochstein said it isn’t about not allowing the oil to get out it’s only to make sure that India buys it at a low price. I wish that they would put in policies in the United States that would allow us to buy oil at a low price. Sort of like getting off the back of the US oil and gas industry. But maybe I am naïve.
This comes as the EIA had other bullish things to say about the state of the oil markets. The EIA raised its s 2024 WTI crude spot price to $82.15/bbl from $77.68/bbl. They also raised their forecast for 2024 World oil demand growth by 10,000 bpd, now seeing 1.43 mln bpd year-on-year increase. They also raised the forecast for 2025 world oil demand growth by 90,000 bpd, now seeing a 1.38 mln bpd year-on-year increase. They also raised its US EIA lifted 2024 spot Brent oil forecast to $87/bbl from $82.42/bbl.
While the prospects for oil look great, the prospects for natural gas and US gas producers look bleak. The EIA reported that, “Natural gas prices are expected at the Henry Hub spot price to remain below $2.00 per million British thermal units (MMBtu) in 2Q24 as the winter heating season ends with natural gas inventories 37% above the five-year average. The Henry Hub spot price averaged $1.72/MMBtu in February (30% lower than in our February STEO), a record low adjusted for inflation. Low prices were partially driven by reduced natural gas consumption in the residential and commercial sectors this winter. Natural gas production they say remained unchanged in March from February at just under 104 billion cubic feet per day (Bcf/d).
We expect lower natural gas prices to cause slight declines in natural gas production for the remainder of the year, and we do not expect that natural gas production will return to its December 2023 record of 106 Bcf/d during the forecast period. Forecast U.S. dry natural gas production averages 103 Bcf/d in 2024, down slightly from 2023. Production increases to 104 Bcf/d in 2025, driven by expected growth in associated natural gas production in the Permian Basin and growth in LNG export demand.
Yet we expect there will be a drop in production bigger than the EIA believes. CNX, which is an Appalachian gas producer, is reducing its natural gas production in 2024 and announced delays for well completions on at least three sale pads. Other natural gas producers have to fight off the potential of bankruptcy as they are losing money. Not only do they have to pay the royalty rates and leases, they also have to pay for their drilling and their employees and their loans to the bank and they can’t do that when gas prices are almost negative.
HFIR says that, “While we believe that the bottom ($1.50/MMBtu) will hold, low gas prices are needed to tighten balances going forward. At ~102 Bcf/d, injection gas balances point to a deficit of 1.5 Bcf/d. This would push storage to ~4 Tcf by November.
Read Full Story »»»
DiscoverGold
Natural Gas Bearish Momentum Targets Lower Fibonacci Levels
By: Bruce Powers | March 12, 2024
• Natural gas price action shows bears in control as it retraces further, with potential to test recent lows around 1.58 to 1.52, unless a bullish reversal occurs.
Natural gas further retraces its recent advance, falling to the 61.8% Fibonacci retracement with the day’s low of 1.69. Downward pressure remains as continues to trade near the lows of the day at the time of this writing. If it keeps falling the next Fibonacci level at 1.63 becomes the likely next lower target. That price is the 78.6% Fibonacci retracement level. Today’s price action shows the bears in charge and aligned with the larger bearish trend.

Bears Remain in Control
A bearish continuation of the long-term downtrend, begun from the August 2023 peak at 10.03, triggered initially on December 4 with a breakdown from a rising parallel trend channel. Further confirmation for the continuation of the bear trend to a new trend low triggered on February 8. Subsequently, support was eventually found at the 1.52 trend low seen several weeks ago. That low led to a rally to test resistance where support was seen earlier in February and April 2023. It was in a range from 1.95 to 1.97. The high of the recent counter-trend rally was 2.01.
Counter-Trend Rally Confirms Bearish Price Structure
The critical resistance zone around 1.95 to 1.97 was clearly tested and price was rejected to the downside from the 2.01 high. Note that the highest daily close during the advance was at 1.95. That seems to indicate that the market recognized the price range. Last week’s high not only successfully tested resistance near prior trend lows. The lower boundary of a falling parallel channel was also successfully tested as resistance. That channel is marked with dashed blue lines. Similarly, the bottom of the channel was clearly resistance following the gap down on January 29.
78.6% Retracement Looks More Likely
To summarize, during the recent countertrend rally natural gas hit resistance at key prior support zones. This is common bearish behavior within the progression of a downtrend. Therefore, since the pullback from the 2.01 high is retracing further, the potential to test recent lows around 1.58 to 1.52 increases. The possibility of natural gas falling below 1.52 remains a possibility. Nevertheless, a clear bullish reversal from the 61.8% or 78.6% retracement zones will put the countertrend rally back in play. As noted yesterday, it may just be that the rally is expanding its swings so that the pattern creates a C point on a rising ABCD pattern.
Read Full Story »»»
DiscoverGold
Crude Continues to Look For Momentum
By: Christopher Lewis | March 12, 2024
• Crude continues to see a lot of noisy behavior, and it should more likely than not continue. The markets are watching important resistance levels, and with this, you have to be cognizant of the overall momentum, and of course cyclical trade as well.
WTI Crude Oil Technical Analysis
Taking a look at the crude oil markets you can see that we have been dancing around the 200 day EMA for the last several sessions and of course, Tuesday wasn’t any different. That being said, the market is likely to continue to see buyers on dips, which does make a certain amount of sense considering that WTI has found so much support at the 50 day EMA and has of course been trying to reach towards the $80 level and break above it for several weeks now.
I think this time of year is a major influence as cyclical trade is most certainly in effect where we get more travel via car and plane. And, of course, we have supply concerns, which is an even bigger issue. So, on this, I like buying dips.
Brent Crude Oil Technical Analysis
Brent is very much in the same situation as the 50 day EMA offered support during the previous session. We do see a lot of resistance above, especially near the $84.50 level, but we are trying to do everything we can to pressure the market to the upside. If we do break down from here, I think the $80 level offers support, but if we can take off to the upside, then it becomes more or less an intermediate buy and hold situation.
I do think that both of these markets eventually hit $90 this summer, especially considering that the Federal Reserve and other major central banks around the world are going to be cutting rates and that should increase economic activity so it all ties together for high oil prices. I don’t have any interest in shorting and I look at every pullback as a potential value play to take advantage of. However, always make sure to be cautious with your position sizing, and that of course will continue to be a major concern with traders looking to get involved in this market, as the volatility will certainly pick up going forward.
Read Full Story »»»
DiscoverGold
Cracked Up. The Energy Report
By: Phil Flynn | March 12, 2024
Oil prices rebounded yesterday as it appears that gasoline supply is not all it’s cracked up to be. There are lingering concerns about the tightness of supply in the Midwest in the aftermath of the Whiting BP refinery outage as well as another refinery outage.
Reuters reported that the coker and small crude distillation unit (CDU) were shut by a leak on the gasoline-producing fluidic catalytic cracker (FCC) at Total Energies’ 238,000 barrel per day Port Arthur, Texas refinery, causing the gasoline crack spread to rise and causing tightness and many of the physical gasoline delivery points. Yet underneath it, the fact that the supplies of gasoline crude oil and diesel fuel are below average here and around the world against a backdrop where OPEC is cutting production, is setting the stage for yet another rally as the market heads into the summer driving season.
The rising gasoline prices along with today’s consumer price index could be a key determining factor into how many times the Federal Reserve will cut interest rates this year. We know that at least one rate cut is on the table because the Federal Reserve, going into an election year, could not possibly cut rates after making that promise. At the same time, if it’s a one cut and done it’s possible that we could see a rebound in the dollar. In recent days the dollar has been lower.
The gasoline price situation will not win voters’ favor with the Biden administration that they realize has had an impact on rising gasoline prices. The Keystone Pipeline that Biden killed would have been up and running by now. It would have moved oil from Canada in a much more efficiently manner to US refineries and out to the rest of the world. That pipeline would have moved oil more safely and more efficiently and because the oil is heavy it would have also played a big role in that helping the world rely more on Canadian oil. Instead, the world has turned to Russia to fill that heavy oil void.
Biden of course did not think these things through when he killed the Keystone Pipeline purely for political reasons. The Keystone Pipeline was not about the environment, it was not about jobs for the United States. It was all about making a political statement that there was a new sheriff in town and this new sheriff was going to crack down on fossil fuels.
The killing of the Keystone Pipeline was also to restrain investment in the United States. The ESG movement along with regulatory uncertainty has set the stage for US oil production peak. Instead of increasing refining capacity to take advantage of the US shale production, Biden discouraged that by saying they wanted to replace fossil fuels. Those people who believe that Biden’s policies were OK for the US oil and gas industry really haven’t talked to people in the US oil and gas industry. Those who point to record US production is evidence that Biden’s policies had no impact on US production, must realize that it takes years and massive investment to make that production happen. Now with new taxes on oil and gas producers proposed by this administration and even more taxes on the wealthy, the boom that we have seen that has been built up over decades will start to reverse.
Still it’s worth noting that, “The United States produced more crude oil than any nation at any time, according to The Energy Information Administration International Energy Statistics, for the past six years in a row. Crude oil production in the United States, including condensate, averaged 12.9 million barrels per day (b/d) in 2023, breaking the previous U.S. and global record of 12.3 million b/d, set in 2019. Average monthly U.S. crude oil production established a monthly record high in December 2023 at more than 13.3 million b/d. The crude oil production record in the United States in 2023 is unlikely to be broken in any other country in the near term because no other country has reached production capacity of 13.0 million b/d. Saudi Arabia’s state-owned Saudi Aramco recently scrapped plans to increase production capacity to 13.0 million b/d by 2027.
Together, the United States, Russia, and Saudi Arabia accounted for 40% (32.8 million b/d) of global oil production in 2023. These three countries have produced more oil than any others since 1971 (counting production in the Russian Federation of the Soviet Union prior to 1991), although the top spot has shifted among them over the past five decades. By comparison, the next three largest producing countries—Canada, Iraq, and China—combined produced 13.1 million b/d in 2023, only slightly more than what was produced in the United States alone.”
Yet those in the Biden administration should not try to take credit for what has happened because of years of hard work, ingenuity, investment that happened long before Biden came into office. Most people in the energy industry will tell you that Biden and his policy is creating an energy crisis that is going to happen in the future mainly because of the short-sighted policies by this administration.
Of course one the key thing in the short term that will move the price of oil will be today’s consumer price index but we really have to focus on U.S. oil inventories as well. We expect to see a drawdown in crude supplies by 2,000,000 barrels and product supply by 2,000,000 barrels as well. We’re starting to see gasoline inventories tighten significantly especially in the Midwest and we’re starting to see diesel supplies be squeezed. We’re lucky we had a warm winter because once again diesel supplies could have been much tighter than they already are. But the thing you must really keep an eye on is where we go from this point forward. As this summer driving season is coming around and even if we get a soft consumer price index in this report, the possibility of a price jump forecast is very high.
Geopolitical risks are still high. Reports that we’re seeing more bombing in Gaza has caused Iranian backed Houthi rebels to vow to continue their acts of terror in the Red Sea. Hot inflation and fiscal uncertainty is driving investment in cryptocurrencies, gold, silver and platinum. Palladium also has had an incredible ride along with a very tight supply of iron ore. Physical commodities are tight and that could drive commodities that are undervalued in many ways compared to the rest of the market.
Natural gas producers are going to feel more pain as natural gas spot prices fell to the lowest level since October of 2020. According to natural gas collector, the previous 2024 low was $1.37 on February 26. Obviously, they’re pointing to warm weather and that still presents a challenge to the physical price premium as prices flipped into the negative for the second time this month. Free gas, no place to go.
There are reports that China’s liquefied natural gas imports are going to rise next year after they already increased by 12.6% last year. With growing global demand for liquefied natural gas and the fact that the United States could supply gas to the world thereby replacing dirty coal, it makes no sense that Biden has paused reviews of new LNG export facilities. China stock market is also 20% from its lows and the according to Bloomberg News that is fueling predictions that China’s stock market has bottomed out.
Read Full Story »»»
DiscoverGold
Energy Daily Market Movers (% Price Change)
By: Marty Armstrong | March 12, 2024
• Top Movers
NYMEX RBOB Gasoline Futures 2.11 %
NY Heating Oil Futures 0.69 %
London IPE Gas Oil Futures 0.56 %
London IPE Brent Crude Futures 0.16 %
London IPE Brent Crude Spot 0.16 %
• Bottom Movers
NY Natural Gas Futures 2.55 %
ICE Newcastle Coal Continuous 2.31 %
AU - Queensland Base-Load Electricity Futures 0.14 %
NY Crude Oil Futures 0.1 %
*Close from the last completed Daily
DiscoverGold
Natural Gas Further Testing Support Levels
By: Bruce Powers | March 11, 2024
• Natural gas tests key support levels, with potential for a bullish reversal once complete.
Natural gas further tests support around the 20-Day MA (purple) on Monday with a slightly new retracement low of 1.75. It is on track to complete an outside day today as earlier in the session last Friday’s high was exceeded briefly to the upside. The 50% retracement is also near the retracement lows at 1.765. So, there is the 20-Day line and 50% retracement marking potential support along with last week’s low. Since a bullish breakout above Friday has failed, today’s low is also at risk of failure to the downside. This doesn’t mean it will fail, just that the chance it could do so has increased.

Next Lower Support at 61.8% Fibonacci Retracement of 1.71
If natural gas does break below the current support area it likely heads towards the 61.8% Fibonacci retracement at 1.71. Certainly, that would indicate a failure of the 20-Day MA to maintain support. Also, the 78.6% Fibonacci retracement is at 1.63. Notice that the short-term 8-Day MA line has turned down since Friday, thereby providing an indication of weakness. An initial rising ABCD pattern completed last week at the 161.8% Fibonacci expansion target of 2.02. Last week’s high was 2.01. The subsequent reaction of price tells us it is done. Therefore, the market needs to set up for the next potential advance. A retracement low may still be established near today’s low, or a drop to lower price levels comes first.
Bullish Reversal Anticipated Once Retracement is Complete
Nonetheless, the recent swing low from February 20 is a solid low and there remains the possibility that the rally off that low will continue once the developing up trending pattern expands with a new swing low. In other words, the price swings within the developing uptrend becomes larger. Today’s low may be that bottom or the lower levels noted above may be hit first. In general, staying above the 20-Day line shows greater underlying strength than trading and closing below the line.
Breakout Above 1.84 is Bullish
Regardless of the above analysis, a decisive breakout above today’s high of 1.84 provides a bullish signal. If it holds natural gas should rally into last week’s high zone to test it as resistance. An upside breakout above last week’s high of 2.01 confirms strength and thereafter a higher potential target comes into view. The next higher key target has been identified around 2.23. That is where the December swing low was and the 38.2% Fibonacci retracement of an internal downswing. The 50-MA was also at that price earlier but it has come down some to 2.22.
Read Full Story »»»
DiscoverGold
Today's Futures Heat Map • Weakest: Natural Gas, Orange Juice, Lean Hogs, Soybean Meal
By: Barchart | March 11, 2024
• Today's Futures Heat Map
Strongest: Cocoa, Bitcoin, Sugar, Platinum
Weakest: Natural Gas, Orange Juice, Lean Hogs, Soybean Meal

Read Full Story »»»
DiscoverGold
$WTIC $OIL - Holding that Bear Channel B/Out. Has yet to recover that Mthly 20/MA tho, when it does (if) my hghr targets will come into view...
By: Sahara | March 11, 2024
• $WTIC $OIL - Holding that Bear Channel B/Out.
Has yet to recover that Mthly 20/MA tho, when it does (if) my hghr targets will come into view...

Read Full Story »»»
DiscoverGold
|
Followers
|
100
|
Posters
|
|
|
Posts (Today)
|
0
|
Posts (Total)
|
10948
|
|
Created
|
04/21/06
|
Type
|
Free
|
| Moderators DiscoverGold | |||
Welcome to: Oil & Natural Gas - Energy - Commodities - Resources
Under Contruction:
OIL & GAS STOCK NEWS.COM
TICKER SPY.COM for DD & research
PLEASE READ - This is concern for all , market maker signal for shares.
100-I need shares
200-I need shares badly,but do not take it down
300-take the price down to get shares
400-trade it sideways based on supply and demand
500-gap one way or another,to the direction of the 500 trade.
ADDING THIS 4/22/06: In my experiences I Noticed When In Sub Penny Add a Zero!! - Mick
***DISCLAIMER***
- The Board Monitor and The Board Assistants herewith, are not licensed brokers and assume NO responsibility for the actions, investment decisions, and or messages posted on this forum.
- We do NOT recommend that anyone buy or sell any securities posted herewith. Any trade entered into risks the possibility of losing the funds invested.
- There are no guarantees when buying or selling any security.
PLEASE MARK BOARD & MODS -- PLUS SIGN UP FOR OUR EMAIL LIST!
| Volume | |
| Day Range: | |
| Bid Price | |
| Ask Price | |
| Last Trade Time: |


