 News
News  Market Data
  Discover
Support: 888-992-3836
Copyright © 2023 InvestorsHub Inc.


Register for free to join our community of investors and share your ideas. You will also get access to streaming quotes, interactive charts, trades, portfolio, live options flow and more tools.
Someone selling some today?
If a company were to use the MECK shell, they would immediately have instant value. They could even issue a couple million shares at probably around $6.00 per share to help with funding the company and everyone would still be sitting on gold here. That is what is so nice about the super low OS here!
It's very hard to get large blocks of shares here. No one wants to sell because if we get a DOLV sized market cap, we will be trading over $8.00 per share!
That's actually very curious to me, especially the oddly small value purchased
RBC Global Asset Management (US) Inc - RBC Microcap Value I Takes A Position in $MECK
Shares Held - 2,285
Date of Portfolio: 3/31/17
http://investors.morningstar.com/ownership/shareholders-major.html?t=MECK
Even at .08, the market cap is only $484,000. If the Chinese battery company used MECK instead of DOLV for its reverse merger, MECK would be trading over $8.00 per share and would be eligible for Nasdaq listing price wise. Tons of potential for any company that utilizes MECK
with that market cap - 1500% gains thus far will be nothing when we hit $1.75 a share
$MECK
MecklerMedia Corp
Coverage? MecklerMedia Corp (MECK) Moves 6.67%
http://tuckermantimes.com/mecklermedia-corp-meck-moves-6-67/169261/
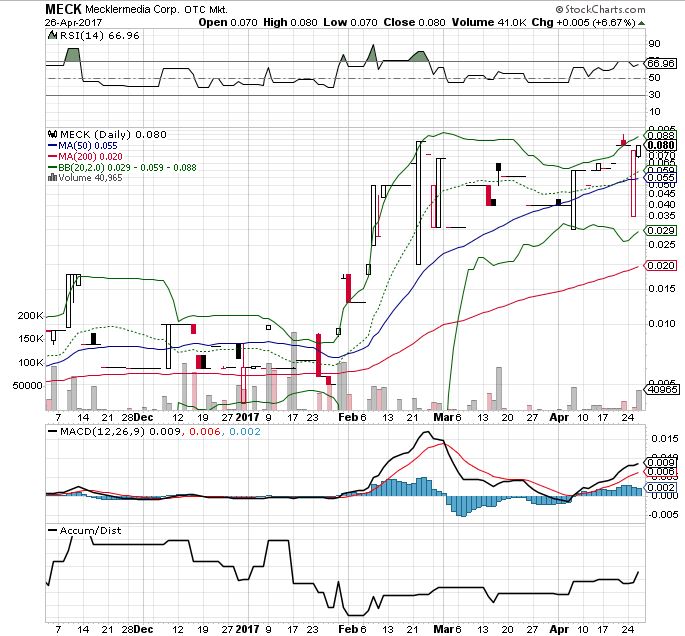
Shares of MecklerMedia Corp (MECK) have seen the needle move 6.67% or $0.005 in the most recent session. The OTC listed company saw a recent bid of 0.0800 on 40965 volume.
Now let’s take a look at how the fundamentals are stacking up for MecklerMedia Corp (MECK). Fundamental analysis takes into consideration market, industry and stock conditions to help determine if the shares are correctly valued. MecklerMedia Corp currently has a yearly EPS of -0.73. This number is derived from the total net income divided by shares outstanding. In other words, EPS reveals how profitable a company is on a share owner basis.
Another key indicator that can help investors determine if a stock might be a quality investment is the Return on Equity or ROE. MecklerMedia Corp (MECK) currently has Return on Equity of -3.20. ROE is a ratio that measures profits generated from the investments received from shareholders. In other words, the ratio reveals how effective the firm is at turning shareholder investment into company profits. A company with high ROE typically reflects well on management and how well a company is run at a high level. A firm with a lower ROE might encourage potential investors to dig further to see why profits aren’t being generated from shareholder money.
Another ratio we can look at is the Return on Invested Capital or more commonly referred to as ROIC. MecklerMedia Corp (MECK) has a current ROIC of -225.78. ROIC is calculated by dividing Net Income – Dividends by Total Capital Invested.
Similar to ROE, ROIC measures how effectively company management is using invested capital to generate company income. A high ROIC number typically reflects positively on company management while a low number typically reflects the opposite.
Turning to Return on Assets or ROA, MecklerMedia Corp (MECK) has a current ROA of -112.27. This is a profitability ratio that measures net income generated from total company assets during a given period. This ratio reveals how quick a company can turn it’s assets into profits. In other words, the ratio provides insight into the profitability of a firm’s assets. The ratio is calculated by dividing total net income by the average total assets. A higher ROA compared to peers in the same industry, would suggest that company management is able to effectively generate profits from their assets. Similar to the other ratios, a lower number might raise red flags about management’s ability when compared to other companies in a similar sector.
Stock Coverage: Checking the Chart on Shares of MecklerMedia Corp (MECK)
https://rivesjournal.com/checking-the-chart-on-shares-of-mecklermedia-corp-meck/114554/
MecklerMedia Corp (MECK) has a current 14 day Williams %R reading of -16.67. Levels can range from 0 to -100. A Williams %R that falls between -80 to -100 is typically viewed as being in strong oversold territory. A value between 0 to -20 would represent a strong overbought condition. As a momentum indicator, the Williams R% has the ability to be used with other technicals to help define a specific trend.
MecklerMedia Corp (MECK) presently has a 14-day Commodity Channel Index (CCI) of 116.2. Typically, the CCI oscillates above and below a zero line. Normal oscillations tend to stay in the range of -100 to +100. A CCI reading of +100 may represent overbought conditions, while readings near -100 may indicate oversold territory. Although the CCI indicator was developed for commodities, it has become a popular tool for equity evaluation as well. Checking on another technical indicator, the 14-day RSI is currently sitting at 62.81, the 7-day rests at 69.22, and the 3-day is presently at 73.85. The Relative Strength Index (RSI) is a highly popular technical indicator. The RSI is computed base on the speed and direction of a stock’s price movement. The RSI is considered to be an internal strength indicator, not to be confused with relative strength which is compared to other stocks and indices. The RSI value will always move between 0 and 100. One of the most popular time frames using RSI is the 14-day.
Moving average indicators are commonly tracked by technical stock analysts. Many traders will use a combination of moving averages with multiple time periods to help spot stock trend direction. One of the more popular combinations is to use the 50-day and 200-day moving averages. Investors may use the 200-day MA to help smooth out the data a get a clearer long-term picture. They may look to the 50-day or 20-day to get a better grasp of what is going on with the stock in the near-term. Presently, the 200-day moving average is at 0.17, and the 50-day is 0.04. The 14-day ADX for MecklerMedia Corp (MECK) is standing at 15.09. Many chart analysts believe that an ADX reading over 25 would suggest a strong trend. A reading under 20 would suggest no trend, and a reading from 20-25 would suggest that there is no clear trend signal.
No one has sold in the last couple weeks. Those bidders are going to have to buy at ask eventually IMO
3D print everything is going to be insanely huge going forward!
Its been awhile since I have seen 40k shares on the bid.
i wonder if things are brewing - shares are tough to come by as the support builds
$MECK
crazy bid support here.
I like the 12 share sell at .04 lol. I'm glad its not a big enough sell to show up on the chart.
Nice bid support on level 2. You can tell there aren't many shares available here. I bet a 100k volume day could move the ask to .50+ IMO
Nice to see buys lately. Hopefully we see a .10 break soon. Any news and it could fly past $1.00 easily imo
$MECK has some obvious accum going on - the upticks are solid movement upward
MecklerMedia Corp.
6M Outstanding Shares
Float must be under 1Million by now
Up over 1500% since 2016 Q4
3-D Printing Marketing exploding into a Billion Dollar+ industry.....a return would be huge
Nice buys... Still you onco or do we have another buyer in the house?
Let's see if we get more .09 hits tomorrow. I can't wait to see a .10 break
the awareness campaign has been very successful.
with accumulation and new shareholders means an even better chance of news coming out soon
MecklerMedia Corp. - if $MECK went back into business, tjeu would be able to fund raise beyond belief with that news alone
and base on the SS it wouldnt even put a dent on PPS unless they penny-stock-style fund raise
It's been all buys the last week or so. Float will get smaller and smaller as time goes on
MecklerMedia Corp. up almost 1500% since this Q4 2016
and if any development gains traction, this share structure is made to run multi dollars - we have all seen it happen with atrocious SS in dumpster penny land
$MECK
Outstanding Shares = 6 Million
Float = approx only 1 MILLION based on my personal accounting and tallying
Have a good weekend all, let's smoke the 9s next week and see silverland
GO MECK
This sounds like perfect RM play .you will win in the end......I think I will tag along
Its one reason why I think MECK could go multi dollars with any news or momo. So many shares are restricted from selling right now.
Thanks. It kinda sucks in a way holding so many shares since I can't sell unless something happens with the company.
Nice position my friend....congrats
I own over 15% of the company so my shares are restricted from selling right now.
Please explain your restricted shares,thanks
Insane potential with less than 400,000 market cap! No preferred shares or any of that. Could be worth over $10 with a DOLV type reverse merger. Looks like .09 might be the last chance for someone to get a decent block of shares under .10
After that, it won't take many shares at all for it to run to $1 since there are now so many restricted shares, which now include all the ones I own.
Yeah I could use a few more!
Hit .09 new 52 week high. Nice 50k bid someone has in
Nice .09 tap by someone
I think .09 is the last chance for a whale to get a large block of shares under .10 IMO
Hope to see another good day here. .09 tap would be new 52 week high.
Maybe we see .09's today? We need another wale in here!
One day we could wake up and see a 5,000% increase in pps if news or a filing were to come out. With only about 2 million tradable shares, meck could surprise many.
I dream of the day that meck is #1 on the breakout boards!
Nice chart! The current restricted shares is considerably higher now so the float is considerably lower now. Any news here could send it well past the $12 you see on the chart since there aren't nearly as many shares available now.
$MECK Share Structure and 2010-Present chart. Look what this beast is capable of with an active company at the helm.... Plenty of room in the authorized for a reverse merger and owner has the ability to hand over control via sale of his block


.04 is more than a safe price IMO. The value of the NOL's makes this worth a lot more IMO
.04 is a very safe price, at least IMO. I see shells all the time with bigger share structures laying idle in the .10+ range. May buy more soon
Very true. Looks like we have a .04 bid now.
Hard to tell what kind of ammo CANT has behind that 10k though.. Either way good block for anybody that wants a chunk
|
Followers
|
23
|
Posters
|
|
|
Posts (Today)
|
0
|
Posts (Total)
|
1012
|
|
Created
|
09/28/13
|
Type
|
Free
|
| Moderators | |||


| Volume | |
| Day Range: | |
| Bid Price | |
| Ask Price | |
| Last Trade Time: |


