 News
News  Market Data
  Discover
Support: 888-992-3836
Copyright © 2023 InvestorsHub Inc.


Register for free to join our community of investors and share your ideas. You will also get access to streaming quotes, interactive charts, trades, portfolio, live options flow and more tools.
#GDXJ: BLAST OFF...:-} $36 SILVER here we come...:-}
https://youtu.be/UJOjTNuuEVw
#GDXJ: FED FIREWORKS FRIDAY... KABOOM SILVER $36...!
I think GDXJ closes the gap around 43 bucks. Might take 2 or 3 weeks, but this severe retrace is turning into a mini bear market in metals, and a mini bull market in the dollar. wiping out 2/3rds of the gdxj move up from 29 to 66
#GDXJ: COMEX / LBMA Default coming...;-}
https://www.zerohedge.com/news/2020-03-20/window-purchase-precious-metals-fiat-currency-closing
https://www.gainesvillecoins.com
Disconnect between the Paper Price and Physical Price
There is a disconnect between on the one hand, the COMEX futures and London spot OTC market and on the other hand, the physical precious metals market.
Unless there is a very strong rally in the paper market that balances physical demand and supply, the disconnect between the paper market and physical market may widen until the paper pricing system (COMEX futures and LBMA unallocated system) implodes.
In a scenario where the paper spot market doesn’t rally to balance physical demand and supply, physical precious metals will no longer be priced based on the spot market. Bullion dealers will stop pricing metals. Many have already done so by suspending the accepting of orders.
When preferences in the derivatives paper spot and futures markets, which are unbacked or only partially backed by precious metals, differ from supply and demand in the physical market, prices disconnect.
#GDXJ: ALL IN NOW...:-}
BLAST OFF WEEK IS HERE...:-} Go Lowjack
CRYPTO-COIN $$$$$ GOING TO BLOW GOLD / SILVER EXPONENTIAL HIGHER...:-}
March is next Monday...:-}
https://www.youtube.com/channel/UCihX2iReqwRs49UT82i-P3Q
https://youtu.be/xtNYMA5aWJc?t=84
https://twitter.com/WallStreetSLVR
#GDXJ: BELOW THE 50 Day...:-} $47.23
#GDXJ: CRYPTO-COIN $$$$$ GOING TO BLOW GOLD / SILVER EXPONENTIAL HIGHER...:-}
March is next Monday...:-} Go OTC LIFE
https://www.youtube.com/channel/UCihX2iReqwRs49UT82i-P3Q
https://youtu.be/xtNYMA5aWJc?t=84
https://twitter.com/WallStreetSLVR
Just In: $GDXJ Comprehensive non-correlated Vaneck Vectors Junior Gold Min $GDXJ Trading Report
Celebrating 20 years, Stock Traders Daily provides the tools that help you develop investment strategies, and this is a good example. When we couple this with out market based analysis, the probabilities of going with the flow increases, and that is material over time. The Vaneck Vectors ...
Got this from GDXJ - Comprehensive non-correlated Vaneck Vectors Junior Gold Min $GDXJ Trading Report
Wake up pot company investors and bitcoiners. These gold juniors are just getting started
Shorts are pushing on a string!
$GDXJ GOLD IS DEFINITELY ?? ABSOLUTELY ?? GOING TONHIT OVER $2,000 AN OUNCE https://www.kitco.com/news/2020-04-20/Time-to-target-1-900-gold-price-here-s-the-timeline-TD-Securities.html
#GDXJ: The Gold Signal, Just Like 2008
First came the gold price take-down, and then came the Sunday night announcement. It’s just like late October, 2008…
by Dave Kranzler of Investment Research Dynamics
In 35 years of active participation in several diverse aspects of the financial aspects, I’ve never seen a more obvious investment set-up than long gold, silver and mining stocks:

https://investmentresearchdynamics.com/the-gold-signal-just-like-2008/
#GDXJ: More FUEL for lift off...;-}
https://www.zerohedge.com/commodities/bullion-bank-nightmare-lbma-comex-spread-blows-again
Bullion Bank Nightmare As LBMA-COMEX Spread Blows Up Again

Submitted by Ronan Manly, BullionStar.com
The gaping price differential between spot gold and gold futures that has been plaguing the paper gold markets in London and New York for the last three weeks shows no signs of abating and is continuing to flare up.
In essence, the contango phenomenon we are seeing is one of gold futures prices trading far above spot gold prices, a sign of liquidity problems in the London gold market and a signal that something is completely broken between the world‘s two predominant “gold price discovery" trading venues – which both, by the way, trade paper gold.
As a reminder, London LBMA trades unallocated gold over the counter (OTC), a form of synthetic fractional gold derivative. The vast quantities of unallocated gold which are traded in London are then netted and cleared in an electronic clearing engine called Aurum by 5 LBMA bullion banks that comprices London Precious Metals Clearing Limited (LPMCL), namely JP Morgan, HSBC, UBS, Scotia, and ICBC Standard Bank). Allocation of physical gold is a totally separate process beyond clearing in Aurum.
COMEX trades predominantly cash-settled gold futures contracts on exchange and facilitates the trading of these contracts bilaterally. COMEX futures are 99.9% cash-settled and even those that result in delivery really result in warehouse warrants changing hands but the gold staying in the New York vaults of JP Morgan, HSBC and Scotia.
That the wide-open spread continues to persist is even more remarkable, despite the best efforts of the London Bullion Market Association (LBMA), CME Group (operator of COMEX) and the powerful London-New York bullion bank syndicate to throw all they have at the problem.
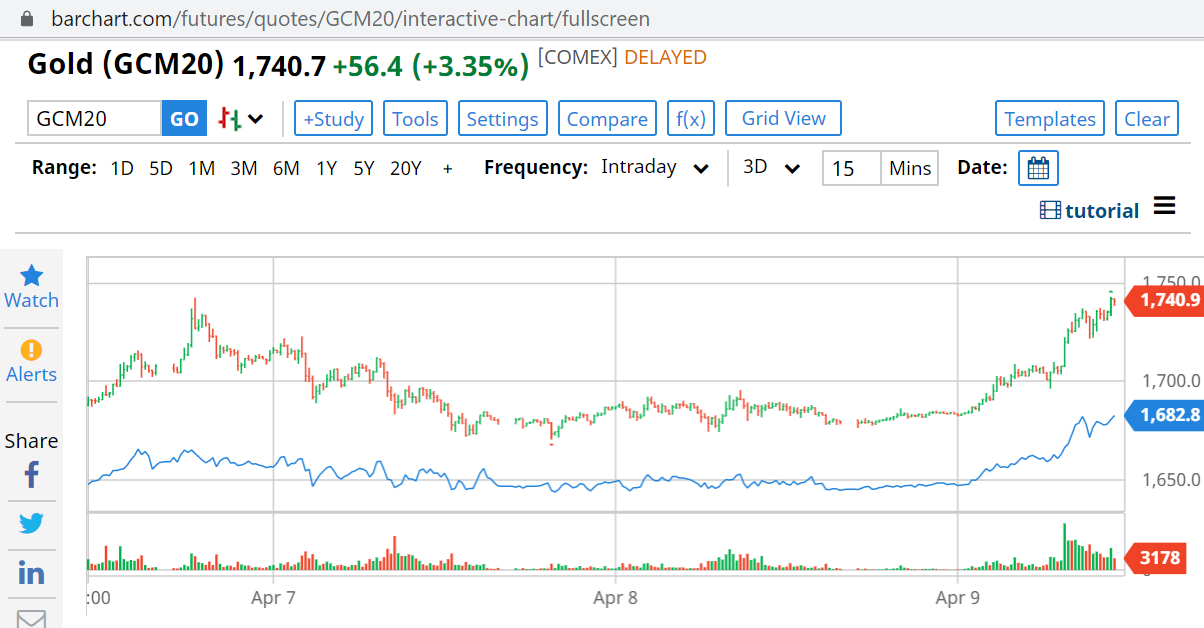
At the time of writing, spot gold was trading at US$ 1696 against US$ 1753 for the front-month (most actively traded) COMEX gold futures contract, a $36 spread with futures over 3.44% over spot. The spread we‘re referring to can be seen in the below 3-day chart, which plots June 2020 gold futures (red and green line) against spot XAUUSD (blue line) from 6 April to 8 April. Notice that over this time the futures price has stayed far above spot, and more importantly, it has persistently done so.
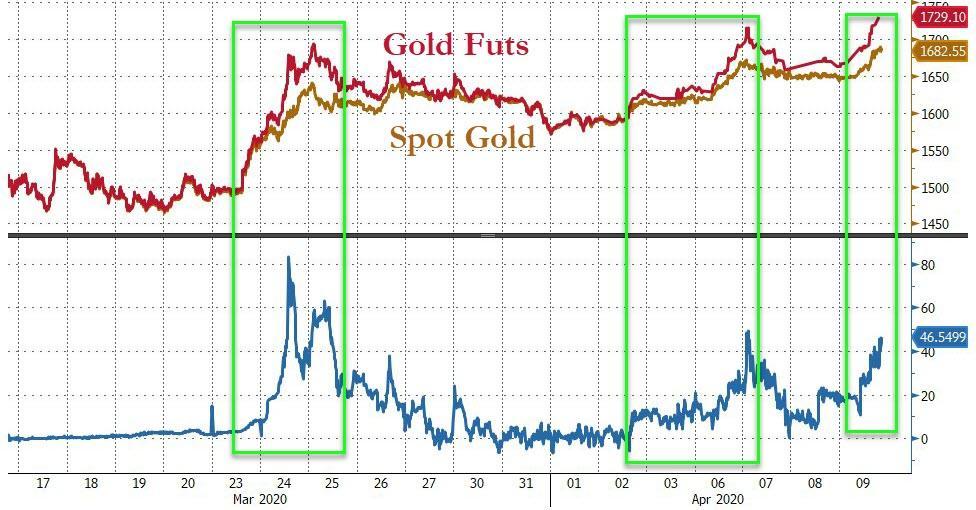
The spot-futures spread blow out that has been running into its third week now can vividly be seen by zooming out and looking at a similar chart but this time from 24 March until 9 April, the first day that the price spread between London and New York gaped open. Notice the big gaps between futures and spot over 24-25 March, the persistence of the gap over the remainder of the week, and the subsequent re-explosion of the divergence since early April, particularly over the last few days.
Three Weeks and Counting
Its instructive to review a short timeline of some of the events which have contributed to this ongoing saga over the last three weeks, because it shows that no matter what the LBMA and CME do, the spread between London and COMEX continues to stay out there.
Week 1
23 March – COMEX gold futures (April contract) begin trading noticeably above LBMA bullion bank spot gold prices.
24 March – Spreads between COMEX futures and London spot blew out to $100 at one point during the day, while bid – ask spreads within London spot widened substantially.
24 March – Rumors in the gold market suggested that bullion banks that were required to deliver physical gold for COMEX Exchange for Physical (EFP) transactions failed to do so, suffered losses and exited the market, and that this caused the Spread between COMEX and London to widen substantially.
The bullion bank controlled LBMA releases its first control statement, deflecting attention away from London, saying it will help (essentially collude with) the CME-COMEX in the gold market – The official language is that the LBMA “is working closely with COMEX and other key stakeholders to ensure the efficient running of the global gold market."
Note – Who are these other key stakeholders, what do they mean by efficient running, and what gives them the right to think they can “run“ the global gold market?
24 March – LBMA and its bullion banks pressure CME to launch a gold futures contract with a deliverable clause in London 400 oz gold bars.
24 March – At end of day, CME announces the launch of a new gold futures contract that can theoretically deliver 400 oz bars, 100 oz bars and kg bars but that uses a fractional paper concept called Accumulated Certificates of Exchange (ACEs) to divide 400 oz deliverable bars into 100 oz bars, and that critically includes all refiner brands on the LBMA Good Delivery List (current and former Good Delivery refiners). This contract will be called 4GC (See here and here).
See BullionStar article “LBMA colludes with the COMEX – To lockdown the global gold market?" for background to the above.
25 March until end of March – For the rest of the week, disinformation from bullion banks to mainstream media about flight cancellations and refinery closures preventing bullion banks delivering gold from London to New York thus causing prices on COMEX and London to diverge. See here, here, here and here for examples. From the below chart you can see that there is never any gold exported from London to New York.

Week 2
30 March – CME published its daily gold vault stocks report (for Friday 27 March) with a new category for “400 oz AND eligible brands", but with all vaults showing zero stocks of 400 oz gold bars. And notably, that the JP Morgan vault in New York had zero holdings.
30 March – When Bullionstar draws attention to this new CME vault report, in “COMEX can’t find a 400 oz bar for its new 400 oz gold futures contract“, the CME then deletes the new report from its website on the morning of 31 March, and replaces it intra-day with a report which reverted to the original version.
1 April – LBMA and CME publish an unprecedented second control statement titled “LBMA and CME group comment on healthy gold stocks in New York and London”, saying that “CME Group and LBMA..will continue to coordinate efforts as market circumstances evolve”. See “LBMA and COMEX try to Reassure the Market – Twice in One Week“ for background.
Note – If LBMA and CME are trading gold bars, why would they need to coordinate efforts, and more importantly, coordinate efforts to what end?
LBMA disingenuously refers to 8326 tonnes of gold in London, a figure that is from 3 months ago, and nearly all of this total tonnage is central bank gold, gold held in ETFs, and allocated gold held by other investors. The real float of physical gold in the london LBMA gold vaults controlled by the LBMA bullion banks is less than 1000 tonnes and some estimates from sources in the bullion banks say it could be between 300 and 500 tonnes.
In the same statement, CME refers to 9.2 million ozs ( 287 tonnes) of gold held in its approved vaults, with irrelevant claims that 5.6 million ozs of this is eligible gold. Eligible gold is gold which just happens to be in the form that satisfies the deliverable unit of the contracts (1 kg bars or 100 oz bars). The rest of this figure is registered gold, which already has warehouse warrants attached.
2 April – The spread between COMEX gold futures prices and London spot gold prices starts to gap up strongly again.
Rest of week – CME Group releases publicly a PowerPoint slide presentation titled “Precious Metals Physical Delivery Process”, which includes the new 4GC contract and explains how to get an electronic warrant if standing for delivery of COMEX gold futures contracts, but that explains nothing about withdrawing gold from the COMEX vaults.
The COMEX presentation also features a slide discussing the COMEX New York approved vaults but unbelievably instead of showing photos of one of its approved New York vaults, this slide contains photos of a HSBC gold vault in London showing gold bars belonging to the exchange traded fund, the SPDR Gold Trust (GLD). This GLD gold has nothing to do with COMEX gold vaults in New York (or does it?).

Week 3
6 April – The spread between the COMEX June gold futures contract and the LBMA spot gold price blows out again very widely to over $80 at one point in the day.
6 April – CME adds back the category “Enhanced Delivery (400 oz AND eligible brands)" to its New York daily vault report. Of the 9 vaults on the report, 5 have 0 holdings in this 400 oz category, 2 (Brinks & Loomis) have a combined 2 tonnes, HSBC claims 21.5 tonnes, JP Morgan appears for the second time, claiming 126.8 tonnes. The first time being 30 January when JP Morgan was listed as having zero tonnes of 400 oz bars.
Note – “400 oz AND Eligible Brands" will be the subject of another article soon, but for now it means as follows. For the new 4GC contract, CME added all LBMA Good Delivery gold bar Brands (Current and Former) as Eligible brands. That’s 68 brands from the existing GC100 contract + 71 brands from the LBMA current Good Delivery List + another 113 LBMA former Good Delivery List.
As another aside, where did the JP Morgan New York vault suddenly get 126.8 tonnes of gold suddenly to add to Eligible category for the COMEX 4 GC contract? Was this 126.8 tonnes of gold suddenly shipped in to the JP Morgan vault from London? Hardly. Were 126.8 of London Good Delivery gold bars already sitting in its New York vault. Probably not as its London and not New York which is the center of 400 oz gold bar storage. Was there some type of gold swap involved between London and New York. Possibly.
Another intriguing possibility is that now that former LBMA Good Delivery List gold bars are eligible for the new 400 oz contract, that JP Morgan borrowed Old US Assay Office gold bars from the New York Fed (their two gold vaults are beside each other), and then added these to the Eligible category for the new 4GC gold contract.
Root Cause of Spot vs Futures Gold Price Discrepancy
So what is the cause of this dislocation in pricing between the lower ‘spot’ price and the higher ‘futures’ price, i.e. between the London LBMA gold spot market and the New York COMEX gold futures market? The answer in general is that the problem is with the spot price. And where is the spot price? London.
Ironically, the LBMA bullion banks are trying to shift the attention away from London, when London is exactly where the problem is. The spot price problem appears to be due to liquidity problems of the LBMA market makers in London where they are suspicious of trading with each other. This is despite the fact that these LBMA market makers are obliged to constantly make a market and offer two way price quotations to each other. These market makers are BNP Paribas, Citibank, Goldman Sachs, HSBC, ICBC Standard, JP Morgan Chase, Merrill Lynch, Morgan Stanley, Standard Chartered, Bank of Nova Scotia, Toronto-Dominion and UBS.
The spot price problem has nothing to do with air travel cancellations or shipments of 100 oz gold bars from London to New York. These market makers do not make markets in physical gold. The unit of trading in London is not real gold anyway, its unallocated gold or gold credit which is issued by a bullion bank and which has counterparty risk.
Something has spooked these market makers and caused a drop in liquidity in the London market. These banks, which normally trade with each other, now do not want to trade with each other due to heightened counterparty risk. Unallocated trading volumes in the London gold market have fallen over the last three weeks. See chart below.
Likewise, according to Bloomberg, COMEX gold futures trading volume last week was 80.6 million ounces, a 72% drop compared to the end of February. From the same Bloomberg article, there is an intriguing and obviously dramatic quote from commodities broker Marex Spectron, saying:
“You have a bunch of shell-shocked market makers who are literally hiding under their desks and do not and possibly can not make markets in any size, shape or form,” said David Govett, head of precious metals trading at Marex Spectron. “Hence we have the lack of liquidity, the small volumes and the wide spreads.”
Marex is a broker for EFPs, so maybe the LBMA market makers are not answering calls. Then they are failing in their duty and obligations as market makers. But why would market makers not want to trade and how does this relate to EFP spreads? If banks suffered EFP problems and then the EFP spread between London and New York blew up, and then they use the excuse that the EFP spread is too large for them to make a market in spot because they don’t want to take on risk, then that’s just circular logic and a pathetic excuse. But what causes LBMA market makers to become shell shocked and literally hide under their desks?
Could it be that the gold trading activities of some of these LBMA bullion banks have blown up and they have ceased their market making activities, but have not publicly stated this, and covered it up? Stranger things have happened. All the while, as trading volumes continue to fall in the paper gold markets of London and New York, the opposite is the case in physical gold markets, where BullionStar and other bullion dealers – those that continue to have inventory – see unprecedented demand and increasing trading volumes.
This article was originally published on the BullionStar.com website with the same title "Bullion Bank Nightmare as LBMA-COMEX Spread Blows Up Again".
#GDXJ: The Next Hot ETF...:-}
https://www.silverdoctors.com/gold/gold-news/gold-contracts-default-deliveries-rationed-in-london-andrew-maguire-says/
Just give it time Lowjack,,,I'm loading all I can now...!
Foreign-exchange price ratios now imply a gold price well above $2,000 and a silver price above $50.
https://www.youtube.com/watch?time_continue=1000&v=4fM66h1fZQo&feature=emb_logo
https://youtu.be/4fM66h1fZQo?t=1088
Gold at Multi year highs but GDXJ Still down 25%!
#GDXJ: GLOBAL SILVER SUPPLY COLLAPSE ON ITS WAY...!
https://www.silverdoctors.com/silver/silver-news/steve-st-angelo-global-silver-supply-collapse-on-its-way/
We now have the perfect storm for silver. Steve St. Angelo explains…
by Steve St Angelo of SRSrocco Report
Due to Mexico’s Ministry of Health issuing an Executive Order for the immediate suspension of non-essential activities until April 30th, the mining industry in the country has now come to an abrupt halt. The mining industry was hoping for an exemption to the Executive Order, but was not granted one. So, companies are now suspending production and putting their mines on care and maintenance.

According to the article on the Mining Journal website, Mexico mining suspension to hit silver supply:
Under the government decree, non-essential activities are to be suspended immediately until April 30.
The decision is expected to have a significant impact on the supply of silver at a time when demand for silver coins is high. Mexico is the world’s largest silver producer at some 23% of world production and produced more than 200 million ounces in 2019, up from 196.6 million ounces in 2018.
With Mexico shutting down its mines, including the continued closure of Peru’s Mining Industry announced on March 15th, nearly 40% of global silver production is offline. Peru’s government stated that the national quarantine would last 15 days. However, we have passed that point, and there is no announcement of a return back to work.
Here are the top ten silver producing countries in the world in 2018:

In 2018, Mexico and Peru accounted for 342 million oz of silver production. If mines in Mexico and Peru remain shut down for a month, that will cut silver production by 28 million oz. So, each month that Mexico and Peru are offline, would reduce silver mine supply by 28 million oz. However, I believe we are going to see more countries shut down their mines for an extended period as the global contagion continues to spread.
Today, Newmont and Pan American Silver announced closures of mines in Mexico. Newmont is now ramping down production at is massive Penasquito Mine, which produced 18 million ounces of silver in 2018:

Also, Pan American Silver announced the shutdown of its La Colorada and Dolores mines in Mexico. These two mines produced 13.3 million ounces of silver in 2019:

As we can see, the mining industry is now being shut down due to the global contagion. It will be interesting to see when Peru’s government announces a return to work policy. Again, it has been more than 15 days since Peru announced a national quarantine with no indication yet of a return to work.
With Mexico, the largest silver producing country in the world now on lockdown, the collapse of global silver mine supply is underway. The shutdown of silver mines throughout the world is taking place when investors are buying a record amount of physical silver bullion. This has now become a PERFECT STORM for the silver price going forward.
Here was my article posted yesterday: U.S. Silver Eagle Sales Surge Past 5 Million In March: Availability At Low Prices… CHECK HERE

$GDXJ Mining Stocks Set To Rally? This Gold Spread Says Yes!
https://www.seeitmarket.com/mining-stocks-set-to-rally-this-gold-spread-says-yes/
They're trying to fill that gap! Stretching the rubber band really tight to do it too!
Sue the Fed and subpoena the trade data!
Every chart looks the same! Too many indexes and ETFs!
#GDXJ: GOLD & Silver Break Free From the Paper Chains....:-}
https://www.silverdoctors.com/headlines/world-news/gold-and-silver-break-free-from-their-paper-chains-david-brady/
What happens in the real world (not the paper monopoly world) when demand soars and supply disappears?
by David Brady via Sprott Money
Last week I wrote “Paper Prices Dump, but Premiums for the Physical Metals Soar on Heavy Demand”. My sincere thanks to the many Twitter followers who alerted me to this phenomenon around the world almost two weeks ago now, in which prices for physical Gold and Silver were soaring and inventories were fast running out. Despite encroaching censorship, Twitter still remains an important tool for sharing valuable information. Since then, Silver prices reached a peak of around $35 CAD and ~$25 USD, but that was as of last Friday. It is now almost impossible to know what the real price is, because inventories have disappeared. It could be much, much higher now. We just don’t know.
The final confirmation that Gold and Silver supply had almost run out came last Friday from the Royal Canadian Mint, home of the Maple Leafs (no, not the hockey team, the coins):
h/t @TFMetals

Moving to the demand side of the equation, Eric Sprott stated in a public interview last Friday that demand had increased “10x” in the past week alone.
youtube.com/watch?v=clzlYl1T6DI&feature=youtu.be
What happens in the real world (not the paper monopoly world) when demand soars and supply disappears? Economics 101, the price goes vertical. This is exactly what was happening to physical Gold and Silver.
If that were not enough, we got even more incredible news on Sunday:
https://youtu.be/clzlYl1T6DI?t=4


#GDXJ: Gold’s Gone Wild!
https://www.zerohedge.com/news/2020-03-26/golds-gone-wild
Headline’s gone wild today. For example, one public gold company CEO tweeted:
“Today, some banks failed to deliver physical in the COMEX bar EFP. As a result, these banks suffered large losses…There remains a big shortage in physical in the COMEX denomination. So, rumors are, the COMEX will announce a force majeure…”
Ignoring his sloppy understanding of the market and its terminology, this tweet gives us a sense that you better buy gold now before it’s too late.
Or, consider this headline:
“Gold bid/offer spreads blow out to $100 in loco London market”
The bid-offer spread is normally $0.20, so $100 would indeed indicate crazy market conditions.
Finally, this Zero Hedge article says:
"Last night, when observing the unprecedented ‘gold run’ on precious metals dealers which has left all gold vendors with little to no physical gold, we said that ‘the price of physical gold has decoupled from paper gold’ as a result of paper gold liquidations as leveraged funds scramble to cover margin calls using safe assets...
…resulting in an arbitrage that physical gold buyers, i.e., those who don't have faith in gold ETFs such as the GDX or simply prefer to have possession of the metal, find especially delightful as it allows them to buy physical gold at lower prices than they would ordinarily have access to.
However, we also noted that whereas in the past such conditions were self-correcting, this time it is not only a record surge in demand for physical gold but also a near shut down in supply as the most productive gold refiners, those located in the southern Swiss town of Ticina, namely Valcambi, Pamp and Argor-Heraeus, now appear to be offline indefinitely.
…and on Tuesday morning the divergence that was barely noticeable late Monday has blown out to unprecedented level, with gold futures decoupling and trading far above spot prices.”
As an aside, this snippet contains several errors. One, as we explained, “The price of small bars and coins, which are retail products, can vary considerably from the price of gold in the spot market. This is because manufacturing capacity, especially for minted bars and coins, is finite. Mints are reluctant to buy expensive machines (with debt financing, of course) to expand capacity for a boom that they know from prior experience can be fleeting.”
Two, GDX is an ETF—which holds shares of gold miners. In any case, distrust of ETFs has nothing to do with the arbitrage opportunity, as we shall see below.
Three, virtually all of the gold mined in thousands of years of human history is still in human hands. The closure of three Swiss refiners will definitely have an impact—on the supply chain, including the miners. But, it has little effect on the supply of gold. This is because all of that gold accumulated over thousands of years is potential supply, under the right conditions and at the right price.
Finally, it is contrary to the story of gold shortage to say that futures are trading far above spot. This is a description of a high and rising gold basis, which means rising abundance of gold to the market. Here is a picture of the June gold basis.
http://monetary-metals.com/wp-content/uploads/2020/03/au_basis_2020-03-24_60-day.png
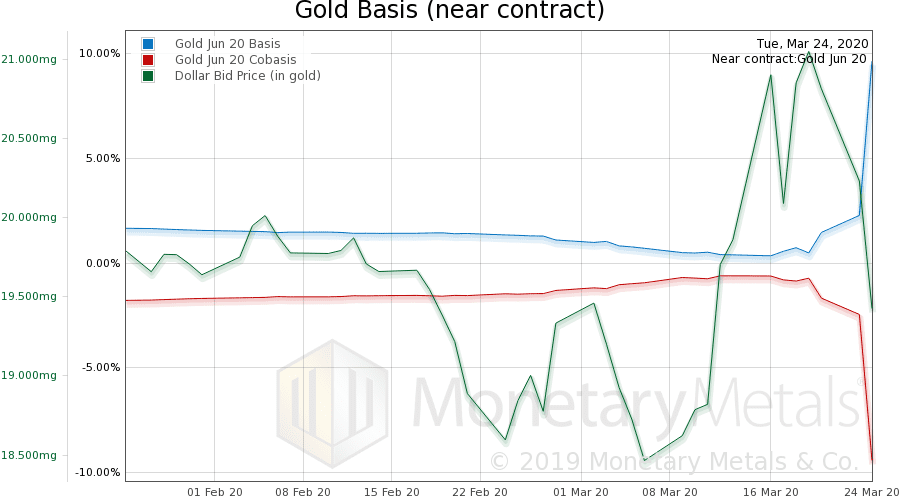
Note the incredible rise of the basis to 10%. There hasn’t been a basis nearly that high since February 2006 (when it was 9%). Of course, back then, the interest rate was much higher.
If this basis is indeed real, and not just an artifact of volatility, it would indicate massive abundance in the gold market (good delivery bars, not necessarily retail-sized products).
Now, let’s look at the real bid-offer spread for gold.
http://monetary-metals.com/wp-content/uploads/2020/03/monetary-metals_gold_price_vs_spread_mar_24.jpg
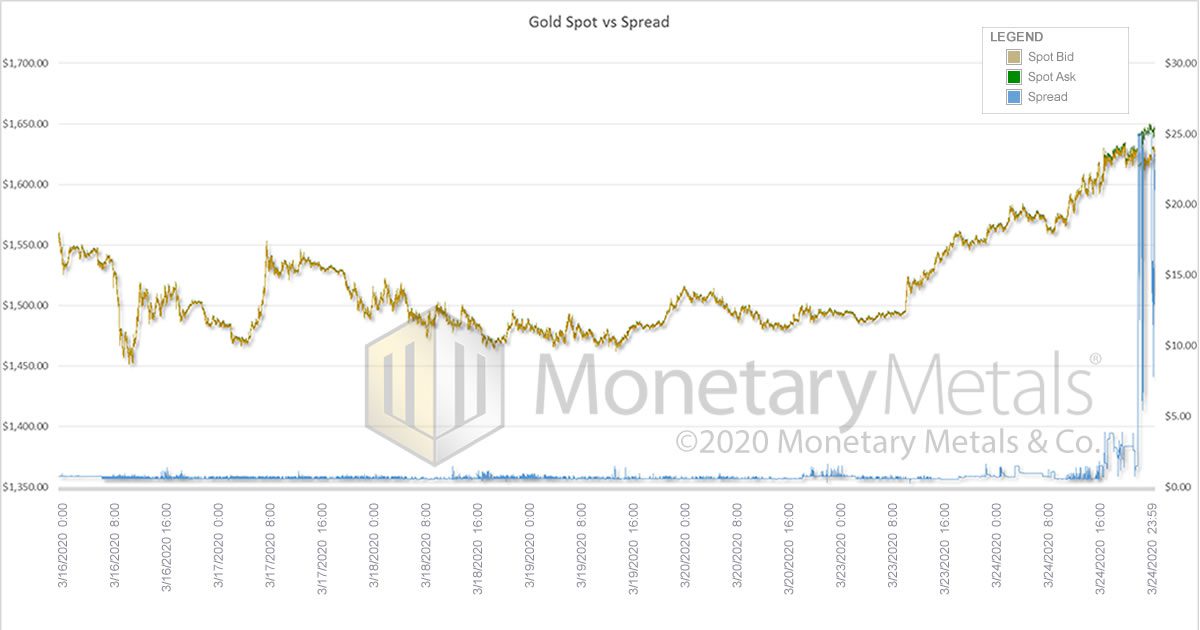
This graph shows from Monday, March 16, through Tuesday, March 24. It may be hard to see that the bid-offer spread is rising on Monday. But, Tuesday it completely blows out. We do not see $100. It’s possible that there were brief spikes to that level, but even on our hi-res graph it only gets up to $25.
$25 is extraordinary enough without having to get to extra-extraordinary $100.
Spreads, including the bid-offer spread, are normally stable. So, when a spread blows out, it’s telling you something. When a spread hits a historic high, it’s telling you something big. Here’s a long-term graph of the bid-offer spread in gold and silver:
http://monetary-metals.com/wp-content/uploads/2020/03/spot_spreads_2020-03-24_4800-day.png
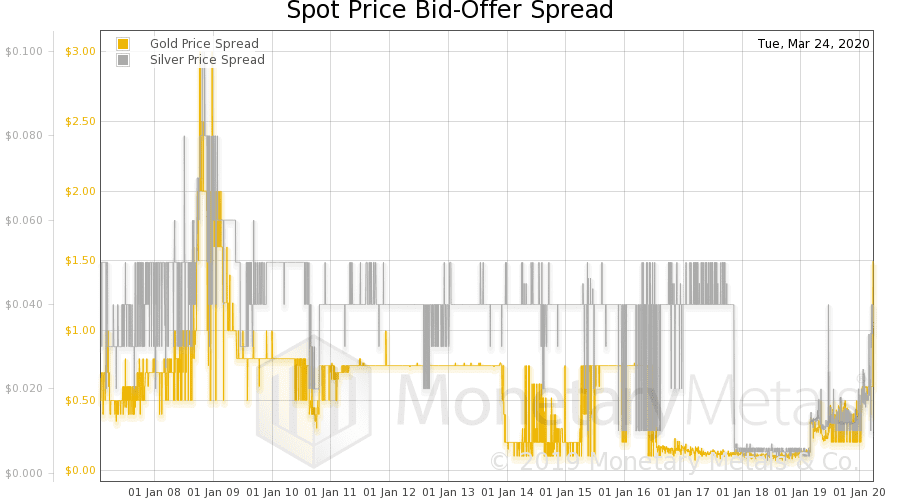
Note that the value for Tuesday shows only $1.50 (the reasons are technical and outside the scope of this article). But, even with this low reading, the only time that we see a spread like this is in the crisis of 2008—from mid-September 2008 through February 2009.
It’s not telling us that gold is scarce. Particularly, combined with the high and rising basis, we cannot come to that conclusion.
What a widening bid-offer spread means is: falling liquidity and volume. This would certainly fit with the three major Swiss refiners exiting the market, not to mention challenges in transporting gold amidst the panic of this virus.
The key question, however, is: “Is part of the reason for a decline in gold liquidity that the financial system itself is under stress?”
Here is a graph showing back to September 2016.
http://monetary-metals.com/wp-content/uploads/2020/03/spot_spreads_2020-03-23_1300-day.png
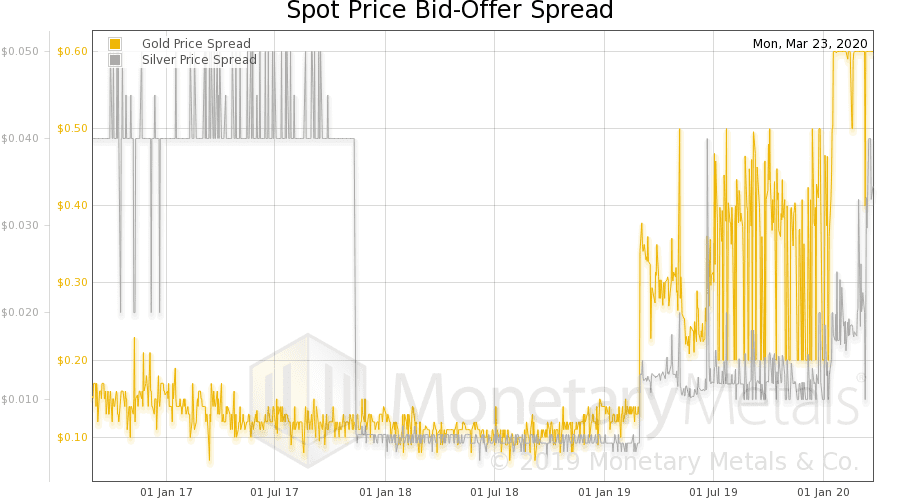
Ignoring silver, we see that the bid-offer spread in gold is around $0.15 to $0.20 falling to a pretty steady $0.10. Abruptly, on March 1, 2019, the bid-offer spread triples. For the last year, it has been both elevated and quite volatile, spiking many times well above $0.40. In mid-January this year, it spikes above $0.50, and with volatility remains at this new higher level.
The virus has been with us only about three months, but the bid-offer spread in gold has been elevated for over a year. Clearly, there has been a problem in the gold market (or the financial system) for a while.
Gold is the most liquid commodity because it is the most marketable. Students of Austrian economics will recall that Karl Menger defines money as the most marketable commodity. The bid-offer spread is the measure of the loss you would take to trade in and out of the commodity. Gold has always offered the least losses, the least friction, and hence makes the best money.
But now, this is breaking down. Is this a sign that gold is losing its money-ness?
Are you kidding?! In this period of central bank action so crazy it makes the unconventional monetary policy after the crisis of 2008 seem normal by comparison, it is the dollar that should worry about losing its money-ness (or currency-ness, the dollar not being money in the first place).
Many would say that gold is unique in another respect. We have seen economists give keynote speeches in which they assert that, at the end of the day, gold will withdraw its offer for sale. What follows from that premise is an elaborate chain of logic to explain why and how it could be the one exception to the rule.
We argue that the rule is simply: in times of stress, it is always the bid, and never the offer, which is withdrawn. The only way to understand gold’s behavior is to wrap your mind around the fact that gold is money. It is money that withdraws its bid on other things. Don’t try to think in terms of irredeemable currency bidding on money, with money withdrawing its offer. That would be akin to the Medievals believing that the sun and planets orbited the earth. What followed was an elaborate chain of logic to explain the motion of the planets (i.e., retrograde).
We have a conundrum. High and rising basis indicates abundance, widening bid-offer spread indicates discoordination in the market and is a harbinger of price volatility. It is doubly perplexing because the wider spread should cause a lower basis reading. Recall that:
Basis = Future(bid) – Spot(offer)
A wider spread normally means a higher offer price and a lower bid price. Thus, the basis will be lower than it would be if the spread were normal (and the cobasis would be lower, too). So, a basis reading of 10% at the same time as the bid-offer spread blows out is even more extraordinary.
Assuming that the wider spread and the high basis are not merely anomalies, not just artifacts of our data collection methodology in a volatile market, then we must ask: what if things aren’t behaving normally? What if the bid and offer prices did not move symmetrically?
In other words, what if the bid dropped or the offer lifted? And, we’ll focus on a dropped bid because of the high and rising basis, which means abundance.
If gold suddenly becomes much more abundant to the market than it had been, then it would be reasonable to expect that the marginal buyer would drop his bid.
Before we attempt to identify the marginal buyer, consider the arbitrage of buying spot (at the offer price) and simultaneously selling a futures contract (on the bid price). On Tuesday, this arbitrageur could make 10% (annualized). In a world of zero and negative interest rates, where even the 10-year Treasury yields well under 1%, this should be a pretty attractive trade.
Yet, for some reason, no market participants were willing to take the trade until the profit to be earned hit 10%. Who are these shadowy non-participating market participants? We will give a hint.
To put on this trade, all you need is credit. You borrow dollars, buy gold, and sell a future. And, if you think about financial system breakdown and permanent gold backwardation, you are even on the right side of the trade. You own a bar of metal, and you are short a future. In financial Armageddon, the price of futures will collapse at least relative to the price of physical gold.
So, whatever the reason these shadowy non-participating market participants aren’t participating, that reason is not fear of Armageddon. Therefore, the reason is: lack of credit. One needs credit to put this trade on, and no matter how attractive the trade may be, if you don’t have credit then you can’t play.
Normally—at least, what has passed for normal in the Fed’s mad monetary machine—unlimited credit has spilled forth from the Fed’s spigots like effluent. However, this flow is diminishing and/or the thirst for it has been growing.
This fits with the Fed’s actions as of mid-September 2019, to be the repo lender of last resort (of only resort). And, the Fed recently announced that it cut the Fed Funds Rate back down to zero again. And, most recently, the Fed announced that it will be buying mass quantities of both Treasurys and mortgages. There is now talk that the Fed may buy the debt of corporations. All of this flailing is a desperate attempt to pump credit effluent from the spigots again. We shall see.
In the meantime, the banks can’t get the credit they need (something to think about, for businesses who have the choice to borrow in gold rather than dollars). And this brings us to the answer of who is the shadowy non-participant. It’s the banks and/or major funds which are clients of the banks.
As credit recedes, the net effect is it becomes more expensive. Think of borrowing at X% and carrying gold at Y% as an arbitrage. As X goes up, so does Y necessarily go up proportionally. And, therefore, the bid on spot drops.
One last principle must be explained. We said, above, that carrying gold is buying at the offer price (and selling a future on the bid price). But, consider that the banks are market makers. The market maker is the only market participant who can buy at the bid price because the bid price is the market maker’s bid. So, unless the market maker is aggressively adding to his gold carry position, he will normally sit content to wait for a seller to sell on his bid.
Now, with his cost of credit high and rising, his bid is low and falling.
While we’re at it, let’s clear up one last error. We have seen commentary claiming that the cost of leasing gold is now a king’s ransom. So, let’s look at a graph of the gold lease rate.
http://monetary-metals.com/wp-content/uploads/2020/03/au_lease_6m_2020-03-24_150-day.png
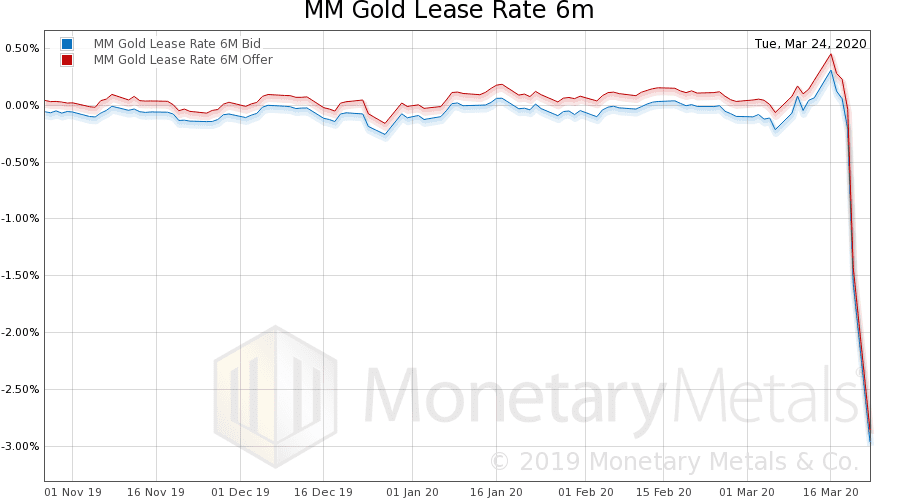
It should be pretty obvious that the lease rate has collapsed. The collapse is very sudden starting on Thursday, March 19.
Recall that the gold lease rate is:
Lease Rate = LIBOR – GOFO
In other words, either LIBOR (the bank cost for credit) has dropped through the floor, or else the gold forward rate (closely related to the basis) has skyrocketed. We saw, above, that the basis has skyrocketed. The dropping lease rate is confirmation that gold is abundant. You’d expect that the cost to lease something would rise in case of scarcity and fall in case of abundance.
#GDXJ: BAIL OUT NATION...:-}
Peter Knows whats next...:-}
No dinner for these boys, The trading must go on!!!
GO GDXJ!!!
$35.00 coming!!
#GDXJ: Could be a good fit...:-}
#NAK
http://www.northerndynastyminerals.com/
$NAK The world-class Pebble Project in Alaska is in federal permitting and being advanced toward development by Northern Dynasty.
The Pebble Project is the most significant undeveloped copper and gold resource in the world. https://www.northerndynastyminerals.com/ $GDXJ
#GDXJ: Best Time is Now...;-]
#GDXJ: Peak Schiff Season...:-]
Gold will be the only safe haven left standing – Ep 536
#GDXJ: GOLD GOING TO THE MOON...
Big bounce coming!!! Gold is back up over $1500 an oz.
Sounds just like a slot machine paying off!
Healthy consolidation in gold and silver. Stock markets in a MASSIVE bubble. It will pop and gold and silver owners will be rewarded handsomely. Keep buying IMO
remember the key assumption, that gold and silver are in a bull market. That is it, simply stated. I believe the fundamentals show completely that we are. Price will come somewhat later. and then VOLUME WILL CONFIRM...
RIGHT NOW PRICE IS DICEY.......hey this is a pullback
Volume is non existent.
Funds will commit and you will see volume come into the Big Four: gdx, gdxj, sil and the most rocket like of all, silj.
and then later, you will see retail appear, and this message board will be very crowded.
in the meantime, I continue to write these missives to myself. Study the careers of albert einstein, or better yet, Sir Isaac Newton, he of newtonian physics. Newton used to lecture in empty classrooms to himself and just 2 or 3 students, max, and if the kids got sick, etc, he would lecture to himself. Time will tell.
I am a buyer today once again, having bought late yesterday afternoon. We are very close to a move higher, if this is a bull market. This index has been lollygagging around, digesting its gains, for perhaps a month and a half now.....We are retesting support. I think it holds, but who knows.
Rule 1: if you are in a bull market, which is an unusual thing, the pullbacks should be relatively short in duration, and then the bull shrugs all the disbelievers off, and trudges higher.
I cannot imagine we won't be higher a week or two or a month from now.
We shall see....
obviously my suggestion to buy for a bounce at 38.6 was very bad. Today was an extraordinary day, as gdxj had a 4 dollar swing from the open to the close, never saw that before in one day. look out for more
now is a good time to buy, gold is down $40, the new longs getting paniked out of the etf..and these are everybody who bought 40 to 42.7.....
excellent time to buy back in
I just tripled my position
for those following me, I have deployed a major part of my portfolio into this etf the past several days. Will detail why later. Actually a ton this a.m. on the open, and a lot yesterday afternoon,...
delighted to say i bought today at 31.80; not happy to say I could have bought a month ago at under 30 bucks, but o well. I am looking for gold to end its slump here. Making a macro call. I think the world starts a rate war lower. "everybody's doing it."
Gran Colombia Gold Is a Great BUY -
The Canadian miner has several catalysts
June 05, 2019 | About: TPRFF +0% TSX:GCM +0% GOLD +0% GDXJ +0%
http://www.grancolombiagold.com/news-and-investors/events-and-presentations/presentations/default.aspx
https://investorshub.advfn.com/boards/read_msg.aspx?message_id=149231566
https://www.gurufocus.com/news/889968/gran-colombia-gold-is-a-buy-
Gold Market Update - originally published
Sunday, May 19, 2019
Gold and silver dropping back again late last week had investors in the
Precious Metals sector feeling despondent, especially as their fears
were magnified by at least one analyst calling for gold to drop to the
low $900’s or even lower, which is normal when prices sink, but our
charts are instead suggesting that gold and silver are close to
completing giant bottoming patterns that started to form (in the case
of gold) as far back as 2013.
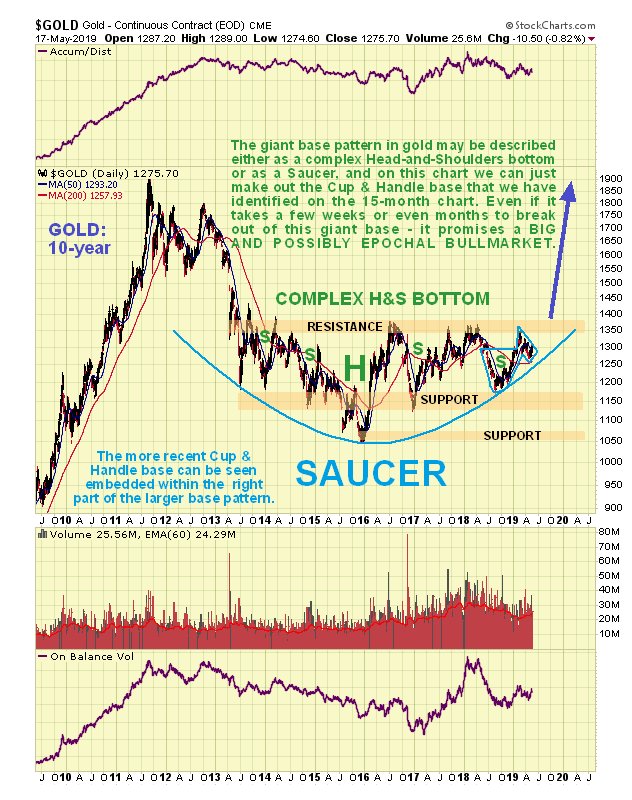
We can best see gold’s potential giant base pattern on a 10-year chart.
It can be described as a complex Head-and-Shoulders bottom or as a
Saucer, and is best considered to be both, or perhaps as a hybrid
having the characteristics of both patterns.
In any event, as we can see on this chart, it appears to be drawing
close to breaking out of it, which will be a very big deal if it
happens, because a base pattern of this magnitude can support a massive
bullmarket.
As for timing it could take several months and it is most likely to
happen during gold’s seasonally strong period from July through
September.
To maintain the bullish case it must stay above the Saucer boundary.
Embedded within the giant H&S or Saucer base pattern, a fine Cup &
Handle base has formed over the past year which we can see to advantage
on the 1-year chart.
The Handle part of this pattern may be regarded as a period of
consolidation / reaction that has allowed time both for the earlier
overbought condition arising from the rally from November through
February to unwind and also for the moving averages to slowly swing
into a much more favorable alignment, which has now happened.
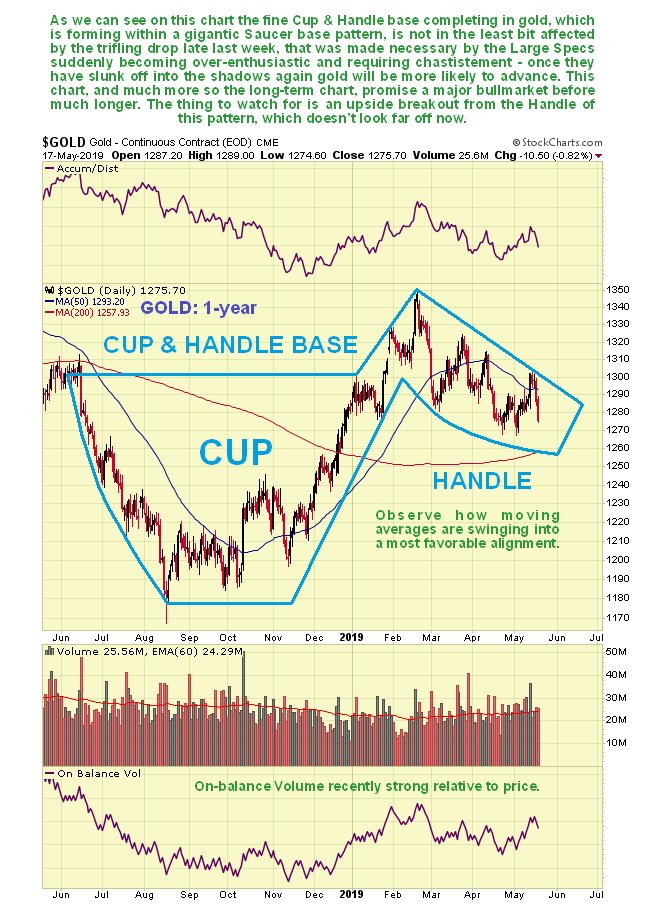
On both of the above charts the drop late last week looks like “a storm
in a teacup” or given the pattern shown on the 1-year chart, a storm
just outside a teacup, and latest COTs reveal the reason for it –
the Large Specs had suddenly become too bullish, which meant that they
needed to be disciplined.
While COTs have doubtless improved as a result of the drop on Thursday
and Friday (we won’t find out until next week), the Large Specs may
require some more time in the correctional facility, especially as June
and July are not seasonally good months for the Precious Metals, so it
would not be surprising to see some more downside during the weeks
ahead before both gold and silver take a turn for the better from July
onwards.

The following seasonal chart shows that June tends to be somewhat
negative for gold on average, although it won’t be this year if Iran is
attacked.

The conclusion is that the big picture for gold and silver continues to
look strongly positive, although we may first have to contend with
weakness between now and July due to the current downtrend coupled with
negative seasonal factors until the end of June, which should present a
window of opportunity to build positions across the sector ahead of the
expected late Summer advance that promises to be very substantial if
gold succeeds in breaking above the key $1400 level.
End of update.
By Clive Maund
In GOD We Trust -

http://www.kitconet.com/images/live/au0001wb.gif
Gold & Silver is the only REAL Legal Tender -
by The Founding Fathers for your -
Rights, Liberty and Freedom -
http://www.biblebelievers.org.au/monie.htm
God Bless America
Ps.
opinion appreciated
TIA
“...Trump Picks Gold Standard Advocate Herman Cain For Federal Reserve Board
(Kitco News) - U.S. President Donald Trump is planning to nominate Herman Cain, former Republican presidential candidate and a long-standing gold bug, for a seat on the Federal Reserve Board, according to media reports. BTW, I love the idea of Herman Cain being nominated for...
https://www.kitco.com/news/2019-04-04/Trump-Picks-Gold-Standard-Advocate-Herman-Cain-For-Federal-Reserve-Board.html?_ga=2.12083895.242814415.1554323333-1943498723.1554323333
Kerr Mines Drills 12.2 Meters of 11.7 g/t Gold at Copperstone
https://www.nasdaq.com/press-release/kerr-mines--drills-122-meters-of-117-gt-gold-at-copperstone-20190404-00195
The drill results are amazing for a first batch so load up the back of your pick-up truck with these KERR shares before the Golden KERR train leaves the Copperstone station in the heart of Arizona ...
http://www.sprott.com/
https://www.nytimes.com/2019/04/04/world/europe/brexit-extension.html
https://www.theguardian.com/politics/blog/live/2019/apr/05/brexit-latest-news-developments-live-theresa-may-writes-to-eu-requesting-another-article-50-extension-but-only-until-30-june-live-news
Brexit: UK asks EU for further extension until 30 June
https://www.bbc.com/news/uk-politics-47825841
Gold Prices $10,000 With This Ammo About to Ignite
https://www.thestreet.com/story/14402093/1/gold-prices-and-federal-reserve.html
$GDXJ Trump's Tariff Hunger Is Very Bullish For Gold
https://seekingalpha.com/article/4103943-trumps-tariff-hunger-bullish-gold
|
Followers
|
67
|
Posters
|
|
|
Posts (Today)
|
0
|
Posts (Total)
|
705
|
|
Created
|
11/12/09
|
Type
|
Free
|
| Moderators | |||


| Volume | |
| Day Range: | |
| Bid Price | |
| Ask Price | |
| Last Trade Time: |


