News
News  Market Data
  Discover
Support: 888-992-3836
Copyright © 2023 InvestorsHub Inc.


Register for free to join our community of investors and share your ideas. You will also get access to streaming quotes, interactive charts, trades, portfolio, live options flow and more tools.
MILWAUKEE, March 5, 2019 -- Jason Industries, Inc. (NASDAQ: JASN, JASNW) (“Jason” or “the Company”) today reported results for both fourth quarter and full-year 2018.
https://last10k.com/sec-filings/jasn
Key financial results for the fourth quarter 2018 versus the year ago period include:
•
Net sales of $132.0 million decreased 9.3 percent and included a negative 1.1 percent impact from the divestiture and planned exit of non-core businesses in the margin expansion program and a negative 0.9 percent from foreign currency translation.
•
Operating loss of $0.4 million or 0.3 percent of net sales, increased $1.9 million, impacted by $1.4 million of accelerated depreciation related to the closure of the Richmond, Indiana Acoustics facility and a $1.3 million gain on the sale of the Nuneaton, United Kingdom Seating facility.
•
Net loss of $12.4 million, or $0.48 diluted loss per share, increased $14.8 million or $0.53 per share, significantly impacted by a discrete tax benefit in 2017 of $3.8 million from enactment of the Tax Cut and Jobs Act (the “Tax Act”), and incremental tax expense in 2018 of $6.0 million resulting from provisions of the Tax Act.
•
Free cash flow was $5.6 million, an increase of $5.5 million, due to lower working capital and capital expenditures.
On an adjusted basis, fourth quarter 2018 results versus the year ago period include:
•
Adjusted EBITDA of $10.9 million, or 8.3 percent of net sales, decreased $1.6 million from 8.6 percent of net sales, driven primarily by lower sales volumes with material inflation largely offset by operational improvements and price.
•
Adjusted net loss of $12.5 million, or $0.40 Adjusted loss per share, decreased $0.39 per share.
Key financial results for the full year 2018 versus the year ago period include:
•
Net sales of $612.9 million decreased 5.5 percent and included a negative 2.9 percent impact from the divestiture and planned exit of non-core businesses and a positive 0.8 percent from foreign currency translation.
•
Adjusted EBITDA of $67.2 million, or 11.0 percent of net sales, with Adjusted EBITDA margins increasing from 10.4 percent of net sales. Adjusted EBITDA margin expansion was driven by improved operational efficiencies.
•
Free cash flow was $16.0 million, an increase of $1.8 million, due to lower capital expenditures, reduced working capital, partially offset by higher cash restructuring.
“We delivered our full year guidance on all key measures for a second consecutive year,” said Brian Kobylinski, chief executive officer of Jason. “While our fourth quarter was impacted by select market headwinds and input cost inflation, our team continues to pursue growth opportunities and margin expansion plans to generate cash and drive further leverage reduction.”
Highlights during the quarter include:
•
Total Cost Reduction and Margin Expansion program savings were $0.4 million in the fourth quarter with a total of $23 million since the inception of the program. Actions taken and announced to-date will achieve the three-year program goal of $25 million, and the Company will continue to evaluate cost reduction and footprint rationalization opportunities as part of its normal operating activities.
•
Completed the sale and consolidation of the Nuneaton, United Kingdom Seating facility. Net proceeds from the sale were $3.5 million.
Key financial results within the segments for the fourth quarter 2018 versus the year ago period include:
•
Finishing net sales of $47.2 million decreased $2.8 million, or 5.6 percent, including a negative foreign currency translation impact of 2.5 percent. Organic sales decreased 3.1 percent and were impacted by lower volumes in a weakening European industrial economy partially offset by growth in North America end markets. Adjusted EBITDA was $5.2 million, or 10.9 percent of net sales, a decrease of $0.6 million from 11.5 percent of net sales. Adjusted EBITDA decreased on lower volumes and investments in selling resources to drive targeted growth.
•
Components net sales of $14.7 million decreased $5.2 million, or 26.1 percent, including a negative 8.1 percent impact from the exit of the non-core smart meter product line. Organic sales decreased 18.0 percent due to decreased rail and expanded metals product volumes resulting from unfavorable content mix and heightened competitive pressures.
Let's take a look at 2017 balance sheet and some other financial metrics: Jason Industries has about $428 million in debt and around $41.5 million in cash. That debt load is a potential downside risk if the company were to continue posting losses. However, with $41.5 million in cash, the company appears to have plenty of liquidity, and since it recently posted a slight profit, the debt is less of a concern for me. In addition, $428 million in debt appears reasonable for a company that is generating $650-670 million in revenues each year.
According to the latest data from Shortsqueeze.com, only 108,200 shares are currently short. This represents much less than 1% of the float, and that tells me that shorts do not see major downside risks for this stock. So overall, it seems clear that short sellers do not see much of an opportunity in terms of additional downside risk. However, it appears that insiders and analysts are clearly seeing significant upside potential for this beaten down stock. Insiders have accelerated share purchases recently, and late last year, analysts at Stifel reiterated a buy rating and set a $3.25 price target. That implies potential upside of more than double the current share price.
Date :05/02/2019 Source :Business Wire
Stock : Jason Industries - Warrant (JASNW)
52 Week HIGH .065 1/9/19 WITH REAL VOLUME
Jason Industries Reports First Quarter 2019 Results
https://ih.advfn.com/stock-market/NASDAQ/jason-industries-inc-JASNW/stock-news/79818221/jason-industries-reports-first-quarter-2019-result
Chart

THAT L2 LOOKING A BIT CRAZY TODAY
No Clue :) Movement is Nice - lol I still have 36k sold half at .0041 yesterday morning You have some time starting down trend...
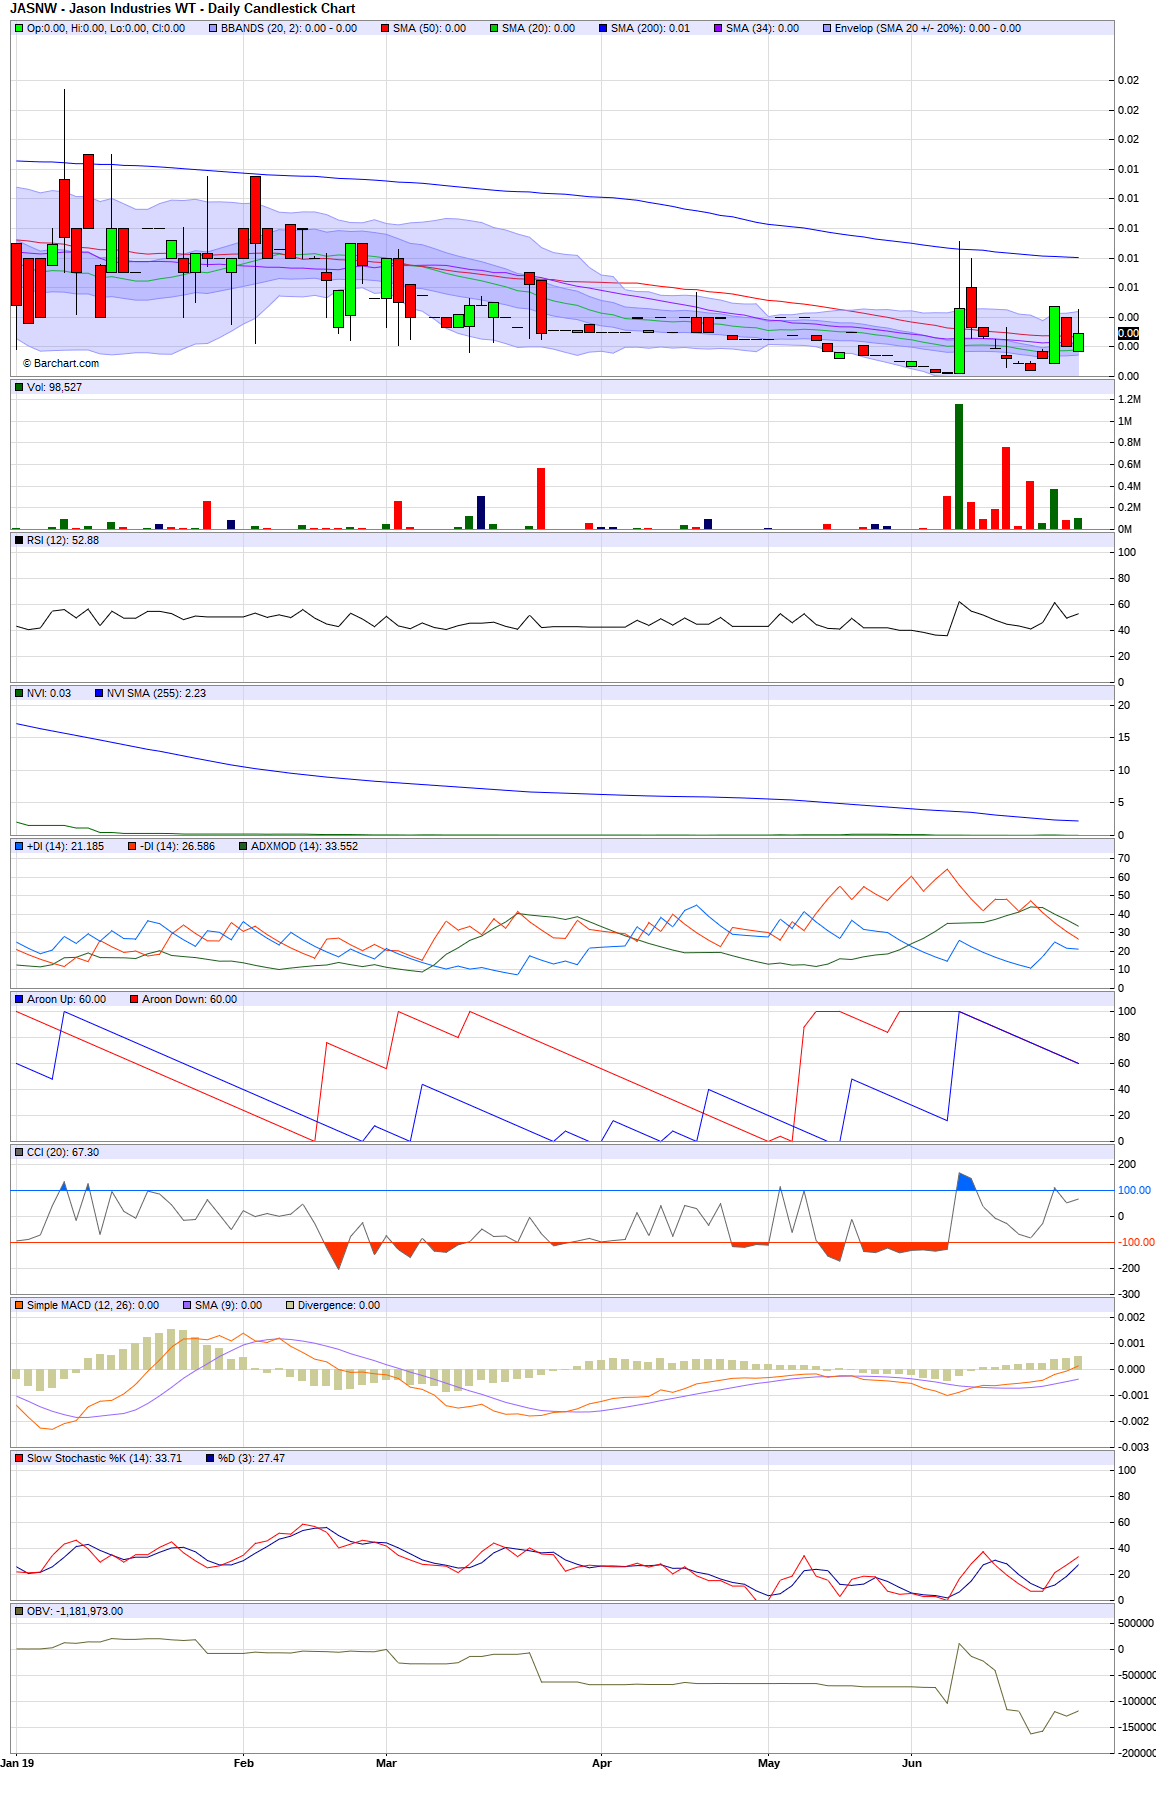
https://www.barchart.com/stocks/quotes/JASNW/technical-chart?plot=CANDLE&volume=total&data=I:15&density=O&pricesOn=1&asPctChange=0&logscale=0&im=15&indicators=RSI(12,100);NVI(255);ADXMOD(14);BBANDS(20,2);AROON(25);SMA(50);SMA(20);SMA(200);CCI(20,100);SMACD(12,26,9);STOSL(14,3);SMA(34);PCT(20,0.20);OBV&sym=JASNW&grid=1&height=375&studyheight=150
NICE CLOSE 45% JASNW REAL WORLD STOCK NSDAQ AT .0029
Half the Volume yesterday average is 120k
CRAZY HOW ALL CHARTS SAY .01
A bullish engulfing pattern occurs in the candlestick chart of a security when a large white candlestick fully engulfs the smaller black candlestick from the period before. This pattern usually occurs during a down trend and is thought to signal the beginning of a bullish trend in the security.
https://www.barchart.com/stocks/quotes/JASNW/technical-chart?plot=CANDLE&volume=total&data=DO&density=M&pricesOn=1&asPctChange=0&logscale=0&startDate=2019-05-16&endDate=2019-06-25&daterange=specific&indicators=NVI(255);MFI(14,100);ADXMOD(14);BBANDS(20,2);AROON(25);SMA(50);SMA(20);SMA(200);ACCUM;CHKMF(20);CCI(20,100);SMACD(12,26,9);RSI(12,100);STOSL(14,3);PVT;SMA(34);PTP(50);PCT(20,0.20);OBV;MOMENT(20);ATR(14)&sym=JASNW&grid=1&height=160&studyheight=100
HUGE UP TREND & AROON DOWN CROSS UP TOMORROW NEXT WEEK COULD SEE NEW HIGH
HUGE UP TREND & AROON DOWN CROSS UP
Jason Industries WT (JASNW) 0.00 unch 17:35 06/25/19
Previous Close N/A
Volume 65,700
Avg Vol 189,755
Stochastic %K 34.83%
Weighted Alpha -49.86
5-Day Change unch (+233.33%)
52-Week Range 0.00 - 0.02
https://www.barchart.com/stocks/quotes/JASNW/overview
JASNW +275% Yesterday - 67k Remain @ .004
30 Min Chart
JASN chart showing buy signals
on watch for 8 ema cross over stay tuned
JASN chart showing buy signals
on watch for 8 ema cross over stay tuned
|
Followers
|
1
|
Posters
|
|
|
Posts (Today)
|
0
|
Posts (Total)
|
22
|
|
Created
|
09/01/16
|
Type
|
Free
|
| Moderators | |||
| http://canadianwarrants.com/american/company/j/JASNW.htm However, there are multiple signs that this stock is too cheap to ignore, and management is coming through on its turnaround goals. There have been a number of recent insider buys on this beaten down stock, which leads me to believe that they are also seeing significant turnaround potential. In addition to these company-specific positives, there are also some macro trends which could soon begin to benefit Jason Industries. This includes the fact that the US Dollar has been declining and that could boost profit margins on exports for this company. Strengthening product demand at companies like Caterpillar and Deere has sent those stocks to new 52-week highs recently, and since those companies are major customers for Jason Industries, it could also see more demand in the future. Improving economic growth in the US and Europe should benefit Jason Industries as well. For all of these reasons, it appears that this stock has hit rock bottom levels, and it could be on the verge of a significant breakout to the upside: | |
Jason Industries, Inc. 411 East Wisconsin Avenue Suite 2100 Milwaukee, WI 53202 United States 414-277-9300 http://www.jasoninc.com Jason Industries, Inc., together with its subsidiaries, engages in the manufacture of seating, finishing, acoustics, and components in the United States and internationally. It produces finishing products, such as industrial brushes, buffing wheels, and buffing compounds for use in various industrial and infrastructure applications; and supplies seating solutions to equipment manufacturers in the motorcycle, lawn and turf care, industrial, agricultural, construction, and power sports end markets, as well as original equipment manufacturer seating for the heavyweight motorcycles. The company also manufactures engineered non-woven and fiber-based acoustical products for the auto industry; and manufactures stamped, formed, expanded and perforated metal components, and subassemblies for rail and filtration applications, outdoor power equipment, small gas engines, and smart utility meters. Jason Industries, Inc. was founded in 1985 and is headquartered in Milwaukee, Wisconsin. |
| Volume | |
| Day Range: | |
| Bid Price | |
| Ask Price | |
| Last Trade Time: |