 News
News  Market Data
  Discover
Support: 888-992-3836
Copyright © 2023 InvestorsHub Inc.


Register for free to join our community of investors and share your ideas. You will also get access to streaming quotes, interactive charts, trades, portfolio, live options flow and more tools.
QQQ on a sell. Stop is 344.89.
Markets are like pendulum they go to extremes so stop trying to find a rationale, it is herd mentality.
I will not be available to update signal every day for few weeks, I will try if I could.
Good luck and happy trading.
Farooq
So many charts (in all indexes ) are displaying this setup; a feeble back kiss, followed by an ensuing fall to lower lows.
It's hard to see how the market can muster a rally when it's raining falling knives.

Long at 342
Me too 
GLTU ! GLTA !
Got back in today
Exited, no position now
Long on qqq, will exit if it goes under 352
Why so weak today , yesterday was very nice !
QID registered an important breakthrough today on the weekly chart. Finally closed above the 45-week MA. Last time the shares traded above that threshold was nearly three years ago.
Qqq made island shape, i remember you mentioned it earlier, is it reversal shape from short to long or long to short
I am hoping it will fill the 362 gap soon, i will exit it if it sees a resistance there
Gap filled but difficult call signal turning will see at end of the day.
Long on tqqq, 354 area seems like support for qqq
When everyone is looking for correction it seldom happens, I think we might go bit lower than my target in this expiry (monthly).
They need people to believe in correction is over, which might be true. I follow the trend I could not make prediction. My estimates are just estimate they may not become true, so please do your own D/D.
Farooq
Agreed, do you think it will go further down or high level correction is over? and we wouldn't see ~335 now?
It seems it will close at 369 keeping wveryone confused
It is at sell, if we close here with target of 356.90 on QQQ.
Out of tqqq, 369 for qqq seems resistance, waiting on side to enter either tqqq or sqqq
QQQ closed on buy so is TQQQ on Friday. Pre market it tested low and move strongly in buy territory. At this writing stop is at 355.40 On QQQ.
Good luck and happy trading.
These are group of traders trained by Dennis Richard. They push the trend to limit before changing there directions. Still a trend following system group of traders.
Turtles? That's a new phrase for me
Turtles are pushing it down, but it is way over sold, 7% rebound is coming near you.
Completely agree. Looking for the 200 SMA ON weekly or close
With current drop and going back up MM could show 16 to 32 % depending what Index they are comparing with. So signal is still on sell.
We hope to make revisit previous low and than move up. Doing it in nightly session.
Still long signal with all volatility.
We clean up most of the longs, Now goal is 367, Short term signal is long now.
"The selloff ends when $AAPL hits its 200da"
May pause there for a DCB. Then visits the 400 day.
When corporate bond market gets the yips, then Bank of Apple core shows the rot. Gets taken out back...along with many others.
The selloff ends when $AAPL hits its 200day MA @ $147, Mark Tepper, I'll agree with that.
Aye,
340 looks like minor support. Then another minor support range at 310 to 320. Below there it's a long drop to 260.
Got a feeling that its a false signal, exited
Seems like a bounce, went long tqqq, will exit if its a false signal
Nothing drop straight so it should be zigzag keeping hope indicator alive. So bag holders do not panic. Follow the trend.
Good advice thanks
It is in bear market stay in QID. 310 area in QQQ is in play about 15 % more drop.
When market need to attract new buyers it often cross bullish averages only to drop more in few days. Yes it could be used but one need to be on toes to run out if things don't pan out.
55 EMA is around 387.75 but da OE pivot for QQQ is 384.42. If price starts closing above there bias becomes bullish but could use 55EMA as additonal confirmation before going long...possibly.. thoughts?
Probably 356 but not straight line, it is kind of Zigzag, will confuse a lot of people. 382 to 386 might be in the card for coming week. They have to shoot one by one, otherwise it will be difficult to control. Swing is still on sell.
Agreed, what do you think qqq will stop at 362?
Close on Sell.
Today's drop on fear of Omicron and supreme court decision. It could resolve the problem of labor shortage (positive), as well more deaths from non vaccinated people (negative). I will be 50% cash till it resolve. Keep some powder dry.
Farooq
It is trying to test low.
Exited tqqq, market seems uncertain, no position now
Came out of sqqq, long on tqqq now, seems like it hit the bottom
Signal was whipped closed on Sell. Below 394.41 it will remain sell.
After tax loss selling we are at buy again. Signal closed at buy.
|
Followers
|
128
|
Posters
|
|
|
Posts (Today)
|
0
|
Posts (Total)
|
7901
|
|
Created
|
10/13/05
|
Type
|
Free
|
| Moderators | |||
To learn more about NERS please visit,http://investorshub.advfn.com/boards/read_msg.aspx?message_id=14508055 ;
(These are the Basic Rules for NERS (Nocona's Early Retirement System):
http://investorshub.advfn.com/boards/read_msg.aspx?message_id=134066192
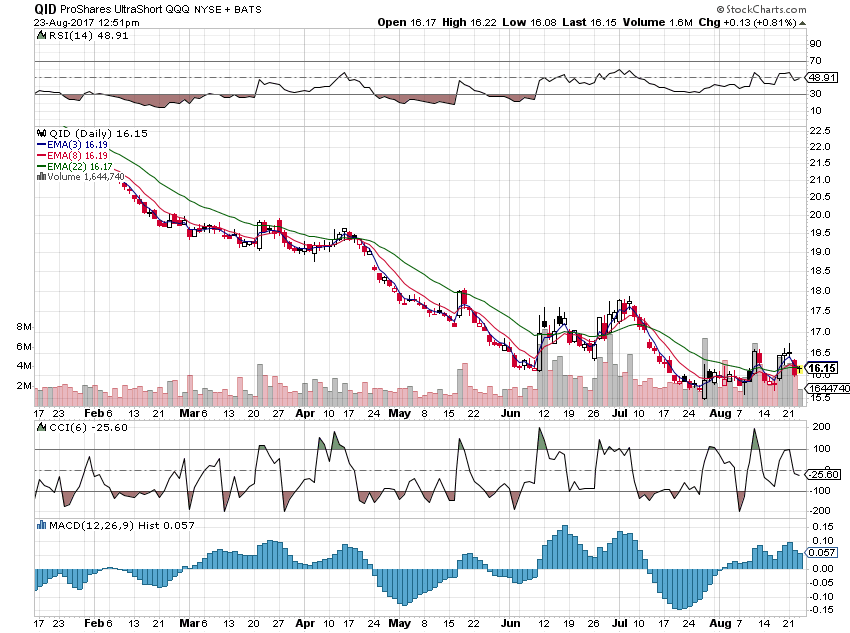
When the CCI is above the +100 you are holding long. When it drops below the +100 you are out of the long and short.
When the CCI is below the -100 you are holding short. When it rises above the -100 you cover the short and go long.
The tricky part happens when the CCI will not reach the opposite 100 line. How to handle when (1) the CCI will not break the zero line at all (2) the CCI breaks the zero line but then soon goes back in the other direction (3) the CCI breaks the zero line and holds there for awhile but without breaking the 100 line. These situations have been the subject of discussion between Nocona and I which you can read about in past posts. The one thing Nocona and I agree on is in situation #2 - If the CCI breaks the zero line, but then crosses it again, you close your position and enter the opposite position. (If short, go long; If long, go short.)
If the CCI goes to a HFE (hook from extreme) beyond the 200 line, Nocona will use the break back of the 200 line as an entry, just like the 100 line.
What CCI to use? The idea started with the 60 min chart using a 12 CCI, but Nocona was entering mid bar and not waiting the whole hour for the bar to close. So it then seemed reasonable to move to a shorter time frame chart with a longer (but equivalent) CCI. So:
60 min 12 CCI is equivalent to:
30 min 24 CCI
15 min 48 CCI
10 min 72 CCI
5 min 144 CCI
The 5 min 144 CCI can be very whippy and is not advised to be used alone without consultation of a longer time frame chart.
I think that about covers it.)
Traders resource: http://www.barchart.com/cheatsheet.php?sym=QQQ
QID daily http://stockcharts.com/h-sc/ui?s=QID&p=D&b=5&g=0&id=p37821192489
http://stockcharts.com/h-sc/ui?s=QLD&p=D&b=5&g=0&id=p86671367294
Daily Chart; http://stockcharts.com/h-sc/ui?s=QQQ&p=D&b=5&g=0&id=p95639970560
Protect your assets use only cash positions to buy stocks, Please do not use margin till trend is in your desired direction. Use stops and protect profits.
Disclaimer: Several trading systems will be presented and discussed on this board over time. While it may appear that the systems are successful, that is no indication that they will be successful for you.
You alone are responsible for doing your own due diligence to prove to yourself that you can be successful with a trading system. No one who presents their views of how to trade can be responsible for your success or failure.
| Volume | |
| Day Range: | |
| Bid Price | |
| Ask Price | |
| Last Trade Time: |


