 News
News  Market Data
  Discover
Support: 888-992-3836
Copyright © 2023 InvestorsHub Inc.


Register for free to join our community of investors and share your ideas. You will also get access to streaming quotes, interactive charts, trades, portfolio, live options flow and more tools.
Closed on a sell, Stop is 305.59 on closing basis.
We did made some coins, now system testing support. Long above 277.15 on closing basis.
Go Long @ above 264.35 and that is your stop. Do your own Due diligence.
Nothing changed but may change by closing tomorrow.
QQQ is on sell below 285.88. Go long above it on closing basis.
Will it fill the gap left behind. Seems want to test 276.68, may be too many buyers waiting. Tax loss selling could fill the Gap.
Closing above gave about $20. it will test support. I tend to take some profit but I think more of 20 dollar move is ahead. Do your own D/D.
QQQ is currently on sell. Need to close above 268 to generate initial buy signal.
Not till next year
Back to 284 into election than we crack 250 EOW
Get ready for the crash!!!
$200 coming
QQQ complex on stay Long stop is at 275.29.
None, next leg down cometh
Which stocks on the Nasdaq are holding the index up? From what I can see all the main FAANG stocks and MSFT are getting crushed
Buy and hold is signal stop today is at 277.62.
Possible but difficult, usually 28 to 29 is down days.
Struggling at this resistance. QQQ will dump end of the week. Down 1
8-10% by end of week $255 range
Signal on QQQ is long at this writing. Stop is at 273.78.
269.12 is buy stop from short. Signal is short at yesterday closing.
Yes so far that is the mantra, but holder of both are losing money.
QQQ will become short below 269.34 on closing basis.
QQQ stop is at 270.16 and go go short is 269.29 on closing basis.
Closing above 270.66 generate buy signal on closing basis.
QQQ above 266.80 is initial buy confirmation is closing above 270.55.
Today is the short term bottom for 3 months dear.
Yep, only going to get worse as OPEC delivered a blow to Biden, and oil on the rise, you know the rest $QQQ
10 dollar drop in 5 minutes.
Theres $255 as called, next up $210, then $200
Good luck and happy trading.
We need to close above 266.85 to take a long position except if you are day trader. Day trader could be long above 263.85 and stop would be 263.10. Do your own D/D.
I feel there is a fatigue in the market, short sellers are tired also because there is no new buyer and there are no stop loss to take out. Scary trader already sold out. Market participants who are in now long term holder, like 401 K, pension funds, or hedge funds. Short sellers will cover there position in week or so and then will be decided where they wanted to go. Point of least resistance will be up, no sellers is left behind. No matter what pundits are saying. Look at previous bear cycles that how long market stayed near bottom, we are already here for 5 months almost. Question need to be asked, will the market never come back? one may get 5 to 7% more sale but are we ready to let go this once in decade sale opportunity let go. Just thinking loud. Very few are good in timing the market, few by knowledge, few by chance. Good luck and happy trading.
52 week lows printing
Not so soon, next year.
Long play till 39.26 is not breached on closing basis.
May be.
I will be gone for a week.
Nothing is changed yet. Buy stop 297.65. Go long is way up.
Closed on sell, Stop of short is at 317.54 on a closing basis.
Vacations are part of life and spending what you earned, I will be back by 08/22, be careful and enjoy the ride.
Dear readers,
If you benefited from my posts and made some profit than I hope you will give 5 % of your profit to charity of your choice for hunger elevation or soup Kitchens. Thanks.
Remain on buy, Stop is at 320.59 on closing basis.
I will take profit if we cross below, 308.38.
Be prepared for a $20 drop in the next few days or more
This is a premature job, there’s no reason for this to go up our GDP, our labor market everything is the lowest it’s ever been we are so close to being in a recession it’s not funny..
They should be hovering at about $250 a share right now I’m waiting for the rug to be pulled And this thing tumble straight down
QQQ remain on buy, Stop sell is at 316.55 on closing basis.
|
Followers
|
131
|
Posters
|
|
|
Posts (Today)
|
0
|
Posts (Total)
|
7926
|
|
Created
|
10/13/05
|
Type
|
Free
|
| Moderators | |||
To learn more about NERS please visit,http://investorshub.advfn.com/boards/read_msg.aspx?message_id=14508055 ;
(These are the Basic Rules for NERS (Nocona's Early Retirement System):
http://investorshub.advfn.com/boards/read_msg.aspx?message_id=134066192
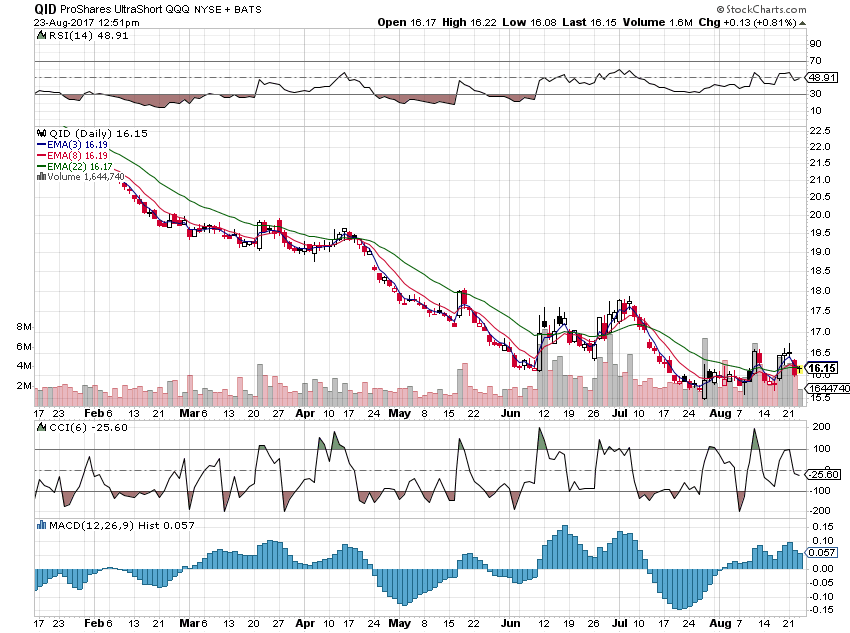
When the CCI is above the +100 you are holding long. When it drops below the +100 you are out of the long and short.
When the CCI is below the -100 you are holding short. When it rises above the -100 you cover the short and go long.
The tricky part happens when the CCI will not reach the opposite 100 line. How to handle when (1) the CCI will not break the zero line at all (2) the CCI breaks the zero line but then soon goes back in the other direction (3) the CCI breaks the zero line and holds there for awhile but without breaking the 100 line. These situations have been the subject of discussion between Nocona and I which you can read about in past posts. The one thing Nocona and I agree on is in situation #2 - If the CCI breaks the zero line, but then crosses it again, you close your position and enter the opposite position. (If short, go long; If long, go short.)
If the CCI goes to a HFE (hook from extreme) beyond the 200 line, Nocona will use the break back of the 200 line as an entry, just like the 100 line.
What CCI to use? The idea started with the 60 min chart using a 12 CCI, but Nocona was entering mid bar and not waiting the whole hour for the bar to close. So it then seemed reasonable to move to a shorter time frame chart with a longer (but equivalent) CCI. So:
60 min 12 CCI is equivalent to:
30 min 24 CCI
15 min 48 CCI
10 min 72 CCI
5 min 144 CCI
The 5 min 144 CCI can be very whippy and is not advised to be used alone without consultation of a longer time frame chart.
I think that about covers it.)
Traders resource: http://www.barchart.com/cheatsheet.php?sym=QQQ
QID daily http://stockcharts.com/h-sc/ui?s=QID&p=D&b=5&g=0&id=p37821192489
http://stockcharts.com/h-sc/ui?s=QLD&p=D&b=5&g=0&id=p86671367294
Daily Chart; http://stockcharts.com/h-sc/ui?s=QQQ&p=D&b=5&g=0&id=p95639970560
Protect your assets use only cash positions to buy stocks, Please do not use margin till trend is in your desired direction. Use stops and protect profits.
Disclaimer: Several trading systems will be presented and discussed on this board over time. While it may appear that the systems are successful, that is no indication that they will be successful for you.
You alone are responsible for doing your own due diligence to prove to yourself that you can be successful with a trading system. No one who presents their views of how to trade can be responsible for your success or failure.
| Volume | |
| Day Range: | |
| Bid Price | |
| Ask Price | |
| Last Trade Time: |


