Register for free to join our community of investors and share your ideas. You will also get access to streaming quotes, interactive charts, trades, portfolio, live options flow and more tools.
Bought Nov 11 514c @ .39
~bought more 10/31 $511 calls average @.06c
~bought 10/31 $520 calls @.05c goog or whatever mag 7 pop it to $505 for G
~sold 10/30 $510 calls @.09c :(
~yeah lol but with TSLA & all the beats I might cash out lovely tomorrow
What a greedy G to buy those
Gold shines as ultimate safe-haven asset, set to hit $3,000/oz by 2025 – Bank of America
Silver jumps up closing in on $40s per oz $QQQ
~bought 10/18 $502 calls @.05c maybe NFLX pop this
~bought more 10/16 $507 calls…average now .14c
~bought more 10/16 $507 calls average now .18c
~bought 10/14 $510 calls @.08c les see QQQs go over $500 tomorrow
Economy looking worst ever. Even with the US putting in >$40B per week into the economy and markets, we could only get 260K jobs. Injecting $20B should be enough to get >300K jobs. The $40B can't even do it. Debt is exploding. Most companies reporting lower EPS than prior year. Ugly!
~bought 10/7 $500 calls @.05 maybe a pop tomorrow
~average now on the 10/4 $500 calls @.08c
~bought more 10/4 $500 calls…average now .09c
408 by 10/15
QQQ Weekly: https://invst.ly/16kkdz
QQQ Daily: https://invst.ly/16kkfn
Gold Rush in India: Duty Cut Ignites Massive Buying Spree https://jpost.com/business-and-innovation/precious-metals/article-815319 $QQQ $DIA $IWM $VOO $SPY $SPX
~good thang I sold @.15c
people trading trillion collar market cap stocks like it some kind of penny stock. more manipulated than penny stocks
entire market is manipulated with 5 stocks making up 40% of the QQQ the rest of the stocks in the nasdaq 100 illiquid and untradeable two stocks is 15% of the index...how can that be? either they powers that be want to manipulate and hedge their bets or the options they dealing and options and futures index racket. people think if the stock of a 3 trillion dollar falls 10% they think they lost 300 billion in market cap. you actually think there is 300 billion in cash waiting to buy. even warren buffet doesn't have 300 billion in spare change to buy.
certainly a path it could follow
top is in or very close for QQQ for 2024
Can someone explain why latest QQQ Trades when there are more buys than sells the trend in the market is the opposite
Smart move if you ask me
|
Followers
|
132
|
Posters
|
|
|
Posts (Today)
|
2
|
Posts (Total)
|
7945
|
|
Created
|
10/13/05
|
Type
|
Free
|
| Moderators | |||
To learn more about NERS please visit,http://investorshub.advfn.com/boards/read_msg.aspx?message_id=14508055 ;
(These are the Basic Rules for NERS (Nocona's Early Retirement System):
http://investorshub.advfn.com/boards/read_msg.aspx?message_id=134066192

When the CCI is above the +100 you are holding long. When it drops below the +100 you are out of the long and short.
When the CCI is below the -100 you are holding short. When it rises above the -100 you cover the short and go long.
The tricky part happens when the CCI will not reach the opposite 100 line. How to handle when (1) the CCI will not break the zero line at all (2) the CCI breaks the zero line but then soon goes back in the other direction (3) the CCI breaks the zero line and holds there for awhile but without breaking the 100 line. These situations have been the subject of discussion between Nocona and I which you can read about in past posts. The one thing Nocona and I agree on is in situation #2 - If the CCI breaks the zero line, but then crosses it again, you close your position and enter the opposite position. (If short, go long; If long, go short.)
If the CCI goes to a HFE (hook from extreme) beyond the 200 line, Nocona will use the break back of the 200 line as an entry, just like the 100 line.
What CCI to use? The idea started with the 60 min chart using a 12 CCI, but Nocona was entering mid bar and not waiting the whole hour for the bar to close. So it then seemed reasonable to move to a shorter time frame chart with a longer (but equivalent) CCI. So:
60 min 12 CCI is equivalent to:
30 min 24 CCI
15 min 48 CCI
10 min 72 CCI
5 min 144 CCI
The 5 min 144 CCI can be very whippy and is not advised to be used alone without consultation of a longer time frame chart.
I think that about covers it.)
Traders resource: http://www.barchart.com/cheatsheet.php?sym=QQQ
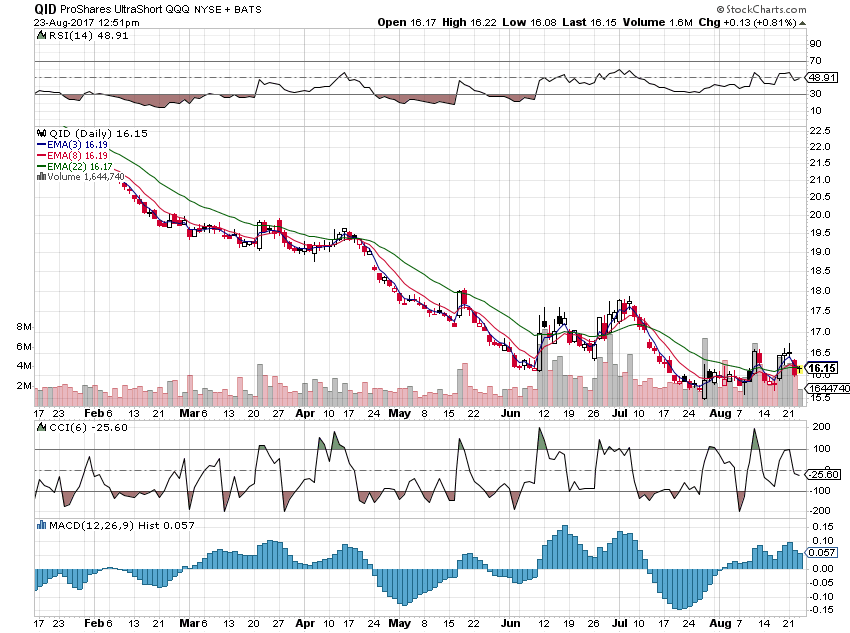
QID daily http://stockcharts.com/h-sc/ui?s=QID&p=D&b=5&g=0&id=p37821192489
http://stockcharts.com/h-sc/ui?s=QLD&p=D&b=5&g=0&id=p86671367294
Daily Chart; http://stockcharts.com/h-sc/ui?s=QQQ&p=D&b=5&g=0&id=p95639970560
Protect your assets use only cash positions to buy stocks, Please do not use margin till trend is in your desired direction. Use stops and protect profits.
Disclaimer: Several trading systems will be presented and discussed on this board over time. While it may appear that the systems are successful, that is no indication that they will be successful for you.
You alone are responsible for doing your own due diligence to prove to yourself that you can be successful with a trading system. No one who presents their views of how to trade can be responsible for your success or failure.
| Volume | |
| Day Range: | |
| Bid Price | |
| Ask Price | |
| Last Trade Time: |
