 News
News  Market Data
  Discover
Support: 888-992-3836
Copyright © 2023 InvestorsHub Inc.


Register for free to join our community of investors and share your ideas. You will also get access to streaming quotes, interactive charts, trades, portfolio, live options flow and more tools.
Report of Foreign Issuer Pursuant to Rule 13a-16 or 15d-16 (6-k)
Source: Edgar (US Regulatory)
UNITED STATES
SECURITIES AND EXCHANGE COMMISSION
Washington, D.C. 20549
FORM 6-K
REPORT OF FOREIGN PRIVATE ISSUER
PURSUANT TO RULE 13a-16 OR 15d-16
UNDER THE SECURITIES EXCHANGE ACT OF 1934
For the month of October 2022
Commission File Number: 001-36515
Materialise NV
Technologielaan 15
3001 Leuven
Belgium
(Address of principal executive office)
Indicate by check mark whether the registrant files or will file annual reports under cover of Form 20-F or Form 40-F.
Form 20-F ? Form 40-F ?
Indicate by check mark if the registrant is submitting the Form 6-K in paper as permitted by Regulation S-T Rule 101(b)(1): ?
Indicate by check mark if the registrant is submitting the Form 6-K in paper as permitted by Regulation S-T Rule 101(b)(7): ?
This Form 6-K is incorporated by reference into the registrant’s Registration Statement on Form F-3 (File No. 333-213649).
Third Quarter 2022 Financial Results
Except as otherwise required by the context, references to “Materialise,” “Company,” “we,” “us” and “our” are to Materialise NV and its subsidiaries.
Third Quarter 2022 Results
Total revenue for the third quarter of 2022 increased 11.7% to 58,288 kEUR from 52,195 kEUR for the third quarter of 2021.
Revenue from our Materialise Software segment increased 3.8% to 10,863 kEUR for the third quarter of 2022 from 10,468 kEUR for the same quarter last year.
Revenue from our Materialise Medical segment increased 13.1% to 21,391 kEUR for the third quarter of 2022 compared to 18,910 kEUR for the same period in 2021.
Revenue from our Materialise Manufacturing segment increased 14.1% to 26,033 kEUR for the third quarter of 2022 from 22,817 kEUR for the third quarter of 2021.
Gross profit was 32,042 kEUR compared to 31,076 kEUR for the same period last year, while gross profit as a percentage of revenue decreased to 55.0% compared to 59.5% for the third quarter of 2021.
Research and development (“R&D”), sales and marketing (“S&M”) and general and administrative (“G&A”) expenses increased, in the aggregate, 24.5% to 33,491 kEUR for the third quarter of 2022 from 26,900 kEUR for the third quarter of 2021.
Net other operating income increased to 1,166 kEUR from 355 kEUR for the third quarter of 2021.
Operating result amounted to (282) kEUR compared to 4,529 kEUR for the third quarter of 2021.
Net financial result was 2,173 kEUR compared to 4,203 kEUR for the third quarter of 2021.
The third quarter of 2022 contained income tax expenses of (478) kEUR, compared to (75) kEUR in the third quarter of 2021.
As a result of the above, net profit for the third quarter of 2022 was 1,413 kEUR, compared to 8,657 kEUR for the same period in 2021. Total comprehensive income for the third quarter of 2022, which includes exchange differences on translation of foreign operations, was 1,638 kEUR compared to 8,272 kEUR for the 2021 period.
At September 30, 2022, we had cash and cash equivalents of 150,621 kEUR compared to 196,028 kEUR at December 31, 2021. Gross debt amounted to 83,925 kEUR, compared to 99,107 kEUR at December 31, 2021. As a result, our net cash position (cash and cash equivalents less gross debt) was 66,696 kEUR, a decrease of 30,225 kEUR, and included the effect of our call option exercise to acquire 100% of the shares of Link3D, and of our acquisition of Identify3D.
Cash flow from operating activities for the third quarter of the year 2022 was 3,840 kEUR compared to 4,388 kEUR for the same period in 2021. Total capital expenditures for the third quarter of 2022 amounted to 9,441 kEUR.
Net shareholders’ equity at September 30, 2022 was 236,559 kEUR compared to 232,577 kEUR at December 31, 2021.
Adjusted EBITDA amounted to 5,072 kEUR for the third quarter of 2022 compared to 9,739 kEUR for the 2021 period. The Adjusted EBITDA margin (Adjusted EBITDA divided by total revenue) for the third quarter of 2022 was 8.7%, compared to 18.7% for the third quarter of 2021.
Adjusted EBITDA from our Materialise Software segment decreased, including the effect of ongoing investments in Link3D and Identify3D, to 202 kEUR from 3,708 kEUR while the segment EBITDA margin (segment EBITDA divided by segment revenue) was 1.9% compared to 35.4% for the prior-year period.
Adjusted EBITDA from our Materialise Medical segment amounted to 4,765 kEUR for the third quarter of 2022 compared to 5,251 kEUR while the segment EBITDA margin was 22.3% compared to 27.8% for the third quarter of 2021.
Adjusted EBITDA from our Materialise Manufacturing segment amounted to 2,530 kEUR compared to 3,546 kEUR for the same period last year, while the segment EBITDA margin was 9.7% compared to 15.5% for the third quarter of 2021.
Non-IFRS Measures
Materialise uses EBITDA and Adjusted EBITDA as supplemental financial measures of its financial performance. EBITDA is calculated as net profit plus income taxes, financial expenses (less financial income), shares of profit or loss in a joint venture and depreciation and amortization. Adjusted EBITDA is determined by adding share-based compensation expenses, acquisition-related expenses of business combinations, impairments and revaluation of fair value due to business combinations to EBITDA. Management believes these non-IFRS measures to be important measures as they exclude the effects of items which primarily reflect the impact of long-term investment and financing decisions, rather than the performance of the company’s day-to-day operations. As compared to net profit, these measures are limited in that they do not reflect the periodic costs of certain capitalized tangible and intangible assets used in generating revenues in the company’s business, or the charges associated with impairments. Management evaluates such items through other financial measures such as capital expenditures and cash flow provided by operating activities. The company believes that these measurements are useful to measure a company’s ability to grow or as a valuation measurement. The company’s calculation of EBITDA and Adjusted EBITDA may not be comparable to similarly titled measures reported by other companies. EBITDA and Adjusted EBITDA should not be considered as alternatives to net profit or any other performance measure derived in accordance with IFRS. The company’s presentation of EBITDA and Adjusted EBITDA should not be construed to imply that its future results will be unaffected by unusual or non-recurring items.
Exchange Rate
This document contains translations of certain euro amounts into U.S. dollars at specified rates solely for the convenience of readers. Unless otherwise noted, all translations from euros to U.S. dollars in this document were made at a rate of EUR 1.00 to USD 0.9748, the reference rate of the European Central Bank on September 30, 2022.
About Materialise
Materialise incorporates 30 years of 3D printing experience into a range of software solutions and 3D printing services, which form the backbone of the 3D printing industry. Materialise’s open and flexible solutions enable players in a wide variety of industries, including healthcare, automotive, aerospace, art and design, and consumer goods, to build innovative 3D printing applications that aim to make the world a better and healthier place. Headquartered in Belgium, with branches worldwide, Materialise combines one of the largest groups of software developers in the industry with one of the largest 3D printing facilities in the world.
Consolidated income statements (Unaudited)
for the three months ended
September 30, for the nine months ended
September 30,
In ‘000 2022 2022 2021(*) 2022 2021(*)
U.S.$ € € € €
Revenue
56,819 58,288 52,195 169,319 148,461
Cost of Sales
(25,584 ) (26,245 ) (21,119 ) (76,236 ) (64,378 )
Gross Profit
31,235 32,042 31,076 93,083 84,084
Gross profit as % of revenue
55.0 % 55.0 % 59.5 % 55.0 % 56.6 %
Research and development expenses
(9,078 ) (9,313 ) (6,602 ) (26,074 ) (19,982 )
Sales and marketing expenses
(14,815 ) (15,198 ) (12,413 ) (44,841 ) (35,730 )
General and administrative expenses
(8,754 ) (8,980 ) (7,885 ) (26,089 ) (23,449 )
Net other operating income (expenses)
1,137 1,166 355 2,603 2,318
Operating (loss) profit
(275 ) (282 ) 4,529 (1,318 ) 7,239
Financial expenses
(2,057 ) (2,110 ) 2,334 (4,671 ) (3,182 )
Financial income
4,175 4,283 1,869 9,800 4,426
Share in loss of joint venture
— — — — —
(Loss) profit before taxes
1,843 1,891 8,732 3,812 8,483
Income Taxes (*)
(466 ) (478 ) (75 ) (1,377 ) (101 )
Net (loss) profit for the period (*)
1,377 1,413 8,657 2,435 8,382
Net (loss) profit attributable to:
—
The owners of the parent
1,385 1,421 8,660 2,457 8,386
Non-controlling interest
(8 ) (8 ) (3 ) (21 ) (4 )
Earning per share attributable to owners of the parent
Basic (*)
0.02 0.02 0.15 0.04 0.15
Diluted (*)
0.02 0.02 0.15 0.04 0.15
Weighted average basic shares outstanding
59,064 59,064 58,731 59,064 55,935
Weighted average diluted shares outstanding
59,089 59,089 58,944 59,099 56,206
(*)
The year 2021 has been restated to reflect the final accounting of the business combination with RS Print. Impact on the nine months ended September 30 income taxes and net profit is (46)k€.
The year 2021 has been restated to reflect the final accounting of the business combination with RS Print. Impact on the three months ended September 30 income taxes and net profit is 5 k€.
Consolidated statements of comprehensive income (Unaudited)
for the three months ended
September 30, for the nine months ended
September 30,
In 000€ 2022 2022 2021(*) 2022 2021(*)
U.S.$ € € € €
Net profit (loss) for the period (*)
1,377 1,413 8,657 2,435 8,382
Other comprehensive income
Recycling
Exchange difference on translation of foreign operations
219 225 (385 ) 1,291 1,590
Non-recycling
Fair value adjustments through OCI - Equity instruments
— — — (0 ) 48
Other comprehensive income (loss), net of taxes
219 225 (385 ) 1,291 1,638
Total comprehensive income (loss) for the year, net of taxes
1,596 1,638 8,272 3,726 10,020
Total comprehensive income (loss) attributable to:
The owners of the parent
1,604 1,646 8,275 3,748 10,023
Non-controlling interests
(8 ) (8 ) (3 ) (21 ) (3 )
(*)
The year 2021 has been restated to reflect the final accounting of the business combination with RS Print. Impact on the nine months ended September 30 income taxes and net profit is (46)k€.
The year 2021 has been restated to reflect the final accounting of the business combination with RS Print. Impact on the three months ended September 30 income taxes and net profit is 5 k€.
Consolidated statement of financial position (Unaudited)
As of
September 30, As of
December 31,
In 000€ 2022 2021
Assets
Non-current assets
Goodwill
50,190 18,726
Intangible assets
38,710 31,668
Property, plant & equipment
92,335 84,451
Right-of-Use assets
8,520 9,054
Investments in joint ventures
— —
Deferred tax assets
217 227
Investments in convertible loans
3,431 3,560
Investments in non-listed equity instruments
399 399
Other non-current assets
4,948 7,520
Total non-current assets
198,750 155,605
Current assets
Inventories
15,532 11,295
Trade receivables
42,329 41,541
Other current assets
8,374 8,940
Cash and cash equivalents
150,621 196,028
Total current assets
216,856 257,803
Total assets
415,606 413,408
As of
September 30, As of
December 31,
In 000€ 2022 2021
Equity and liabilities
Equity
Share capital
4,487 4,489
Share premium
233,869 233,872
Retained earnings and other reserves
(1,797 ) (5,784 )
Equity attributable to the owners of the parent
236,559 232,577
Non-controlling interest
(21 ) 1
Total equity
236,538 232,578
Non-current liabilities
Loans & borrowings
58,126 72,637
Lease liabilities
5,004 5,268
Deferred tax liabilities
4,239 4,371
Deferred income
6,932 4,952
Other non-current liabilities
1,027 2,168
Total non-current liabilities
75,328 89,396
Current liabilities
Loans & borrowings
17,593 17,849
Lease liabilities
3,202 3,353
Trade payables
25,038 20,171
Tax payables
1,128 783
Deferred income
36,112 33,306
Other current liabilities
20,667 15,972
Total current liabilities
103,740 91,434
Total equity and liabilities
415,606 413,408
Consolidated statement of cash flows (Unaudited)
for the nine months ended
September 30,
In 000€ 2022 2021*
Operating activities
Net (loss) profit for the period (*)
2,435 8,382
Non-cash and operational adjustments
Depreciation of property plant & equipment
11,335 11,460
Amortization of intangible assets
4,859 3,780
Impairment of goodwill and intangible assets
— —
Share-based payment expense
(121 ) (878 )
Loss (gain) on disposal of property, plant & equipment
59 43
Movement in provisions
(506 ) 7
Movement reserve for bad debt and slow moving inventory
(42 ) 154
Financial income
(9,771 ) (4,426 )
Financial expense
5,009 3,182
Impact of foreign currencies
98 107
Share in loss (gain) of a joint venture (equity method)
— —
(Deferred) income taxes (*)
1,384 101
Other non-current liabilities
— —
Working capital adjustments
9,109 (4,531 )
Decrease (increase) in trade receivables and other receivables
(184 ) (7,553 )
Decrease (increase) in inventories and contracts in progress
(4,356 ) (1,770 )
Increase (decrease) in deferred revenue
3,815 (56 )
Increase (decrease) in trade payables and other payables
9,834 4,848
Income tax paid & Interest received
(262 ) 108
Net cash flow from operating activities
23,587 17,490
(*)
The year 2021 has been restated to reflect the final accounting of the business combination with RS Print. Impact on Net profit for the period and on (Deferred) income taxes is (46) k€.
for the nine months ended
September 30,
In 000€ 2022 2021
Investing activities
Purchase of property, plant & equipment
(16,066 ) (4,827 )
Purchase of intangible assets
(3,422 ) (2,439 )
Proceeds from the sale of property, plant & equipment & intangible assets (net)
319 295
Acquisition of subsidiary (net of cash)
(29,355 ) —
(Convertible) Loans granted
— 1,239
Investment in subsidiary, net of cash acquired
— (1,680 )
Net cash flow used in investing activities
(48,523 ) (7,412 )
Financing activities
Repayment of loans & borrowings
(15,182 ) (11,169 )
Repayment of leases
(2,566 ) (2,841 )
Capital increase
— 85,787
Interest paid
(1,665 ) (1,652 )
Other financial income (expense)
1,378 2,740
Net cash flow from (used in) financing activities
(18,035 ) 72,865
Net increase/(decrease) of cash & cash equivalents
(42,972 ) 82,943
Cash & Cash equivalents at the beginning of the year
196,028 111,538
Exchange rate differences on cash & cash equivalents
(2,433 ) 465
Cash & cash equivalents at end of the period
150,621 194,946
Reconciliation of Net Profit (Loss) to EBITDA and Adjusted EBITDA (Unaudited)
for the three months ended
September 30, for the nine months ended
September 30,
In 000€ 2022 2021 (*) 2022 2021 (*)
Net profit (loss) for the period (*)
1,413 8,657 2,435 8,382
Income taxes (*)
478 75 1,377 101
Financial expenses
2,110 (2,334 ) 4,671 3,182
Financial income
(4,283 ) (1,869 ) (9,800 ) (4,426 )
Depreciation and amortization
5,378 5,314 16,194 15,240
Share in loss of joint venture
— — — —
EBITDA
5,096 9,843 14,876 22,480
Share-based compensation expense (1)
(24 ) (104 ) (121 ) (878 )
Acquisition-related expenses of business combinations (2)
— — — 405
Adjusted EBITDA
5,072 9,739 14,755 22,007
(1)
Share-based compensation expense represents the cost of equity-settled and share-based payments to employees.
(2)
Acquisition-related expenses of business combinations represents expenses incurred in connection with the acquisition of our option to buy Link3D.
(*)
The year 2021 has been restated to reflect the final accounting of the business combination with RS Print. Impact on the nine months ended September 30 income taxes and net profit is (46)k€.
The year 2021 has been restated to reflect the final accounting of the business combination with RS Print. Impact on the three months ended September 30 income taxes and net profit is 5 k€.
Segment P&L (Unaudited)
In 000€ Materialise
Software Materialise
Medical Materialise
Manufacturing Total
segments Unallocated (1) Consolidated
For the three months ended September 30, 2022
Revenues
10,863 21,391 26,033 58,288 0 58,288
Segment (adj) EBITDA
202 4,765 2,530 7,497 (2,425 ) 5,072
Segment (adj) EBITDA %
1.9 % 22.3 % 9.7 % 12.9 % 8.7 %
For the three months ended September 30, 2021
Revenues
10,468 18,910 22,817 52,196 (0 ) 52,195
Segment (adj) EBITDA
3,708 5,251 3,546 12,506 (2,767 ) 9,739
Segment (adj) EBITDA %
35.4 % 27.8 % 15.5 % 24.0 % 18.7 %
In 000€ Materialise
Software Materialise
Medical Materialise
Manufacturing Total
segments Unallocated (1) Consolidated
For the nine months ended September 30, 2022
Revenues
31,989 60,592 76,739 169,319 0 169,319
Segment (adj) EBITDA
2,955 12,466 6,722 22,144 (7,388 ) 14,755
Segment (adj) EBITDA %
9.2 % 20.6 % 8.8 % 13.1 % 8.7 %
For the nine months ended September 30, 2021
Revenues
30,719 52,686 65,199 148,604 (142 ) 148,461
Segment (adj) EBITDA
10,266 14,313 5,252 29,831 (7,826 ) 22,004
Segment (adj) EBITDA %
33.4 % 27.2 % 8.1 % 20.1 % 14.8 %
(1)
Unallocated segment adjusted EBITDA consists of corporate research and development and corporate other operating income (expense), and the added share-based compensation expenses, acquisition related expenses of business combinations, impairments and fair value of business combinations that are included in Adjusted EBITDA.
Reconciliation of Net Profit (Loss) to Segment adjusted EBITDA (Unaudited)
for the three months ended
September 30, for the nine months ended
September 30,
In 000€ 2022 2021 (*) 2022 2021 (*)
Net profit (loss) for the period (*)
1,413 8,657 2,435 8,382
Income taxes (*)
478 75 1,377 101
Financial cost
2,110 (2,334 ) 4,671 3,182
Financial income
(4,283 ) (1,869 ) (9,800 ) (4,426 )
Share in loss of joint venture
— — — —
Operating (loss) profit
(282 ) 4,529 (1,318 ) 7,239
Depreciation and amortization
5,378 5,314 16,194 15,240
Corporate research and development
592 710 2,057 2,191
Corporate headquarter costs
2,491 2,463 7,103 6,907
Other operating income (expense)
(681 ) (511 ) (1,892 ) (1,745 )
Segment adjusted EBITDA
7,497 12,506 22,144 29,831
(*)
The year 2021 has been restated to reflect the final accounting of the business combination with RS Print. Impact on the nine months ended September 30 income taxes and net profit is (46)k€.
The year 2021 has been restated to reflect the final accounting of the business combination with RS Print. Impact on the three months ended September 30 income taxes and net profit is 5 k€.
SIGNATURE
Pursuant to the requirements of the Securities Exchange Act of 1934, the registrant has duly caused this report to be signed on its behalf by the undersigned, thereunto duly authorized.
MATERIALISE NV
By:
/s/ Wilfried Vancraen
Name: Wilfried Vancraen
Title: Chief Executive Officer
Date: October 27, 2022
Materialise Reports Third Quarter 2022 Results
Source: Business Wire
Materialise NV (NASDAQ:MTLS), a leading provider of additive manufacturing and medical software and of sophisticated 3D printing services, today announced its financial results for the third quarter ended September 30, 2022.
Highlights – Third Quarter 2022
Total revenue increased 11.7% to 58,288 kEUR compared to 52,195 kEUR for the third quarter of 2021.
Total deferred revenue from annual software sales and maintenance fees increased by 3,214 kEUR to 38,359 kEUR compared to December 31, 2021.
Adjusted EBITDA was 5,072 kEUR, compared to 9,739 kEUR for the 2021 period.
Net profit for the third quarter of 2022 was 1,413 kEUR, or 0.02 EUR per diluted share, compared to 8,657 kEUR, or 0.15 EUR per diluted share, for the 2021 period.
Executive Chairman Peter Leys commented, “Demand for the products and solutions of each of our three segments remained solid even in these uncertain macro-economic times. Materialise’s revenue increased by almost 12% compared to the same period last year and our deferred revenue from annual software sales and maintenance fees increased by almost 10% compared to December 31, 2021. As a result of our continued investment in our growth businesses, but also because of inflation and, in particular our increased labor costs, our Adjusted EBITDA for the quarter was 5,072 kEUR compared to 9,739 kEUR for the third quarter of 2021. Our results included operational investments in Identify3D, a developer of AM cloud security systems that we acquired on September 1, 2022.”
Third Quarter 2022 Results
Total revenue for the third quarter of 2022 increased 11.7% to 58,288 kEUR from 52,195 kEUR for the third quarter of 2021. Adjusted EBITDA amounted to 5,072 kEUR for the third quarter of 2022 compared to 9,739 kEUR for the 2021 period. The Adjusted EBITDA margin (Adjusted EBITDA divided by total revenue) for the third quarter of 2022 was 8.7%, compared to 18.7% for the third quarter of 2021.
Revenue from our Materialise Software segment increased 3.8% to 10,863 kEUR for the third quarter of 2022 from 10,468 kEUR for the same quarter last year. Segment EBITDA decreased, including the effect of ongoing investments in Link3D and Identify3D, to 202 kEUR from 3,708 kEUR while the segment EBITDA margin was 1.9% compared to 35.4% for the prior-year period.
Revenue from our Materialise Medical segment increased 13.1% to 21,391 kEUR for the third quarter of 2022 compared to 18,910 kEUR for the same period in 2021. Segment EBITDA amounted to 4,765 kEUR for the third quarter of 2022 compared to 5,251 kEUR while the segment EBITDA margin was 22.3% compared to 27.8% for the third quarter of 2021.
Revenue from our Materialise Manufacturing segment increased 14.1% to 26,033 kEUR for the third quarter of 2022 from 22,817 kEUR for the third quarter of 2021. Segment EBITDA amounted to 2,530 kEUR compared to 3,546 kEUR for the same period last year, while the segment EBITDA margin was 9.7% compared to 15.5% for the third quarter of 2021.
Gross profit was 32,042 kEUR compared to 31,076 kEUR for the same period last year, while gross profit as a percentage of revenue decreased to 55.0% compared to 59.5% for the third quarter of 2021.
Research and development (“R&D”), sales and marketing (“S&M”) and general and administrative (“G&A”) expenses increased, in the aggregate, 24.5% to 33,491 kEUR for the third quarter of 2022 from 26,900 kEUR for the third quarter of 2021.
Net other operating income increased to 1,166 kEUR from 355 kEUR for the third quarter of 2021.
Operating result amounted to (282) kEUR compared to 4,529 kEUR for the third quarter of 2021.
Net financial result was 2,173 kEUR compared to 4,203 kEUR for the third quarter of 2021.
The third quarter of 2022 contained income tax expenses of (478) kEUR, compared to (75) kEUR in the third quarter of 2021.
As a result of the above, net profit for the third quarter of 2022 was 1,413 kEUR, compared to 8,657 kEUR for the same period in 2021. Total comprehensive income for the third quarter of 2022, which includes exchange differences on translation of foreign operations, was 1,638 kEUR compared to 8,272 kEUR for the 2021 period.
At September 30, 2022, we had cash and cash equivalents of 150,621 kEUR compared to 196,028 kEUR at December 31, 2021. Gross debt amounted to 83,925 kEUR, compared to 99,107 kEUR at December 31, 2021. As a result, our net cash position (cash and cash equivalents less gross debt) was 66,696 kEUR, a decrease of 30,225 kEUR, and included the effect of our call option exercise to acquire 100% of the shares of Link3D, and of our acquisition of Identify3D.
Cash flow from operating activities for the third quarter of the year 2022 was 3,840 kEUR compared to 4,388 kEUR for the same period in 2021. Total capital expenditures for the third quarter of 2022 amounted to 9,441 kEUR.
Net shareholders’ equity at September 30, 2022 was 236,559 kEUR compared to 232,577 kEUR at December 31, 2021.
2022 Guidance
Mr. Leys concluded, “The revenue growth posted by each of our segments during the first nine months of this year strengthens our confidence that our full year 2022 revenues will be at least 10% higher than in 2021. While inflation and pressure on the labor market, which are higher and more persistent than we expected at the beginning of 2022, weigh on our results, we continue to make prudent investments in select growth businesses. As a result, we continue to expect that our consolidated EBITDA for the full year 2022 will be in the range of 20 mEUR to 25 mEUR.”
Non-IFRS Measures
Materialise uses EBITDA and Adjusted EBITDA as supplemental financial measures of its financial performance. EBITDA is calculated as net profit plus income taxes, financial expenses (less financial income), shares of profit or loss in a joint venture and depreciation and amortization. Adjusted EBITDA is determined by adding share-based compensation expenses, acquisition-related expenses of business combinations, impairments and revaluation of fair value due to business combinations to EBITDA. Management believes these non-IFRS measures to be important measures as they exclude the effects of items which primarily reflect the impact of long-term investment and financing decisions, rather than the performance of the company’s day-to-day operations. As compared to net profit, these measures are limited in that they do not reflect the periodic costs of certain capitalized tangible and intangible assets used in generating revenues in the company’s business, or the charges associated with impairments. Management evaluates such items through other financial measures such as capital expenditures and cash flow provided by operating activities. The company believes that these measurements are useful to measure a company’s ability to grow or as a valuation measurement. The company’s calculation of EBITDA and Adjusted EBITDA may not be comparable to similarly titled measures reported by other companies. EBITDA and Adjusted EBITDA should not be considered as alternatives to net profit or any other performance measure derived in accordance with IFRS. The company’s presentation of EBITDA and Adjusted EBITDA should not be construed to imply that its future results will be unaffected by unusual or non-recurring items.
Exchange Rate
This document contains translations of certain euro amounts into U.S. dollars at specified rates solely for the convenience of readers. Unless otherwise noted, all translations from euros to U.S. dollars in this document were made at a rate of EUR 1.00 to USD 0.9748, the reference rate of the European Central Bank on September 30, 2022.
Conference Call and Webcast
Materialise will hold a conference call and simultaneous webcast to discuss its financial results for the third quarter of 2022 on Thursday, October 27, 2022, at 8:30 a.m. ET/2:30 p.m. CET. Company participants on the call will include Wilfried Vancraen, Founder and Chief Executive Officer; Peter Leys, Executive Chairman; and Johan Albrecht, Chief Financial Officer. A question-and-answer session will follow management’s remarks.
To access the conference call by phone, please click the link below at least 15 minutes prior to the scheduled start time and you will be provided with dial-in details. Participants can choose to dial in or to receive a call to connect to Materialise’s conference call.
https://register.vevent.com/register/BI66dc4a1f45c744f2ad3d85501fc27140
The conference call will also be broadcast live over the Internet with an accompanying slide presentation, which can be accessed on the company’s website at http://investors.materialise.com. A webcast of the conference call will be archived on the company's website for one year.
About Materialise
Materialise incorporates 30 years of 3D printing experience into a range of software solutions and 3D printing services, which form the backbone of the 3D printing industry. Materialise’s open and flexible solutions enable players in a wide variety of industries, including healthcare, automotive, aerospace, art and design, and consumer goods, to build innovative 3D printing applications that aim to make the world a better and healthier place. Headquartered in Belgium, with branches worldwide, Materialise combines one of the largest groups of software developers in the industry with one of the largest 3D printing facilities in the world. For additional information, please visit: www.materialise.com.
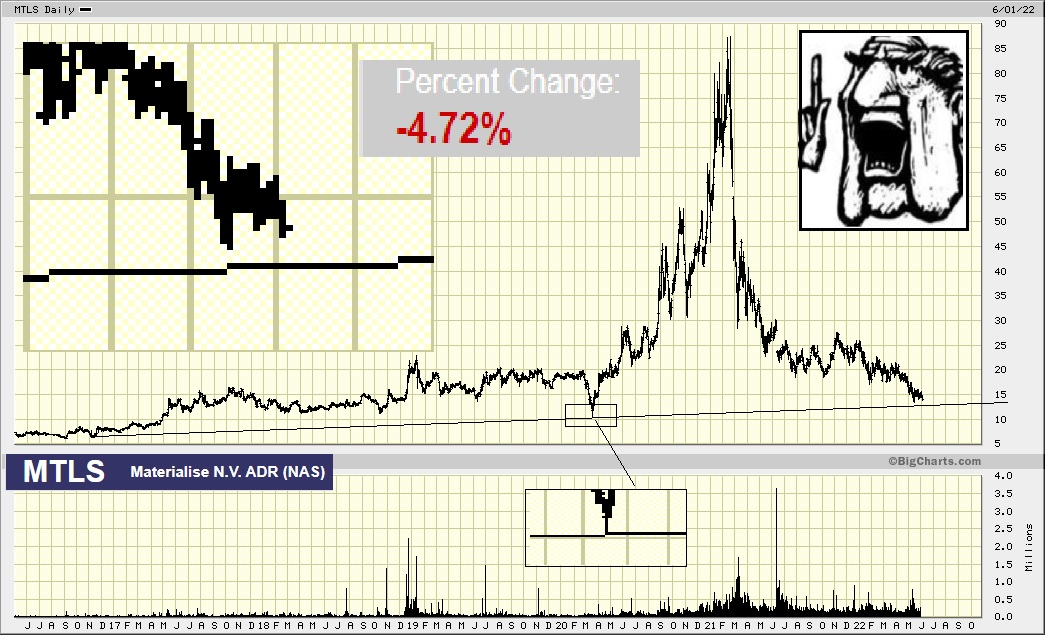
Thanks WB.
Right back at ya
May 2023 be kind(er) to all.
I am picking this to be my winner for the year.
HFNY Dad. Wishing you the best.
MTLS$ 3d-printing..one day print anything, da moon...
..MTLS$ yet another growth company at multi-year lows lol...
..MTLS$ positive earnings/increased revenue, supply chain solution.. let's GOOOOO!...
Hindsight is 20/20.. but still don't commit when call the bottom. MTLS$...
90 to 15 and today is the day? Any ten minute period in any name, index, etf or whatever. Call it before it happens not justify it after. History is cool and all but...
Oh, I see why you are so cranky today......
Okay well that explains things........Sorry !
.
9 months later.....
See post which this replies to
9 months ago
.
Good thoughts, maybe more linked to the home country? thanks ...
Only in so far as it affects currency. Foreign is in the eye of the beholder. I am seeing over 65% of revenue coming from Europe so not so much there. Americas are around 25% and Asia 10%. Check the dollar/euro to be sure but one sided rate changes usually translate into currency differences. I would imagine something as telegraphed as today's hike is hedged or factored in on the larger multinationals.
If you are talking about the ADR...
https://www.advisorperspectives.com/commentaries/2017/08/30/yes-adrs-do-carry-foreign-currency-risks#:~:text=The%20price%20of%20an%20ADR%20is%20affected%20by,holds%20local%20currency-denominated%20ordinary%20shares%20of%20foreign%20companies.
I have no clue. I wish I did but still holding/trading as seen fit.
GL!
I wonder if foreign stocks take forex hit on rate increase?...
hope the same.. MTLS let's GOOOOOO !!
Thanks Dad. Hope you are doing well.
Materialise GAAP EPS of $0.09 beats by $0.03, revenue of $64.56M beats by $5.57M
https://ih.advfn.com/stock-market/NASDAQ/materialise-nv-MTLS/stock-news/87451024/materialise-gaap-eps-of-0-09-beats-by-0-03-reve
I'm wrong..world falling apart lol omg, Russia wins; so stupid..
World falling apart? I doubt it; Russia testing.. MTLS$...
Just buy out SGLB imo ...
Materialise (MTLS), another stock in the same industry, has yet to report results for the quarter ended December 2021.
This 3D printing software and medical and industrial products company is expected to post quarterly earnings of $0.06 per share in its upcoming report, which represents a year-over-year change of +50%. The consensus EPS estimate for the quarter has remained unchanged over the last 30 days.
Materialise's revenues are expected to be $60.92 million, up 9.6% from the year-ago quarter.
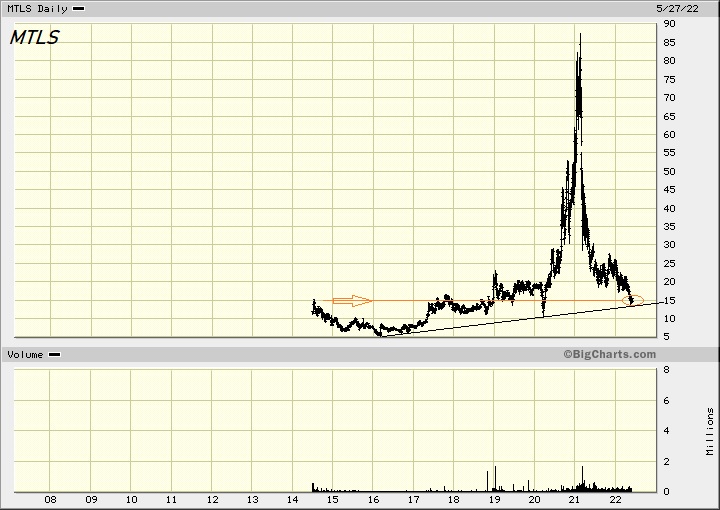
Maybe little momentum here?.. MTLS$ over $25, c'mon...
I think I'll get some ice cream and watch tv, best wishes ...
MTLS$ ...
Materialise and Sigma Labs Develop Breakthrough Technology to Advance Metal Additive Manufacturing
https://www.accesswire.com/685536/Materialise-and-Sigma-Labs-Develop-Breakthrough-Technology-to-Advance-Metal-Additive-Manufacturing
looking pretty good here today.
buy opportunity imo.. MTLS$...
Less happy under $20, ouch, wtf?.. profitable.. MTLS$...
What take-down today..happy buyer under $23 here.. MTLS$...
One day will be over a hundred PPS imo.. MTLS$...
Wish I could say the same. Added to DM today. Lucy is going to let me kick that ball one day. MTLS is still one of my largest individual holdings. I can't see anything but growth on their horizon.
I was lucky enough to get into LCID last month. I think I will let that one ride for a while.
Sold meanderers today.. added to favs MTLS$...
Great news; buy out SGLB competitor no less.. MTLS$..
Materialise Exercises Option to Acquire Link3D
https://ih.advfn.com/stock-market/NASDAQ/materialise-nv-MTLS/stock-news/86555436/materialise-exercises-option-to-acquire-link3d
..keep going MTLS$, core position here, gl...
MTLS
Mr. Market does
I am.
GL!
Mr Market sure likes it. You watching this Dad?
Not bad. Profits are good. If they keep the top line growing, we could see those pre covid prices again.
Press Release: Materialise Reports Third Quarter 2021 Results
6:30 am ET October 28, 2021 (Dow Jones) Print
Materialise Reports Third Quarter 2021 Results
LEUVEN, Belgium--(BUSINESS WIRE)--October 28, 2021--
Materialise NV (NASDAQ:MTLS), a leading provider of additive manufacturing and medical software and of sophisticated 3D printing services, today announced its financial results for the third quarter ended September 30, 2021.
Highlights -- Third Quarter 2021
-- Total revenue increased 28% to 52,195 kEUR for the third quarter of 2021
from 40,785 kEUR for the 2020 period.
-- Total deferred revenues from annual software sales and maintenance fees
increased 547 kEUR to 30,789 kEUR compared to December 31, 2020.
-- Adjusted EBITDA increased 62% to 9,739 kEUR for the third quarter of 2021
from to 6,023 kEUR for the 2020 period.
-- Net profit for the third quarter of 2021 was 8,652 kEUR, or 0.15 EUR per
diluted share, compared to a loss of (282) kEUR, or (0.01) EUR per
diluted share, for the 2020 period.
-- Total cash was 194,946 kEUR at the end of the quarter.
Executive Chairman Peter Leys commented, "While the COVID-19 pandemic lingers on in certain parts of the world, our record third quarter results show that Materialise is coming out of this crisis stronger than before: our revenue grew by 28% to a quarterly record of 52.2 kEUR and solid operational performances in all three of our segments resulted in a quarterly Adjusted EBITDA record of 9.7 million EUR. We plan to continue to invest to further accelerate our growth and look forward to introducing new product upgrades at next month's Formnext in Frankfurt."
Third Quarter 2021 Results
Total revenue for the third quarter of 2021 increased 28.0% to 52,195 kEUR from 40,785 kEUR for the third quarter of 2020. Adjusted EBITDA increased 62% to 9,739 kEUR from 6,023 kEUR in the previous period. The Adjusted EBITDA margin (Adjusted EBITDA divided by total revenue) for the third quarter of 2021 increased to 18.7% from 14.8% for the third quarter of 2020.
Revenue from our Materialise Software segment increased 10.4% to 10,468 kEUR for the third quarter of 2021 from 9,478 kEUR for the same quarter last year. Segment EBITDA increased 19.1% to 3,708 kEUR from 3,114 kEUR while the segment EBITDA margin increased to 35.4% compared to 32.9% in the prior-year period.
Revenue from our Materialise Medical segment increased 10.2% to 18,910 kEUR for the third quarter of 2021 compared to 17,161 kEUR for the same period in 2020. Segment EBITDA decreased to 5,251 kEUR from 5,476 kEUR while the segment EBITDA margin was 27.8% compared to 31.9% for the third quarter of 2020.
Revenue from our Materialise Manufacturing segment increased 61.2% to 22,817 kEUR from 14,154 kEUR for the third quarter of 2020. Segment EBITDA increased to 3,546 kEUR from a loss of (321) kEUR while the segment EBITDA margin increased to 15.5% compared to (2.3)% in the third quarter of 2020.
Gross profit was 31,076 kEUR, an increase of 33.4% compared to 23,303 kEUR for the same period last year, while the gross profit margin increased to 59.5% of total revenue compared to 57.1% for the third quarter of 2020.
Research and development ("R&D"), sales and marketing ("S&M") and general and administrative ("G&A") expenses increased, in the aggregate, 11.3% to 26,900 kEUR for the third quarter of 2021 from 24,176 kEUR for the third quarter of 2020.
Net other operating income was 355 kEUR compared to 1,157 kEUR for the third quarter of 2020. Operating result increased to 4,529 kEUR from 284 kEUR for the third quarter of 2020. Net financial result was 4,204 kEUR compared to (1,331) kEUR for the third quarter of 2020. The third quarter of 2021 contained income tax expenses of (80) kEUR, compared to 764 kEUR in the third quarter of 2020.
As a result of the above, our net result for the third quarter of 2021 increased 8,934 kEUR to a net profit of 8,652 kEUR, compared to a net loss of (282) kEUR for the same period in 2020. Total comprehensive income for the third quarter of 2021, which includes exchange differences on translation of foreign operations, was 8,267 kEUR compared to (1,659) kEUR for the 2020 period.
At September 30, 2021, we had cash and cash equivalents of 194,946 kEUR compared to 111,538 kEUR at December 31, 2020. Gross debt amounted to 102,180 kEUR, compared to 115,110 kEUR at December 31, 2020. As a result, our net cash position (cash and cash equivalents less gross debt) was 92,766 kEUR at September 30, 2021, an improvement of 96,338 kEUR compared to December 31, 2020.
Cash flow from operating activities for the first three quarters of 2021 was 17,490 kEUR compared to 14,752 kEUR for the same period in 2020. Total capital expenditures for the third quarter of 2021 amounted to 3,252 kEUR.
Net shareholders' equity at September 30, 2021 was 228,474 kEUR compared to 133,104 kEUR at December 31, 2020. In July 2021, we issued 600,000 new shares following the exercise of the underwriters' option to purchase additional shares, in connection with the public offering of 4,000,000 shares issued in June 2021.
2021 Guidance
Mr. Leys concluded, "We expect our consolidated revenues for 2021 to be towards the higher end of the 197,000 kEUR to 200,000 kEUR range we previously provided. For 2021, we are increasing our Adjusted EBITDA guidance from up to 25,000 kEUR to up to 28,000 kEUR."
Non-IFRS Measures
Materialise uses EBITDA and Adjusted EBITDA as supplemental financial measures of its financial performance. EBITDA is calculated as net profit plus income taxes, financial expenses (less financial income), shares of profit or loss in a joint venture and depreciation and amortization. Adjusted EBITDA is determined by adding share-based compensation expenses, acquisition-related expenses of business combinations, impairments and revaluation of fair value due to business combinations to EBITDA. Management believes these non-IFRS measures to be important measures as they exclude the effects of items which primarily reflect the impact of long-term investment and financing decisions, rather than the performance of the company's day-to-day operations. As compared to net profit, these measures are limited in that they do not reflect the periodic costs of certain capitalized tangible and intangible assets used in generating revenues in the company's business, or the charges associated with impairments. Management evaluates such items through other financial measures such as capital expenditures and cash flow provided by operating activities. The company believes that these measurements are useful to measure a company's ability to grow or as a valuation measurement. The company's calculation of EBITDA and Adjusted EBITDA may not be comparable to similarly titled measures reported by other companies. EBITDA and Adjusted EBITDA should not be considered as alternatives to net profit or any other performance measure derived in accordance with IFRS. The company's presentation of EBITDA and Adjusted EBITDA should not be construed to imply that its future results will be unaffected by unusual or non-recurring items.
Exchange Rate
This document contains translations of certain euro amounts into U.S. dollars at specified rates solely for the convenience of readers. Unless otherwise noted, all translations from euros to U.S. dollars in this document were made at a rate of EUR 1.00 to USD 1.1579, the reference rate of the European Central Bank on September 30, 2021.
Conference Call and Webcast
Materialise will hold a conference call and simultaneous webcast to discuss its financial results for the third quarter of 2021 on Thursday, October 28, 2021, at 8:30 a.m. ET/2:30 p.m. CET. Company participants on the call will include Wilfried Vancraen, Founder and Chief Executive Officer; Peter Leys, Executive Chairman; and Johan Albrecht, Chief Financial Officer. A question-and-answer session will follow management's remarks.
-- To access the conference call, please dial 844-469-2530 (U.S.) or
765-507-2679 (international), 4294784#.
The conference call will also be broadcast live over the Internet with an accompanying slide presentation, which can be accessed on the company's website at investors.materialise.com. A webcast of the conference call will be archived on the company's website for one year.
About Materialise
Materialise incorporates 30 years of 3D printing experience into a range of software solutions and 3D printing services, which form the backbone of the 3D printing industry. Materialise's open and flexible solutions enable players in a wide variety of industries, including healthcare, automotive, aerospace, art and design, and consumer goods, to build innovative 3D printing applications that aim to make the world a better and healthier place. Headquartered in Belgium, with branches worldwide, Materialise combines one of the largest groups of software developers in the industry with one of the largest 3D printing facilities in the world. For additional information, please visit: www.materialise.com.
JPM Initiating coverage at overweight with $28 price target.
This is my largest individual holding. High conviction for me.
Great to hear Dad.
..might even make some money here yet?.. MTLS$...
Nice couple of days here.
Hope you are doing well.
$24.. Let's GOOOOO !!!!.. MTLS$ ...
Get up over $23 imo.. MTLS$...
Up 5% is a good way to start the day.


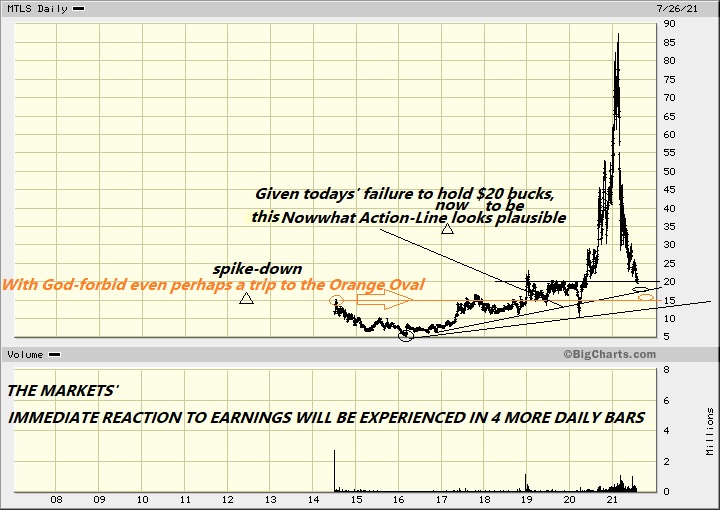
Not outta the woods yet - If the S&P were to sink, this thing'd get ALL THE WAY down to The Oval
|
Followers
|
25
|
Posters
|
|
|
Posts (Today)
|
0
|
Posts (Total)
|
718
|
|
Created
|
06/17/14
|
Type
|
Free
|
| Moderators | |||
| Volume | |
| Day Range: | |
| Bid Price | |
| Ask Price | |
| Last Trade Time: |


