 News
News  Market Data
  Discover
Support: 888-992-3836
Copyright © 2023 InvestorsHub Inc.


Register for free to join our community of investors and share your ideas. You will also get access to streaming quotes, interactive charts, trades, portfolio, live options flow and more tools.
Bloomberg: Billionaires go for gold
Updated 08:54 AM Aug 15, 2012
http://www.todayonline.com/Business/EDC120815-0000070/Billionaires-go-for-gold
NEW YORK - Billionaire investors George Soros and John Paulson increased their stakes in the biggest exchange-traded fund backed by gold as prices posted the largest quarterly drop since 2008.
Soros Fund Management more than doubled its investment in the SPDR Gold Trust to 884,400 shares as of June 30, compared with three months earlier, a United States Securities and Exchange Commission filing for second-quarter holdings showed yesterday. Paulson & Co increased its holdings by 26 per cent to 21.8 million shares.
Gold slumped 4 per cent in the second quarter, the biggest such loss since Sept 30, 2008. Prices fell as European Central Bank President Mario Draghi and Federal Reserve Chairman Ben S Bernanke failed to increase stimulus measures, damping the outlook for global growth and demand for the metal as a hedge against inflation. The price is down 0.1 per cent since June 30.
"It's all about easing, and people are waiting for the Fed since investors expect prices will rise," if the central bank announces more bond purchases, said Mr Walter "Bucky" Hellwig, who helps manage US$17 billion (S$21.2 billion) of assets at BB&T Wealth Management in Birmingham, Alabama. "People are willing to hold on to gold to see what the Fed will say."
The metal surged 70 per cent from the end of December 2008 to June 2011 as the Fed kept borrowing costs at a record low and bought US$2.3 trillion of debt in two rounds of so-called quantitative easing. Gold erased its gains this year in May as investors favored sovereign debt and the dollar as economic growth slowed.
Spokesmen for Mr Paulson and Mr Soros declined comment. BLOOMBERG
A High Frequency Attack on Gold
By: Dimitri Speck
Thu, Aug 9, 2012
http://www.safehaven.com/article/26474/a-high-frequency-attack-on-gold
On June 7th, 2012, the price of gold dropped by $22 in less than a second, guided by a computer algorithm during late trading.
Sharp price drops in gold, for example $10 within a few minutes, can be observed frequently. Often they occur several times per week. The decline that happened on June 7, 2012 looks, at first glance, like such a drop as well, although some observers immediately noticed the extremely high speed. Market reports assessed the timeframe from "43 seconds" to "less than 5 minutes". According to spot price data with minute precision, the decrease was $20 in less than 2 minutes. The intraday chart below shows the price development in the spot market on June 7, 2012. The relevant decline is marked in red.
Gold often drops sharply within a few minutes for no obvious reason. It did so on June 7, when the decline during late trading was very fast.

Fig 1.
A High Frequency Attack
However, what took place in the late evening hours of June 7th on the futures market is of a wholly different quality. As part of the CME Group, COMEX is the largest exchange for gold futures contracts. The exchange records each single trade with the exact time, price and quantity. These records are called Times & Sales report and are available from the CME. They reveal for June 7, 2012 for the period of one second, namely at 9:21 PM and 20 seconds CDT, a complex price attack in the high frequency range which can be performed only by especially programmed computers.
During that one second 501 prices were determined, among them 490 with volume, while during all other 3599 seconds of this trading hour on average only 1.87 trades per second were registered. In this once second the number of trades suddenly rose 260-fold! Figure 2 shows an excerpt of the Times & Sales report with the start of the relevant second for the most active August contract.
The future exchange provides Times & Sales reports with all trades. At 21:21 (9:21 PM) there was one trade in each of the seconds 16 - 19. However, in second 20 a total of 501 quotes were registered. The first of which was already pointing downwards.

Fig. 2, Source: CME
Investigation of the Exchange's Records
The left column shows the trade time with a resolution of one second. Next to it, the figure lists the price, the volume and where applicable additional information (such as cancel). During the first seconds, we can see a low trading activity with one trade per second. This is normal for this period late in the evening. Then the high frequency attack started. Please consider that the excerpt below only shows the first seven of a total of 490 trades of the second 21:21:20. Faster than a machine gun, one trade after another is executed in milliseconds or faster. The excerpt shows that the price dropped already $3.7 at the start of the relevant second. The many small trades also demonstrate that the reason for this activity was not just a large misplaced order. But during this one second more oddities occurred. Figure 3 shows another excerpt from the Times & Sales report of the relevant second.
During second 20, a series of sharp drops took place in the range of milliseconds. The example shows a drop of 8.3, down from 1578.1 to 1569.8.

Fig. 3, Source: CME
Flash Drops within Milliseconds...
The excerpt starts with two trades at $1578 and a small rise to $1578.1. But then the price abruptly drops by $8.3! As quick as a flash, one trade after another is executed at this much lower price of $1569.8 with the volume of only one contract. We notice significantly lower prices appear in the most active contract within milliseconds. Actually one would expect that there were many trades in between due to limited buy orders being in the market. As the price sank, there was no execution all the way down the 83 steps of $0.1 each. But then there were eight trades at once at $1569.8 with a volume of exactly one. It seems as if the trades have been shot under the buy limits of other market participants.
...Followed by Recoveries
However, this low shot is not an isolated case. Sudden drops of at least $7 without a price in between appeared five times in the relevant second. In addition there were several smaller declines. But the prices recovered almost always completely in between! Thus there are apparently some buy orders. This rapid up and down appears as if the other market participants awakened from milliseconds of sleep, then placed their orders, only to fall right back into another millisecond nap. In reality, however, a high frequency computer program was active which generated a large number of individual trades to manipulate the price.
The Attack's Second in Detail
Now we look closely at the second 21:21:20. The figure below shows all the prices in the relevant second, an Intra-Second Chart, so to speak. As is common, the vertical axis indicates the price in dollars per ounce. On the horizontal axis the trades during that second are sequentially numbered. In addition, the prices before and after are shown, and so-called indicative prices (in red).
The almost 500 trades of second 20: Clearly visible are many sharp drops, followed by recoveries. These movements happened in fractions of a second.

Fig. 4, Data source: CME
High Frequency Up & Down
We can clearly see the up and down of the prices. Neither a mistrade, nor a move in the spot market, nor a building up of several high frequency programs (like in the flash crash of the stock market on 6 May, 2010) can cause such swings. In addition, the hundredfold increased number of trades and volume can eliminate such causes. Also the spot market can't be the cause in question, as it lagged behind the sharp drop. Instead it was a phenomenon of the futures market. Generally, no person but only a high frequency computer program can act so fast. Due to the lack of any suitable alternative, its purpose must have been price manipulation. Indeed it was achieved: the price stayed more than $20 lower for hours - time enough to get back the costs of the operation.
The Trading System of the Exchange
At this point a look at the trading system of the CME is merited. Due to the conspicuous price movements, the CME halted trading on 7 June 2012 already during second 21:21:20 for 40 seconds by a program called Stop Spike Logic. This also means that the 500 price movements took place in less than a second! While this reaction of the trading system makes sense, other procedures are questionable. For instance so called indicative prices should appear only when no trading takes place (indicative prices are estimates where supply and demand would meet). However, the Times & Sales report shows indicative prices during trading even before the halt (see Figure 4). These prices stood repeatedly at $1556 or about $22 lower than in the second before. At the same time this was already the level at which trading should start again after the halt. The CME was not able or not willing to explain how this could happen despite repeated inquiry and detailed explanations of the facts. For the sake of completeness, it should be noted that at this point there were no news for the gold market and that other markets such as currencies, bonds or stocks showed no significant price movements (except of silver).
Conclusion
High frequency programs which now account for a significant share of trading activity have rightly fallen into disrepute in recent times. They might be useful in some cases such as avoiding market impact while placing large orders. However, unequal access to the market is questionable as are highly technical efforts which are ultimately done only to pull money out of the pockets of slower market participants. At the very latest, limits of legality are touched when high frequency programs are used for front running or to manipulate prices. Such a price manipulation took place on June 7, 2012, at 9:21 PM and 20 seconds in form of a high frequency attack on gold. One second was enough to manipulate the price of gold down by more than one per cent for the duration of several hours. Although in the past central banks repeatedly intervened in the gold market, it is unlikely that this action was done by a central bank. In the field of high frequency trading, the technical complexity and the necessary level of experience and specialization are probably too high. Therefore, a private financial institution must have done the high frequency price manipulation to achieve a trading profit. This was a well-defined incident in thin trading, limited to a short time period and to a single market. These conditions make it ideal for a successful investigation by the regulatory authorities.
A gold standard is a monetary system in which a fixed weight of gold becomes the store of monetary value. Under the gold standard, bank notes and coins can be exchanged for gold. If multiple countries follow a gold standard, their foreign exchange rates become fixed. The international gold standard emerged in the late nineteenth century following an extended period of monetary instability characterized by disruptions related to silver shortages and the gradual emergence of central banks. The stability subsequently following this international gold standard is credited with facilitating the first era of globalization prior to WWI. A gold standard of some form persisted for about a century, until the Bretton Woods agreement collapsed in the 1970s when the US stopped exchanging dollars for gold. A return to the gold standard has contemporary advocates. They claim the gold standard could help insulate the world economy from government monetary mismanagement.
US Treasury Bonds False Safe Haven, GOLD is the True Sanctuary
Interest-Rates / US Bonds
Jul 26, 2012 - 02:11 AM
By: Jim_Willie_CB
http://www.marketoracle.co.uk/Article35775.html
As preface, consider that the USTreasury 10-year yield went below 1.4% this week. Some unenlightened celebrate the asset appreciation and point to a successful asset in performance in an otherwise dismal financial market. The Jackass said in the June 6th public article "USTBonds: Black Hole Dynamics" that such a success is a marquee billboard message of economic meltdown and systemic failure. As the rally continues, possibly the onliest rally outside of corn and soybeans in yet another disaster, people should focus on whether the systemic collapse will occur before the 10-yield hits 1.0% in my warning. Focus on four major points:
~ The unspoken effect of ZIRP (0%) is the powerful ongoing destruction of capital, as the entire cost structure rises
~ As equipment goes off line further, the USEconomy will weaken further, in a powerful vicious cycle
~ The official Zero Percent Interest Policy is the calling card of the Gold Bull Market, powered by negative inflation adjusted returns on savings
~ The USTBonds will fail from their own success, unleashing the Gold Price when the investment community and global creditors realize no further potential appreciation in the most massive asset bubble in modern history, supported by Interest Rate Swap derivative machinery. Money will eventually fly out of bonds and seek true safe haven.
Fear not. The USTBond 10-year yield (TNX) will not and cannot reach below 1.0% as all ponderings of a world with 0% on 10-year yield are divorced from reality. The Black Hole is working hard, gathering force, amplifying the gravitational field. It is happening right on schedule, no surprise here, a very easy correct forecast. The original supposed Flight to Safety in the USTBonds was totally fabricated and phony. As mentioned at least a dozen times by the Jackass, the last half of year 2010 saw the dutiful Wall Street outpost Morgan Stanley devote a fresh $8 trillion in interest rate derivatives, fully documented by the Office of the Comptroller to the Currency. Their reports never make the headlines, since they are so chock full of rancid fetid scum. As the TNX marches down the swirling pathways within the vast USGovt debt sewer-like cisterns, their energy will be derived from the massive recession that has engulfed the USEconomy. Not only is the flight to safety in the USTBond complex a total fabrication falsehood, but the USEconomic recovery is also a fiction written on political propaganda posters. The followon flight to the bubble ridden USTBond is based upon economic wreckage and broad disintegration of the entire periphery and surrounding core to the bond market. The great sucking sound can be heard, much like during the non-earthquake in Virginia in September 2011. Experienced traders are looking at each other, in full recognition that the TNX rally is indeed an endgame signal.
THE BRUSH FIRE PHENOMENON
The LIBOR scandal unleashed brush fires. They started in London but extend throughout the entire Western banking treeline. The scandal that started at Barclays and Lloyds has hit Deutsche Bank, as well as Citibank and JPMorgan. Many more pages will be written on the LIBOR brush fire, as the damages are delineated by those on the opposite side of the price rigging table. The USFed, Bank of England, and Euro Central Bank are directly implicated, casting corrupt light on the central bank franchise system. The clownish supposed economic expert Larry Kudlow actually attempted to claim the crime scene had no victims, as all benefit across the system. The naive Wall Street defender (carnival barker) must not be aware of the damages claimed by the mortgage underwriters in the lending industry, by corporations seeking stable bond yields, and by the swap recipients in countless state government agencies. A figure was put forth this week that caught my eye. For every single basis point in the LIBOR price rig, fully $50 billion in effects result. The market is huge, involving a staggering $370 trillion in worldwide debt. Expect hundreds of high profile lawsuits. Expect dozens of class action lawsuits. Expect well over $1 trillion in total declared damages from the legal attempts at remedy. LIBOR will not go away, since it is actually the heart & soul of the entire lending industry, and of the shadowy derivative market. LIBOR funds the vast derivative market, which is becoming frazzled in a slow disintegration. The brush fire will burn down the USTBond Tower and render useless its Interest Rate Swap buttress structural support, both of which are in an implosion mode.
This article is not about LIBOR and its inner workings, the damage suffered by mortgage underwriters, the short changing of corporations and state agencies involved in swaps. Instead, this article is about the serious jumps in the brush fire, jumps to new areas of scandal, which will take down the system. In no way is the list of potential new fire zones comprehensive. Perhaps a few more will result, since large burning tree branches have a way of being lifted by the high winds of controversy fanned by deep suspicion. The entire document discovery process will be exploited to the fullest, a vast crowbar. Once the lid is lifted via legal discovery of LIBOR criminal collusion, all is fair game to be viewed and pulled out of the vast sea of scum, filth, and rancid paper floating within the big bank balance sheets. It is all admissible evidence. Then there are the communications often shown to be highly revealing to establish motive and paint the pictures in more detail. No longer are those analysts like the Jackass considered biased, tilted, and off the mark when they cite financial corruption as an ongoing theme year after year. The corruption is coming to the surface, fully visible, in a manner to render perhaps fatal damage to the system. My theme has been systemic failure from the inefficiencies and corruption wrought by the Fascist Business Model. Witness it!
My focus is on jumps in the big brush fire that escalate the financial criminal exposures. Entirely new areas of criminal exposure, investigation, and prosecution will emerge. LIBOR was the center, and Barclays was the banker's bank, which owns sizeable equity shares of numerous global banks. Leave aside the difficult questions as to why and how the LIBOR fraud was revealed, and why and how the crime was not shoved under the rug as usual, and what higher power is controlling and orchestrating the maneuvers. LIBOR and Barclays lie at the heart of the Western banking cartel and power structure, labeled corrupt to the core. The big banker brush fire has begun. It is raging, but it will spread to create several other nasty brush fires. The jumps will occur easily, the process having already begun.
MONEY LAUNDERING & NARCOTICS DEPENDENCE
Just in the last ten days, the brush fire jumped into the drug money laundering forest. Permit an imagery jump as well, even though mixed imagery is a cardinal sin of composition. But since on the topic of jumping, a shift in the blaze of imagery might be appropriate. The money laundering of narotics funds is a vast industry. The United Nation task force identified the United States as being unduly reliant upon the benefits of drug money infusion into the banking system following the 2008 Lehman bust, sufficient to prevent a collapse. The UN document reports were published in 2009 and again in 2010. What better place to funnel the money than into the primary banking system from the USGovt agencies responsible for the vast clearing house functions. Representative Ron Paul has addressed this problem in direct accusations. Here is the imagery jump. The operations of money laundering are like a collection of wires without insulated coatings laid out on dark basement floors, one from each bank. The participating big banks do not always have full knowledge of the other and their activities. Many countries are involved, as the distribution rings are vast, like with Mexico in the recent incident. So the wires occasionally cross each other and cause troublesome sparks. The High Scandal in Bank Collusion has already caught fire in the money laundering rings. The bank in the spotlight has been encouraged to align its wires properly, according to the Cooperative Installation Alignment codes from the Underwriters Lab south of WashingtonDC. They will comply, or else resignations will be the least concern of the bank executives. Their lights might go out. This is a topic loaded with risk. The message to take away is that all the major US banks are deeply committed to narco money laundering, which tie in with defense contractors who serve as errand boys and delivery hosts.
INTEREST RATE SWAP & FALSE USTBOND SAFE HAVEN
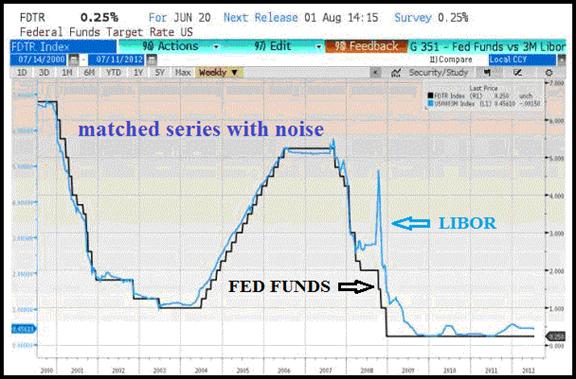
The next jump in the banker brush fire might be the revelation of the primary role played by the Interest Rate Swap derivative contract device. The JPMorgan chief investment office is tasked with fabricating the USTreasury Bond rally. They must maintain the near 0% bond climate despite chronic $1.5 trillion deficts to securitize and largely absent foreign creditors. They farm out the duty to their Morgan Stanley outpost. Hundreds of $billions in artificial USTBond demand can be produced, with trumpets blown by strumpets calling the flight to safety in toxic USTBonds. Recall that the cost of funding the IRSwap mechanical abuse is the ultra-cheap LIBOR rate. Notice the tight correlation between the US FedFunds official rate and the LIBOR rate. The price rigging in the LIBOR came about since the banks refused to lend at the absurd 0% rate dictated by the USFed, working in close concert with the Bank of England. The banks were willing to speculate at that rate, but not to lend at that rate. The target could not be sustained. So the participants to the consensus procedure lied to each other, complete with memos, adorned by winks. The practicality of the ZIRP could not extend into the real world without further collusion.
The scandal will hit the Interest Rate Swap devices and reveal the artificial nature of the entire flight to safety in the USTreasury Bonds. They will be more visible under document discovery amidst the LIBOR investigations. The heavy machinery of the IRSwaps has been exposed to some extent from the May losses suffered by JPMorgan, as reported by the Jackass and confirmed by CEO Dimon. They lied and gave blame to the European sovereign debt fluctuations, when they were actually stable during the focused period of six weeks. Big fluctuations were seen in the USTBond market though, identified in my past analysis. Expect further revelations and documented evidence of vast rigging process in the USTBond market, using the IRSwap devices. The flight to safety will be revealed as a sham. It is only natural in the brush fire jumps.
INSOLVENT BANK RECOGNITION & FASB ACCOUNTING
Another jump in the banker brush fire might be the revelation of the deep insolvency within the big US banks, managed and kept hidden by vast accounting fraud. Recall that in April 2009, the USCongress passed a law to bless FASB rules which allow for accounting fraud. The big banks were permitted to declare any value they wish for all manner of toxic and rancid assets lying within their balance sheet. So they went on course to choose the original book value for many imploded toxic assets like mortgage bonds, like worthless collateralized bond obligations, and many other wonders of financial engineering devised by the wrecking crew on Wall Street. Imagine a raft of memos from bank executives like the chief financial officers, admitting that they are all too aware that balance sheet items were being declared as having untrue values, during quarterly earnings reports. The Sarbanes Oxley violations are too numerous to count.
Imagine the stream of memos expressing concerns over revelation that the banks were aware of the false values disclosed. They will be more visible under document discovery amidst the LIBOR investigations. Imagine mention with relief that the officially sanctioned FASB accounting rules permitted the fraud, replete with fictional values set for assets to share holders in the legal exercise. The giant banks are almost all dead zombies, insolvent to the core. The scandal will likely hit the Financial Accounting Standards Board (FASB) methods and the coverup of deep insolvency. The banks are not performing their normal lending function, since they are insolvent, citing tighter borrower requirements. Tragically, both the borrower is impaired and the lender is insolvent. Expect further revelations and documented evidence of vast falsification of the accounting process in the legally required financial reporting, using phony FASB rules. It is only natural in the brush fire jumps.
NON-US$ TRADE SETTLEMENT & BANK RESERVES MGMT
Another jump in the banker brush fire might be the revelation that the big US banks are preparing for a Paradigm Shift. The Eastern nations are well along a path to settle trade outside the USDollar. The Chinese have arranged for bilateral currency swap agreements with a gaggle of nations, mostly from the East, but also Brazil in the West. Consider such agreements to be the foundation for barter systems coming into vogue. The key is their non-US$ nature. The entire loss of global trade settlement done in the US$ terms is being elevated in importance. Some day soon, it might become the majority of trade. The tipping point could come when over 50% in trade excluding crude oil is managed outside the US$ settlement. Later, like in a year or so, maybe a bigger tipping point could come with over 50% of all trade including crude oil being managed ouside the US$ sphere. The big banks must see the trend, unless they wear blinders, unless their arrogance is so thick, or unless they are so pre-occupied with other brush fires that they leave themselves vulnerable and unprepared.
A very important tenet of global trade and banking is that trade dictates banking activity, not the other way around. It used to be for decades that the USDollar global standard required all trade to be settled in its reserve currency. The banking structures must reflect the reality of trade settlement methods and practices. However, the mortgage bond crisis laden with banking fraud in mortgages and foreclosures rendered damage. The TARP Fund patch job with bait & switch in executive largesse rendered damage. The USFed bond monetization (called euphemistically Quantitative Easing) went out of control, causing a global rise in energy and food prices. The result was great damage rendered. The endless foreign wars on a credit card have caused deep resentment, replete with fraud among the service contractors, also rendered damage. The Iran sanctions, further distracting from the basic violation of Iranian oil sales outside the US$ sphere, have resulted in tremendous insurrection against the global reserve currency.
The major Paradigm Shift in trade has been the emergence of non-US$ trade settlement and the development of devices to facilitate the skirting end around process. Therefore, the banking system must adapt or be left isolated. The big US banks might soon be caught in revelations that they are preparing for shunning of the USDollar in trade payments and satisfaction. They might reveal processes already in place to dump USTreasury Bonds at their artificially lofty values, maintained by high powered Interest Rate Swap machinery during a falsely engineering flight to safety. Imagine open communications about demanded IRSwap usage to maintion artificially rigged high bond principal values. They will be more visible under document discovery amidst the LIBOR investigations. If the big US banks are shown to be diversifying out of USTBonds during the current crisis, it would indeed be devastating news against the Dollar Fortress. Expect further revelations and documented evidence of diversification away from the bubblicious overvalued USTBonds, as the trade settlement pathways avoid the US bull chits. It is only natural in the brush fire jumps.
ALLOCATED GOLD & 40 THOUSAND METRIC TONS SHORT
An assured jump in the banker brush fire will be the revelation of massive raids on Allocated Gold accounts done systematically over two decades. The big Western banks have been illegally grabbing the gold bars via unauthorized leasing, then selling them in the open market in order to maintain the artificially low Gold & Silver prices. The process of revelation is already well along, with important major lawsuits in Switzerland. The Matterhorn case where Von Greyerz pointed out the long delays for his fund investors to receive their gold bars from Allocated accounts has added to the controversy. The gold bars arrived with stamps and dates much younger than the original bars owned, lifting the veil of fraud. The scandal has not yet reached the public eye, but it will very soon. Some Gold experts call it The Mother of All Gold Scandals. Several class action lawsuits totaling several $billion are underway in the elite banker nation of Switzerland. So far, the coopted press has kept a lid on the story. The leaks will be natural, like an overflow of chocolate from the vat. The documents concerning the serious illegal activity will be more visible amidst document discovery during the LIBOR investigations.
My best source shared in 2010 that at least 20 thousand tons of Gold had improperly been taken, leased, and replaced with gold paper certificates in vaulted locations. The bullion bankers were dangerously short. In 2011, he admitted that the criminal activity had easily surpassed 40 thousand tons of Gold illegally leased, resulting in a massive short position for the bullion banks. In 2012, he increased his estimate to between 40 and 60 thousand metric tons of gold illegally seized from Allocated Gold accounts, the short position totally out of control and absolutely impossible to bring into balance with short covering. In the last week, he passed along a communication with a veteran Gold expert with decades of savvy experience. They concluded that remedy for the vast gigantic short position by the gold bullion bankers will send the Gold price well over $10,000 per ounce. They believe probably by the end of the criminal prosecution remedy, the resolution of the defrauded Allocated gold accounts, and the installation of the new trade system alternative, the Gold price will find a natural value at least twice that elevated value. Expect further revelations and documented evidence of vast Allocated Gold account raids, and improper raids to gut the Exchange Traded Funds (GLD, SLV). It is only natural in the brush fire jumps.
The Gold Bull will hit on all eight cylinders, and adopt another four cylinders, when the Allocated Gold account fraud is revealed and hits the news. Only then will public calls for broad criminal prosecution be accompanied by equal calls by the very wealthy. By then, speculation will extend to how high the Gold price can go, and to what limit. Think at that point, unlimited extensive money growth, a gaggle of futile bank aid packages, and currency debasement abuse from the hyper monetary inflation underway for over four years. The Gold price must match the abuse stride for stride, when at the same time react to forced bullion banker purchases of Gold in order to replace the raided Allocated accounts. A frenzy will come.
2011 BANK HEIST & DISPOSITION OF ASSETS
A potential disruptive jump in the banker brush fire would be the revelation of disposition of World Trade Center vaulted assets. Only a moron would believe they vanished. Refer to the enormous amount of purported missing gold bullion, the enormous amount of purported missing bearer bonds, the enormous amount of purported missing diamonds from the infamous 911 event. The political implications would be vast, far more damning than the smoking guns by scientists. They would eclipse any and all claims made by engineers and architects (see AE1000 Group) that undermine the official poppycock story. The documents concerning the flow of gold, bonds, and diamonds might be more visible under document discovery amidst the LIBOR investigations, if a bank heist were to be demonstrated. It is a difficult task to conceal the movement of $100 billion in gold bars, $100 billion in bearer bonds, and $100 billion in diamonds, if indeed it was a bank heist. The Jackass scientific background has consistently brought attention to the vast inconsistencies due to gravitation pull in freefall, to the inadequate burning temperature of jet fuel to alter structural steel, and the absence of aircraft debris on the Pentagon lawn. All official stories have seemed like music on the other side of logic and physics.
Only flag waving morons sporting red white and blue jockey shorts believe the official story, in addition to diehard types who hold scientific evidence in contempt, along with senile veterans well past the octagenarian mark. No disrespect is meant to veterans, who often seem incapable of sorting evidence or even identifying a financial fascist out of uniform. Even the 911 Commissioners admit they were coerced to omit widespread evidence, including testimony from the New York Police Dept captains. They could not voice their objection too loudly, or else lose their jobs and likely pensions too. Whereas in 2003 and 2004 the critics seemed like crackpots, no longer do they seem so wild-eyed and lunatic. Some very well informed people believe the 911 event was actually a bank heist. The odd new twist is the reports that many people at the World Trade Center who were eyewitnesses have died mysterious deaths. Harken back to the Grassy Knoll from that infamous November 1963 event in Dallas. By the 1990 decade, a few dozen people had died from mysterious deaths, many being violent deaths, to the point that no eyewitnesses had survived. A mission accomplished in the sordid history of the United States. The bond trails already cast extremely suspicious light on Cantor Fitzgerald, which curiously moved all its data storage backup facilities to New Jersey only a few months before the incident. Perhaps further potential revelations and documented evidence toward disposition of WTC site assets will surface during the never ending discovery process. It is only natural in the brush fire jumps. One can only wonder what George Washington, Thomas Jefferson, John Adams, and Benjamin Franklin would have to say about these events, or even Dwight Eisenhower and Douglas MacArthur. The notion of patriotism has been redefined by force. Many patriots prefer to think and use the brain stem, turning away from the goose step. Then again, perhaps several hundred discrepancies, inconsistencies, and contradictions to the official story are just a coincidence and the work of our enemies.
MUTUALLY ASSURED DESTRUCTION
A very unusual phenomenon is at work. The three banker camps from the United States, London, and Western Europe are naturally going to protect their own pillboxes. A well connected banker source from Central Europe has shared that Deutsche Bank has already begun to cooperate with the International Court of Hague, working with Interpol officers, bank examiners, experienced attorneys, and judges to assist the prosecution of London and New York bankers. But Deutsche Bank cannot stop the assault by USGovt officials and their army of legal prosecutors, who will tear D-Bank apart. The London bankers have been exposed, laid bare, for the entire world to attack them. The resignations will continue like a parade, soon to involve the privileged groups among the Anglo elite. Expect far more lawsuit effects than prosecutions, since the USGovt legal staff is loaded to the gills with Wall Street friendlies.
The CFTC and SEC and FDIC and FBI have to date been attack dogs and protectors to the Syndicate in the entire scandalous decade. They are the Fascist Business Model soldiers in the field. To be sure, each of the three camps will attack in round after round, bringing charges, seeking remedy, forcing executive sacks, levying fines, and more. They will each enable high ranking bank executives to turn state's evidence, to flip, but the lines of jurisdiction cannot be altered. Each region will protect its own, and attack the other two. A fight to the death might have begun. The banker attacks will not put each other's executives in jail, as much as wreck the Western banking structures. Witness the Competing Currency War in a late stage, as it has reached a new level of financial violence. The Wall Street marketing corps, and the noble financial press, have chosen to trumpet the message that European weakness translates to American advantage. It is like Al Capone competing with Bugsy Moran. It is like John Gotti pointing a finger at Michael Corleone. In the end, they will both succumb to the pressures and the light. Their ships at sea are listing and taking on water. They will all sink. The life boats are made of Gold with Silver linings
GOLD IS THE TRUE SANCTUARY
The concept of solutions for the global monetary system, the global currency system, and the global banking system, have become outright laughable and an insult to the intelligence of observers. The paper system has become weighed down by toxic assets to the point of rendering the entire system insolvent and sinking its future prospects. No new debt can repair and provide remedy for the fatally sick and current overly indebted dying system. The new trade settlement facilities are ready to put in place, based upon a Gold & Silver core. That word has come from a source directly involved in the preparation process for the Eastern Fortress. The trade notes will provide the lubrication to complete trade, which will have a hard asset core. The USDollar will gradually fade away from trade settlement, except for the United States, Canada, the United Kingdom, and possibly Southern Europe. The great tipping point approaches, whereby over half of global trade will be settled outside the domain of the crippled toxic USDollar. The foreign participants can no longer tolerate the bank bond fraud, the central bank debasement, and the usage of bank devices as weapons.
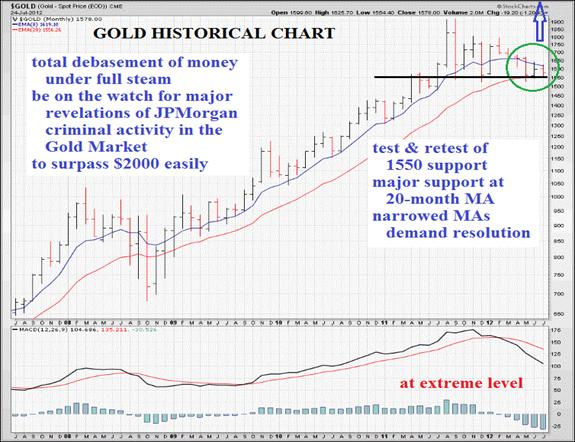
Major changes are coming. A return to a certain type of Gold Standard is right around the corner, awaiting the Western collapse that is in a late stage of pathogenesis. The jumping brush fires that the London, New York, and Western European bankers must contend with will eventually envelop them, doling out massive smoke inhalation. Worst of all, the jumps will expose new areas of corruption every few weeks, sufficient to bring down the system. After all, it is a fiat faith based system. The faith has long ago vanished. All that remains is power politics, arrogance, and corruption. The new system will force the Gold price above $5000 per ounce on a conservative basis. It is all part of the plan not yet revealed. The Gold/Silver Ratio will revert to 20:1 in time. That translates for the math impaired to a $250 per ounce Silver price. These are conservative figures.
THE HAT TRICK LETTER PROFITS IN THE CURRENT CRISIS.
From subscribers and readers:
At least 30 recently on correct forecasts regarding the bailout parade, numerous nationalization deals such as for Fannie Mae and the grand Mortgage Rescue.
"In my 40 plus years of business experience that includes stints in public and private companies as well as entrepreneurial ventures, I have read numerous newsletters in an effort to stay abreast of a rapidly changing world. In my opinion, you seem to be tying the pieces together better than any other source."
(BobT in Maine)
"Your monthly reports are at the top of my list for importance, nothing else coming close. You are the one resource I can NOT do without! You have helped me and countless others to successfully navigate the most treacherous times one can possibly imagine. Making life altering decisions during tough times means you must have all the information available with direct bearing on the decision. Jim Willie gives you ALL the needed information, a highly critical difference. You cant afford to be wrong in today's world."
(BrentT in North Carolina)
"You have warned over and over since Fall of 2009 that Europe would come apart and it sure looks like exactly that is happening. You have warned continually about the COMEX and now the entire CME seems to be unraveling. You must receive a lot of criticism regarding your analysis, trashing the man, without debate. Your work is appreciated. I do not care how politically incorrect or how impolite your style is. What is happening to our economy and financial system is neither politically correct or polite."
(DanC in Washington)
"The best money I spend. Your service is the biggest bang for the buck."
(DaveJ in Michigan)
by Jim Willie CB
Editor of the “HAT TRICK LETTER”
Home: Golden Jackass website
Subscribe: Hat Trick Letter
Use the above link to subscribe to the paid research reports, which include coverage of several smallcap companies positioned to rise during the ongoing panicky attempt to sustain an unsustainable system burdened by numerous imbalances aggravated by global village forces. An historically unprecedented mess has been created by compromised central bankers and inept economic advisors, whose interference has irreversibly altered and damaged the world financial system, urgently pushed after the removed anchor of money to gold. Analysis features Gold, Crude Oil, USDollar, Treasury bonds, and inter-market dynamics with the US Economy and US Federal Reserve monetary policy.
Jim Willie CB is a statistical analyst in marketing research and retail forecasting. He holds a PhD in Statistics. His career has stretched over 25 years. He aspires to thrive in the financial editor world, unencumbered by the limitations of economic credentials. Visit his free website to find articles from topflight authors at http://www.GoldenJackass.com . For personal questions about subscriptions, contact him at JimWillieCB@aol.com
Jim Willie CB Archive
© 2005-2012 http://www.MarketOracle.co.uk - The Market Oracle is a FREE Daily Financial Markets Analysis & Forecasting online publication.
HKEx will be able to use its influence with Beijing
ex.... to funnel
far more of China's metals buying activity through its
LME subsidiary -
http://www.telegraph.co.uk/finance/comment/damianreece/9335026/Like-a-lamb-London-surrenders-London-Metal-Exchange.html
GOLD to fiat$25K/oz + + with a fair level playing field -
without banksters 666 cult super red manipulations -
http://investorshub.advfn.com/boards/read_msg.aspx?message_id=75921900
history often repeat itself -
http://investorshub.advfn.com/boards/read_msg.aspx?message_id=76703885
God Bless
khazarian banksters 666 cult is too brainwashed
to care for their own or their family life -
the 666 total focus money, money, money -
http://doreenellenbelldotan.info/AdolfRothschildHitler.htm
Bolschevick khazarian (NOT Jews!) Killed 100 Million Mainly White Christians
Socialite says Socialism is Anti-Social
(And Locking in prices is "price fixing")
Silver Stock Report
by Jason Hommel, June 17th, 2012
(via e-mail)
Socialite says that Socialism is Anti-Social
Pro-Life' on 'Gold Futures Index - 
thanks great charts -
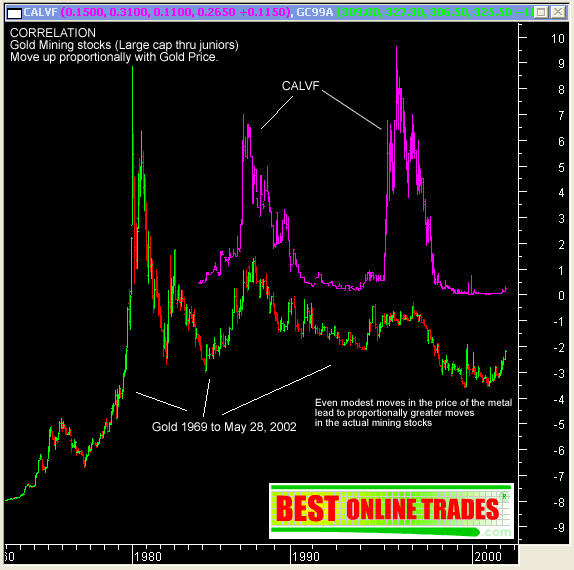
Fyi. your opinion on CALVF would be appreciated -
Caledonia Mining Corporation
CALVF Q1Rep. Net profit $7,111,000.-- after tax
for the 1stQuarter 2012 was $7,111,000.--
welcome back to Caledonia Mining Corporation (CALVF
good to see you and thanks for your opinion
CALVF Q1Report; Net profit after tax for the Quarter was
$7,111,000.-
compared to
$1,369,000 in the preceding quarter (which included
an impairment of $3,884,000) and
$1,894,000 in the comparable
quarter.
Basic earnings per share for the Quarter were
1.4 cents per share,
compared to
0.27 cents in the preceding quarter and
0.38 cents
in the comparable quarter.
At March 31, 2012 the Corporation had cash and cash equivalents of
$16,288,000.--
compared to
$9,686,000 at December 31, 2011 and
$2,217,000 at March 31, 2011.
Cash flow from operations in the Quarter before capital
investment was
$8,130,000 compared to
$3,506,000 in the
preceding quarter and
$4,686,000 in the comparable quarter.
http://investorshub.advfn.com/boards/read_msg.aspx?message_id=75452985
http://tmx.quotemedia.com/article.php?newsid=51148032&qm_symbol=CAL
CALVF is a well diversified company -

a subsidiary to CALVF holding the Blanket Gold Mine,
its 51% is sold for $30 million and
it may be final agreement by 2014 -
mugabe has used it to gain votes for the last 20yrs -
but lost the last election to -
Prime Minister Tsvangirai of Zimbabwe -
who got the majority and should be the President -
don't want it (and declared it null and void) -
mugabe 88yrs old with prostate cancer etc.
the time working in the right direction for CALVF -
Welcome to CALVF - Caledonia Mining Corporation -
well, good to see all @ CALVF
Presentations 2012 04-18-2012 Global Mining Finance
Spring Conference, London -
http://www.caledoniamining.com/pdfs/CALPres04182012.pdf
Q4 Results presentation Caledonia 2011 Annual 04-02-2012 -
http://www.caledoniamining.com/pdfs/CALPres04022012.pdf
Blanket Mine: A Photographic Tour 12-06-2011 -
http://www.caledoniamining.com/pdfs/CALPres12062011.pdf
the time flying and CALVF flying have repeated
its self twice great bull runs since I started to ride along
history often repeat itself -
http://chfir.com/mining/CAL
http://www.slideshare.net/CHFIR/caledonia-mining-corporation-april-2012
Global Mining Finance Spring Conference, London April 2012 -
http://www.caledoniamining.com/pdfs/CALPres04182012.pdf
Caledonia Mining - a low cost African Gold
$521.-/oz producer @ Q4/2011 -
http://investorshub.advfn.com/boards/replies.aspx?msg=59249631
ANNUAL REPORT PURSUANT TO SECTION 13 OR 15(d) OF
THE SECURITIES EXCHANGE ACT OF 1934 -
For the fiscal year ended December 31, 2011
http://secfilings.com/searchresultswide.aspx?link=2&filingid=8590980
http://www.caledoniamining.com/
God Bless
Jim Rogers: Buy Gold, Silver Before ‘More Turmoil’ Jolts the Globe
Friday, 18 May 2012 09:02 AM
By Forrest Jones
http://www.moneynews.com/StreetTalk/Rogers-Gold-Silver-Turmoil/2012/05/18/id/439515?s=al&promo_code=EF13-1
Roiling capital markets aren't going to calm any time soon so investors would be better off putting their money in hard assets like gold, silver and agricultural commodities, says international investor Jim Rogers.
Greece is teetering on the brink of default, while the debt crisis appears to be spreading to Spain, as evidenced by a Moody's decision to cut ratings on 16 banks there.
"The world's got serious problems facing it, I don't particularly like saying it, but it's true," Rogers tells CNBC.com.
"Unfortunately there will be more debt and currency turmoil to come."
Greece goes to the polls on June 17 to elect a new parliament, and many worry voters will elect enough leftist and other fringe politicians who favor ditching austerity measures in exchange for bailout money, which could precipitate the country's exit from the eurozone.
The euro has taken a pounding on European uncertainty lately and will continue to do so.
"I hope the euro survives, I think it will survive in some shape and form," Rogers says, adding he's avoiding equities right now.
"I own real assets because if the world economy gets better I'll make money because of shortages and if things get worse they'll print more money," Rogers says, referring to loose monetary policies designed to spur growth amid downturns, which push up commodities prices as a side effect.
Greeks pulled the euro equivalent of close to $1 billion out of the country's banks on one day alone recently, as worried depositors stock up on euros fearing the country will ditch the currency and revert to the drachma, which would be much weaker.
Continued withdrawals will bruise an already beleaguered financial system, experts say.
"If you have significant deposit withdrawals, that's difficult for any institution to overcome no matter the macroeconomic factors. Of course that's not even taking into account everything going on in Greece," says Kris Niswander, associate director of European financial institutions for SNL Financial, according to CNNMoney.
Charts... P.M. Kitco Metals Roundup: Comex Gold Ends at Bullish Weekly High Close Friday, to Begin to Suggest Market Bottom in Place
Friday May 18, 2012 2:33 AM
http://www.kitco.com/reports/KitcoNews20120518JW_pm.html
Comex gold futures prices surged late this week on short covering and bargain hunting, but more importantly on fresh safe-haven investment demand, following recent selling pressure that drove gold prices to a 10-month low of $1,526.70 on Wednesday. Gold produced a bullish weekly high close on Friday, which is an early technical clue that a near-term market bottom is in place for the yellow metal. June gold last traded up $14.90 at $1,589.80 an ounce. Spot gold was last quoted up $15.70 an ounce at $1,590.50. July Comex silver last traded up $0.61 at $28.63 an ounce.
The world market place was impacted late in the week by a weaker-than-expected U.S. business activity report from the Philadelphia Federal Reserve on Thursday morning. That economic data came on the heels of Wednesday’s FOMC minutes that hinted further quantitative easing of U.S. monetary policy is possible if the economy were to continue its lethargic ways. The U.S. and Asian stock markets sputtered in the wake of the Philly Fed report, while European stock markets tried to stabilize following recent selling pressure related to the EU debt crisis in their own back yard.
There is now fresh talk of further quantitative easing of U.S. monetary policy (QE3). Such would arguably be commodity-market bullish and possibly stock market bullish, despite the specter of reduced demand prospects due to the sluggish economy.
There is still high anxiety in the market place, as the EU debt crisis saga rolls on. On Friday, 16 Spanish banks credit ratings were downgraded by Moody’s. There was also talk in the market place that U.S. banking heavyweight JP Morgan may have $100 billion in risky bonds in its risk-management portfolio. Remember what happened to MF Global and its risky bets on European debt.
Importantly, the fact gold started to rally strongly from its recent selling pressure suggests the rally is more than just short covering. Gold saw decent safe-haven investment demand late in the week, heading into a weekend of trader/investor jitters. The fact that gold rallied strongly late this week also hints the market place is feeling even higher anxiety. It could be a very active trading day on Monday. Gold bulls are presently feeling much better than they have the past couple weeks.
The European Union debt and financial crisis is still on the front burner of the market place. After the early-week failed efforts by Greek politicians to form a coalition government, fresh Greek elections are now scheduled for mid-June. Concerns regarding Greece leaving the Euro zone are high, as the Greeks’ commitment to financial austerity is highly questionable. There were reports Friday that EU officials are preparing a plan in case they are forced to kick Greece out of the EU. Spanish and Italian bond yields were above 6% most of the week, which is also stressing the EU financial system.
The U.S. dollar index is traded near steady Friday and hit another fresh four-month high. The greenback has benefited recently on fresh safe-haven demand mainly due to the EU situation. During times of keen investor uncertainty, history has shown that gold and the U.S. dollar can both appreciate at the same time. The dollar index bulls still have good upside near-term technical momentum. Meantime, crude oil futures prices were lower Friday and hit a fresh 6.5-month low of $91.40 a barrel. Crude oil remains in a bearish fundamental and technical posture.
The London P.M. gold fixing was $1,589.50 versus the previous London P.M. fixing of $1,554.00.
Technically, June gold futures prices closed at a bullish weekly high close on Friday and that begins to suggest a near-term market bottom is in place. However, gold bears still have the overall near-term technical advantage at present. A 2.5-month-old downtrend is still in place on the daily bar chart. The gold bulls’ next upside price breakout objective is to produce a close above psychological resistance at $1,600.00. Bears' next near-term downside price objective is closing prices below solid technical support at this week’s low of $1,526.70. First resistance is seen at Friday’s high of $1,597.50 and then at $1,600.00. First support is seen at $1,580.00 and then at Friday’s low of $1,567.80. Wyckoff’s Market Rating: 3.5.
(Note: For a complete explanation of my exclusive “Wyckoff’s Market Rating,” just send me an email at jwyckoff@kitco.com and I’ll email it back to you.—Jim)
July silver futures prices also saw a bullish weekly high close on Friday, but bulls have more work to do to begin to suggest a market low is in place. The market saw short covering and bargain hunting after prices Wednesday hit a 4.5-month low. Silver prices are still in a 2.5-month-old downtrend on the daily bar chart. The silver bears still have the overall near-term technical advantage. Bulls’ next upside price breakout objective is closing prices above solid technical resistance at this week’s high of $29.00 an ounce. The next downside price breakout objective for the bears is closing prices below solid technical support at the December low of $26.50. First resistance is seen at Friday’s high of $28.895 and then at $29.00. Next support is seen $28.00 and then at Friday’s low of $27.78. Wyckoff’s Market Rating: 3.0.
......
......
Indian central bank challenged in court to Repatriate Country's Gold -
RBI Gets High Court Notice to Explain Gold Deposits with Bank of England = AdolfRothschildHitler =
http://doreenellenbelldotan.info/AdolfRothschildHitler.htm
By Dinesh Thite
Pune Mirror, Pune, India
Friday, May 4, 2012
http://www.punemirror.in/article/62/2012050420120504025313609120ae2ba/RBI-gets-HC-notice-to-explain-gold-deposits-with-Bank-of-England.html
http://investorshub.advfn.com/boards/read_msg.aspx?message_id=75430215
God Bless
Ps. fyi...
Adolf666RothschildHitler red pawn -
http://investorshub.advfn.com/boards/read_msg.aspx?message_id=75419945
http://www.dontvoteobama.net/
Oh no... The Inflation Trade is On: Bernanke Has Broken the Dollar Rally
Friday May 04, 2012 10:19
http://www.kitco.com/ind/Conner/20120504.html
It may not seem like much happened yesterday, but a very important event occurred. Yesterday the dollar index breached 78.65. The reason that is significant is because 78.65 marked the intraday low of the prior daily cycle. A penetration of that level indicates that the current daily cycle has now topped in a left translated manner and a new pattern of lower lows and lower highs has begun. Any time a daily cycle tops in a left translated manner it almost always indicates that the intermediate cycle has also topped.
In this case it would indicate that the intermediate dollar cycle topped on week two and should now move generally lower for the next 10-12 weeks, bottoming sometime in late June or early July, about the time Operation Twist ends.

Now that we have confirmation that Bernanke has broken the dollar rally I'm confident in calling April 4th an intermediate bottom (B-Wave bottom) in the gold market. Gold should now be entering the consolidation phase of the next C-wave. I expect a test of the all-time highs sometime this summer as the dollar moves down into its intermediate cycle bottom.

That being said I have no interest in a 15% rally in gold. The real money will be made as the mining stocks exit their bear market, re-enter the consolidation zone between 500 and 600, and move up to retest the old highs. It's not inconceivable that we could see a 30-45% gain in mining stocks over the next 2 1/2 months.
Sentiment in the mining index has reached the same levels of bearishness that were seen in the fall of 2008. That black pessimism drove a 300+ percent rally over the next two years. I have little doubt this time will be any different.
Now what we need to see is a change in character. We need the mining stocks to stop generating these sharp bear market rallies and transition into the wall of worry type rally that characterizes a bull market. So far that is exactly what is happening. The miners are rallying very hesitantly, and as long as this continues it will camouflage the move and keep sentiment depressed. That's exactly what we need to happen to drive a long sustained rally back up to the old highs.
The problem with the rocket launch type rallies we've seen over the last year and a half is that they swing sentiment very quickly to the bullish side and we run out of buyers.
As long as the bottoming process proceeds gradually I think there's a very good chance the HUI could break back above the 200 day moving average, and possibly test the 600 level by mid-July.

So far all of the pieces are starting to fall in place to initiate the very early stages of what I think will eventually become another huge momentum move similar to what happened in silver and gold last year. This scenario may well culminate in a parabolic blow-off top sometime in late 2014 as the dollar moves down into its next three year cycle low.

Now is the time to invest in this sector as it struggles to transition from a bear market back to the secular bull trend. The time to enter is at the very beginning when no one believes. This is when the really big money is made. If you wait till your emotions give you the all clear, half the move will be over.
Most traders are going to jump back into the general stock market or tech stocks. You have to be smarter than that. The stock market, including tech, have already generated a massive move out of the October bottom. That kind of move usually leads to a multi-week, or month, consolidation. The odds of another 20 to 30% rally in the stock market are very slim.
The odds of a 20 to 30% rally as the mining stocks resume the secular bull trend are extremely high.
The combination of extreme downside momentum and irrational human nature has created the kind of oversold conditions and extreme undervaluation that generates an opportunity that only comes around once or twice a decade.
By Toby Connor
GoldScents
http://www.goldscents.blogspot.com
Throwing aside the P&F chart, which says the bearish price objective is 1550, and looking at recent action and MA's, I think the price of $GOLD is headed higher... as well, there are analysts that are buying equities now as they are badly beaten down... Mike Swanson is one of them.
Last week's daily action had 2 bullish candles and a strong uptrend looks to be in order. The weekly chart shows the price is supported by the weekly MA60 but below the benchmark MA40... why would one want to buy puts when the price is already below the benchmark weekly MA40 and the benchmark daily MA200?
Be very careful out there... Gold/Silver are in a super bull cycle and have been for about 10 years... don't buck the major trend!!!
Only the highest and best!!!
Pro-Life, I'm thinking about picking up some GLD puts. What are your thoughts on where the price action of gold is heading?
Failed Bottom in Gold Stocks Initiates Start of Capitulation
Monday April 09, 2012 12:45
http://www.kitco.com/ind/Trendsman/20120409.html
It was only a week ago we felt the gold stocks had a great chance of putting in a bottom. Monday supported our thesis but after Tuesday’s action and Bernanke’s jawboning it was apparent that the gold shares were in for a very difficult period. We immediately went long DUST to hedge long positions and trimmed some of our most vulnerable positions. We aren’t day traders personally or professionally (in our service) but sometimes you have to be considering the day to day volatility in this sector. Having accounted for the short-term, the next move is to gameplan for a potential major bottom in the sector.
Below we show the HUI Gold Bugs Index, which declined by 7% last week and closed at the lows of the week at 441. When a market is breaking down or plunging, it is our job to identify areas of strong support which could temporarily reverse the trend and potentially establish a bottom. The 50% retracement from the 2008 low comes in at 395 and 375 marks mid 2009 resistance and early 2010 support.

It is not groundbreaking news that sentiment in this sector is terrible. It is nearing 2008 levels. Yet, is the extreme bearish sentiment justified? We posit this because the HUI is currently 31% off its highs. Including 2008, this is the 6th correction of at least 30% or more. The HUI could fall another 13% to 385 and this decline would remain similar to declines in previous years. Sure, there is reason to be negative. This sector couldn’t perform with Gold, couldn’t mount any rebound from an oversold condition and now it is breaking down. However, the decline is likely to remain in line with past declines and the bull market is far from over.

Over the past few weeks we were not sure if the gold stocks would form a stealth bottom or if we would get a panic selloff that would develop into a V bottom. As time passed we thought a stealth bottom could be forming. Now it is more than obvious that the market is likely to make a V bottom. The bad news is the V has barely begun. More pain is ahead. The good news is the market likely will be substantially higher six months and one year after the low.
This sector produced significant gains following the major bottoms from 2005 and 2008. Sentiment argues that his time will not be any different. First things first. Investors must identify strong support that could produce a V bottom or reversal. Second, investors should have a shopping list ready. This should include premier companies with strong fundamentals that can be bought at a discount as well as speculative ideas and instruments with extremely favorable risk reward scenarios. If you’d like professional guidance in this endeavour then we invite you to learn more about our premium service.
Good Luck!
Jordan Roy-Byrne, CMT
Jordan@TheDailyGold.com
TheDailyGold
Now Is Not The Time To Be Scared Of Gold
Wednesday April 04, 2012 09:27
http://www.kitco.com/ind/swanson/20120404.html
I titled last month’s issue of this newsletter “Mining Stocks May Become the Big Play for the Second Half of 2012.” I wasn’t saying that it was time to buy them, but that I thought that when the correction they are in, which has been going on now since way back in September, came to an end they would likely put on a big performance through the rest of this year.
Now the correction hasn’t ended yet and they have fallen a bit more this past month. That fact has caused many people to throw in the towel on them and I’ve even seen articles and blog posts on the Internet declaring that gold is now in a bear market. For instance just a few weeks ago frequent CNBC talking head Dennis Gartman announced that he was out of gold after pounding the table on it in January.

Right now most people are captivated by Apple stock since it has been going straight up so far this year. Very few investors are thinking about gold or silver anymore. But I don’t want you to forget about them, because when mining stocks go up they can go up like Internet stocks did back in the late 1990’s. In 2011 the price of silver practically doubled in the space of three months. Gold and silver have been in secular bull markets now for over ten years and during that time I have played several big runs in the stocks and I think we’re going to see another one start in the future and we have to be prepared and ready for it. We have to recognize it when it starts. And we can’t be too fearful because of what gold and silver have done so far this year. I’m also worth listening to on them, because I’ve had experience in trading them and I have been negative on them since they peaked out last August. I’m not some Kitco gold bug that has been telling you to buy them as they have kept dropping.
Now a lot of people are ringing their hands trying to figure out what exactly is behind the weakness in gold and silver. Everyone knows there is inflation now, because oil prices are rising and so is the price you are paying for gas at the pump and just about everything else. Everyone knows the Fed is printing money like mad. And everyone thinks gold should be going up, because of all of this. But it hasn’t been.
You are probably wondering why. The reasons are pretty simple. It’s how financial markets work. To understand what I’m talking about let’s look at the rest of the stock market first. I want to show you a simple concept and then we can apply it to what is happening in gold and silver.

In big bull markets you get pullbacks and consolidation periods that last a year or even longer. For example in the last bull market from 2003 till 2007 there were two periods of consolidation for the S&P 500 that lasted almost an entire year and several times that the broad market experienced very sharp pullbacks.

And of course in this current cyclical bull market we saw a big pullback last fall and consolidation period in the summer of 2010. In the broad market these pullbacks and consolidation periods tend to happen after the market has experienced a big run and investor sentiment gets wildly bullish. They happen after a big top in which just about everyone out there that can buys into it and everyone is bullish. At that point there are few people left to buy stocks so a corrective phase begins. And the thing is the bigger the run that happens before that pullback the more likely a long consolidation phase occurs.
Right now there is no sign that a top is in for this market rally, but it does appear to be heading to the type of top that comes right before a big correction or long consolidation phase. According to last week’s Investors Intelligence survey 22% of the those polled are bearish on the stock market while 50.5% are bullish. This is the lowest number of bears since July of last year. Most of the time though the big tops come in when the bulls are over 55%. The survey isn’t there yet, but could possibly get there over the next few weeks or months. It’s something we’ll keep an eye on together.
But if a big top does come, it probably wouldn’t mean a new big bear market, but simply a pullback or consolidation phase like the last two we’ve seen. The reason why is because we haven’t seen the type technical divergences which tend to lead up to new bear markets, such as a declining advance/decline line as the averages go up.
Also historically most bear markets start AFTER the Federal Reserve has raised interest rates several times and the Fed has pledged not to do that for at least another year and a half. In the last bull market the Fed raised interest rates 17 times from 2004 to 2006 before the market finally topped in 2007. During this time rates went from a low of 1% to 5.25%.
What is more over the past twenty-years the Fed has tended to keep interest rates top low for too long and thereby created bubbles that once popped damaged the entire economy. It was the Fed that helped to create the Internet and technology stock bubble of 1999 and the real estate bubble that led to the country’s banking crisis and current malaise.
If history repeats again and there is no sign at all of a change in Fed philosophy then the Fed will create another bubble during this cyclical bull market too. Some are saying bonds are the bubble. But whether or not that is the case bubbles are likely to form in commodities and inflation alike in the 1970’s and in the end that means higher gold and silver prices will come. It’s Dave Skarica’s “Great Supercycle.”
Putting some perspective on things it doesn’t seem likely that the Fed is going to pop the current cyclical bull market with higher rates now for another 2-5 years. They’ll keep rates too low again for too long. In fact they probably already are when it comes to the economy.
Think about real estate. If you are thinking of buying or building a new home you really have no reason to go out and do it now, because the real estate market is weak and the Fed says it won’t raise rates for at least another year and a half. So why go hurry and do anything in real estate? However, if you knew that the Fed was going to start raising rates and that mortgage rates would start to rise in a few months then you probably would go out and build or buy a home if you are thinking about it.
So the Fed’s policy of keeping rates at zero at this point is actually probably doing more harm than good for the economy. You’ll see in two years or so once rates start to go up I bet we’ll actually see a nice pickup in the economy occur. And the other thing is that I bet you that once we get in the last few years of this cyclical bull market we’ll see a big pickup in inflation and commodity prices just like what happened in the 1970’s at the end of that secular bear market, because this cyclical bull market will probably be the final cyclical bull market of this 10+ year secular cycle just like you saw at the end of the 1970’s, and both periods can be characterized by completely reckless monetary policy and weak political leadership in the United States.

As far as gold stocks go they aren’t in some giant bear market, but have merely been in a correction for the past six months. And it shouldn’t be a giant shocker to you, because these type of corrections happen after big runs. Gold and silver stocks went up 400% from their low of 2008 to high of last year. That’s a GIANT move.
After such big moves a year or even two years of consolidation is normal and that appears to me to be exactly what is happening with mining stocks. We’ve seen them do this many times before over the past ten years throughout this secular bull market for gold.

Gold has been in a secular bull market since 2002 and during this time has gone through long one year plus consolidation phases several times. These consolidation phases have come to end when its 200-day Bollinger Bands have come together - this is something that should happen at the end of this year or first half of next year, after which gold should begin another big leg up for its secular bull market in which the price of gold could easily double. And silver prices. I’d expect them to simply explode.
So right now this means gold and silver stocks are in a big long drawn out sideways phase and are moving towards the bottom of this sideways channel. They may have reached a bottom now or they may do it later this spring or summer on a broad market pullback. My bet is on the latter, but probably not from prices too much lower than here.
Whatever the case though once this pullback is over I plan on building a nice position in mining stocks myself. My goal is to build a position in them over the course of this year with the aim of participating in the next big bull move up that I think will likely start next year and lead to mining stock prices double or triple what they are now.
One thing about them is that mining stocks are now priced so cheap on a fundamental valuation basis that the upside potential for them once they start a new bull trend is enormous. Take a look at mining giant Newmont mining for example. It currently is paying a dividend yield of 2.7%, has a forward P/E of 9, and a PEG ratio of 0.23. It’s not the only mining company this cheap. Barrick has a forward P/E of 7.21 and PEG 0.28 while Anglogold has a forward P/E of 7.20 and PEG of 0.14. These are the big cap mining stocks that mutual funds and hedge funds buy when they pile into gold stocks.
And some of the big cap silver stocks also have low valuations like this too. Silver standard for example has a forward P/E of 8.40 and PEG of 0.04! These are crazy cheap valuations. If gold and silver and the mining stocks turn around like a I think then these low valuations now will lead to giant gains later. This is the power of gold.
Of course no one will pay attention until they start to go up. CNBC isn’t talking about mining stocks. Everyone is glued and obsessed with the movements in Apple right now. But we have to be forward thinking to what the next big trend may be and not just what is happening right at this moment to make money. That’s why I’m watching what is happening very closely to gold and silver prices and why I don’t want you to forget about them either.
By Michael Swanson
http://www.wallstreetwindow.com
Very nice day! Held 8 contracts over from friday. Just exited the position and waiting for a pullback on the 60 minute chart. It was getting a little over extended
Risk vs. Reward (Au Style)
Friday March 23, 2012 13:56
http://www.kitco.com/ind/Tanashian/20120323.html
The broad market, supported by the glorified boiler rooms on Wall Street, the glorified infomercials in the mainstream financial media and the glorified monetary clerks at the Fed, operates to its own set of rules and cycles. For instance, now we have conventional investors who used make cracks about their 401k's becoming 201k's actually becoming hopeful that they will regain all of their lost value. The wonders of inflationary monetary policy has brought this prospect tantalizingly close to becoming reality. Close, but...
Over in the gold sector however, where investment is actually a form of revolution (against inflationary fiat monetary systems), it is not so easy. Investors simply must be mindful of the risk vs. reward setups at all times because the same forces arrayed in support of the stock market are lined up against the barbarous relic. I am not saying this is a conspiratorial cabal, but I am saying that macro manipulation (like the recent 'reworking' of US Treasury yield curves) is just the way it is, whether it is planned out in the shadows to the most minute details, or just the result of embedded 'business as usual' academic myopia in a fiat system.
Take today for instance; it is a fine day for precious metals investors who are prepared for it. The caution signals were all there and it is now time to think like a capitalist... like a predator... like a revolutionary... like someone who avoided the worst of what the manipulative entities had to dish out and is now in evaluation mode as to how to proceed. You are a precious metals player? You are at war. Win the friggin' thing.
With that, we take a quick reading of two indicators NFTRH and its subscribers have been watching.

Bullish Percent Index on the GDM gold miner index can continue to decline to target. Will this come with a final regurgitation and capitulation? I don't know, so that is why I am slowly picking off individual items as they come on sale. We began watching this one when HUI/GDM failed to make a higher high at the equivalent of HUI 555 in February.

We have been watching for a projected double bottom in the leading HUI-Gold ratio for the better part of a year now, since it broke below an important moving average. This has allowed NFTRH analysis to temper its enthusiasm despite wildly bullish bigger picture projections. We are almost there folks, and I suspect a large portion of the gold 'community' wishes it had more cash reserves in the event this signal registers.
When you are at war, you do not personalize the enemy. You plot, you analyze, you gain intelligence and you survive long enough to employ tactical countermeasures.
Given the sentiment backdrop, which we have also been keeping a close eye on, one wonders if the massive topping pattern on the weekly HUI (yes, we are factoring that as well) is little more than fodder for trend followers and gold perma bears to scare gold bugs with.
What the heck, let's throw up (apt wording, isn't it?) one more graph. Sentimentrader.com's Public Opinion data out just two days ago has finally taken a hard lurch down to where a precious metals bull with cash on hand would want to see it. Unless the rules have changed, you never but never feel actionably bullish when the public is red lining bullish optimism and you never but never get bearish - as long as the secular bull remains intact - when it is green lined.

The working price target for Au is lower, but we are getting there and I am getting more bullish by the week because data points are starting to converge all over the place. There is a level of concern about the technical pattern on HUI, GDM, etc., but in the precious metals, sentiment usually wins and it surely has the power to invalidate a chart pattern; neuter it if you will. We shall certainly see soon enough.
You have got to love the markets. You really have got to.
By Gary Tanashian
http://www.biiwii.com
Welcome!!! A big day today... +$22
Been on ihub for a little while. Didnt know they had a gold futures board. Seems there are not to many futures traders on here. I trade futures for a living. Nice to finally find a home on ihub
Finally! I found a board on ihub where im at home. I trade futures for a living. Didnt know they had a futures board on ihub. We are going to see a nice rise in gold in the week and into the next week. Here is the daily chart. We have an inverted head & shoulders pattern inside a nice pennant pattern. Ive been holding this position since friday.

PDAC2012: Murenbeeld: Bullish Reasons Outweigh Bearish Reasons For Gold's Outlook
04 March 2012, 6:29 p.m.
By Debbie Carlson,
Global news editor, Kitco News
http://www.kitco.com/
http://www.kitco.com/reports/Kitco_News_Extensive_Coverage_DeC_Murenbeeld.html
Toronto-(Kitco News)--Gold prices still have further room to rise as more bullish reasons than bearish reasons give the yellow metal support, said a leading Canadian economist on Sunday.
Martin Murenbeeld, chief economist for DundeeWealth, said his forecast for the average price for gold in 2012 is $1,825 an ounce, and he sees gold trading at $1,942 by the end of the year. His 2013 average price forecast is $2,145. He said, however, that price outlook makes "no allowance for geopolitics."
He spoke at the PDAC2012, the Prospectors & Developers Association of Canada's annual convention, which occurs from Sunday to Wednesday in Toronto.
There are 10 bullish reasons why gold should go up and eight bearish reasons why gold should go down, Murenbeeld said, which makes him favorable toward the yellow metal.
On the bullish side, gold is supported by the following reasons, Murenbeeld said:
- Monetary reflation as the U.S. Federal Reserve and European Central Bank print money
- a fundamentally weak dollar
- countries seeking to diversify their currency reserves
- central bank buying
- only a slight increase in mine supply
- investment demand
- the commodity price cycle remains bullish
- gold is not in a bubble and has room to rise
- inflation in the emerging markets
- and potential geopolitical conflicts send people back to gold as a safe haven.
Of all of those reasons, monetary reflation is the most important, Mureenbeeld said. It's the liquidity that is in the market from ultra-low interest rates from central banks around the world, and the stimulus programs to encourage demand that is giving support to gold and other markets. Since 2001 when the current long-term bull market started in gold, there have been seven corrections in price that were more than 10%, including when the global recession hit in 2008-09 and last year during the European worries, he said. Yet since the lows reached during the 2008-09 recession, when prices fell to the low $700 an ounce area, gold prices have rallied to more than double that level.
He also doesn't think that gold's rally is over. Since 1800, gold's shortest rally was 10 years. The current gold bull market is just 10 years old. Given the influence of the "BRIC" countries – Brazil, Russia, India and China and the debt problems of western nations, he doesn't see gold's rally ending soon.
Murenbeeld cautioned that gold has some potential drawbacks to its outlook that those who wish to buy the metal should consider. He listed eight reasons that might weigh down gold:
-The EU recession could lead to fiscal retrenchment and deflation
-China falls into a recession and commodity demand plunges
-physical demand weakens because of high prices and weak economic growth
-the U.S. dollar strengthens
-gold becomes the liquidity of the last resort for cash-strapped countries and investors
-equity markets improve
-miners stop dehedging and begin hedging again
-and monetary policy changes and real interest rates rise again.
Recessions are price-negative for gold and commodities in general. When he mentioned the chance of China falling into a recession, he said that means China having growth under 6%.
Also, he said there is talk about governments selling gold to pay down their debts, including the U.S. selling its gold reserves to do deal with their debts. "That would be the most stupid thing to do. You never sell your gold when you can print money," he said about the U.S.
"When you need to sell your gold is when no one wants whatever else you can give them," he added.
After his session, Murenbeeld was asked what might happen to gold if Israel attacked Iran. He said gold would rally, much as it did during other politically tense situations. He said there were some media reports that if Israel struck Iran and Iran closed the Strait Hormuz, that oil prices might spike to $400 a barrel. If oil prices rose to that level, then gold prices would easily go over $2,000 an ounce quickly. That's just a guess, he said. But while it sounds like a sharp gold price jump, he points out that while a $500 move for gold, from about $1,700 to about $2,200 sounds like a lot, as a percentage it is not as big as oil going to $400 from the current $110 a barrel it is currently trading at.
Charting Gold
By Scott Silva
Feb 22 2012 3:26PM
http://www.thegoldspeculatorllc.com
http://www.kitco.com/ind/Silva/feb222012A.html
The charts are displaying new strength in gold and silver. We will see new highs in gold and silver this year. It’s not too late to buy the precious metals at bargain prices.
Technical analysis is a powerful tool for understanding the market for a traded good. Technical analysis employs time-tested techniques for predicting future price levels. The successful technical trader uses a combination of indicators to support the decision to take a long or short position in a given commodity. The planets are lining up in favor of another leg up in gold and silver. Let’s examine what the charts are telling us about gold today.
First, gold has broken out of a bullish falling wedge chart pattern dating back to September 2011.
The falling wedge pattern can be a continuation or a reversal pattern. It this case, it is a reversal pattern, signaling a reversal of an intermediate bearish trend. The falling wedge is a bullish pattern that begins wide at the top and narrows as prices gradually move lower. This price action forms an extended cone shape that slopes down as the reaction highs and reaction lows converge. The pattern is defined by the down-sloping upper resistance line and the lower, converging base support line. The bullish breakout occurs when price action closes above the resistance line (upper descending tend line) with confirming volume. The point count for the pattern is calculated by adding the magnitude at the widest span to the price at breakout.

We can see the falling wedge reversal pattern in the daily basis chart for April COMEX gold above. The intermediate bearish trend began in early September 2011. The price at the break above the resistance line was 1674.40. The point count is 321 which sets the price target at $1995/oz. The breakout is confirmed by significant volume at the breakout day, January 25th.
We can see the same breakout in gold using Ichimoku Kinko Hyo indicators.

Here we see spot gold on a daily basis with Ichimoku indicators. The January 25 breakout above resistance on higher volume is highlighted in the oval. Today’s chart shows all Ichimoku indicators are bullish for gold. Price action is above the cloud, which is bullish. The Tenkan Sen made a bullish cross (from below) the Kijun Sen back on January 17th. The projected cloud is bullish (shaded green). And the Chikou Span is well above price action and above the cloud, which is a strong bullish signal.
Silver is displaying similar bullish patterns and indicators. So are selected gold and silver stocks.
Now is the time to own gold and silver.
Investors from around the world benefit from timely market analysis on gold and silver and portfolio recommendations contained in The Gold Speculator investment newsletter, which is based on the principles of free markets, private property, sound money and Austrian School economics.
By Scott Silva
Editor, The Gold Speculator
2-22-12
Jim Willie: The High Cost of 0% Rate
By Jim Willie CB
Feb 9 2012 10:26AM
http://www.GoldenJackass.com
http://www.kitco.com/ind/willie/feb092012.html
The interminable extension by the US Federal Reserve on the 0% rate into 2014 represents history in the making, making pure heresy in monetary policy. Worse, it forces foreign central banks to adopt the same destructive policy in the Competing Currency War. Accommodation on interest rates must be temporary, but is made a fixture. The financial system is irreparably broken, the symptom being endless financial crisis. The risk trade is coming back, whose corollary message is to back up the truck to buy GOLD. Many are the messages behind the 0%. Other nations like Japan have been criticized for its adoption. But when the United States is the adoptive parent custodian, it is supposedly all good. Stimulus is a ruse, as destruction of working capital is the constant refrain in a tragic opera. The unintended consequences abound, but mostly not perceived or comprehended well. Few even in the financial community are aware of the powerful leverage mechanisms that enforce the artificially low interest rate. Introduce the Interest Rate Swap contract, upon which heavy reliance is the norm. While Europe is embroiled in austerity, the United States is besieged by central bank apologies for failure disguised less and less with each passing month and each dismissed speech.
The solution is Gold & Silver investments, as all things paper will lose value either from erosion or theft in fraud. The MFGlobal case is far from finished. We have seen this Madoff movie before, but few recognize its sequel starring Jon Corzine and similar supporting cast. The protection is with Gold & Silver, in physical form. The next wave will feature the Gold investors painted as financial terrorists. Refer to the New York Times article with FBI contributors. This is highly disturbing to anyone who holds the Constitution as sacred.
HIDDEN MESSAGE OF PERENNIAL 0% RATE
The 0% official Fed Funds rate has been almost three full years in entrenched policy, when originally promised as temporary. No exit strategy here. Greenspan once stated that it should never be held fixed so low for more than six to nine months. He implied the system would be broken otherwise, subjected to pressures that would distort the valuation mechanisms beyond repair. My view is that extending 0% as monetary policy into year 2014, five years of accommodation, is a gross admission of failure. Bernanke constantly apologizes for stimulus having failed, for an economy unable to recover. The main effect of 0% policy is sustenance of the surprising weakness, draining capital from the system, and improperly pricing the debt which is at high risk. The reality is that the USEconomy is stuck in harsh deep recession of minus 3% to minus 5% GDP. The reality is that the USGovt debt burden is stuck in fast escalation at well over $1 trillion annually, while demand for the debt securities is vanishing. The heavy hidden reliance upon monetary inflation devices for USTBond demand has become a fixture in the financial landscape. Its marquee banner reads failure.
SYSTEMATIC DESTRUCTION OF CAPITAL
The fixture of 0% as monetary policy carries with it an admission that money is worthless. No directive by the flailing discredited US central bank could say it better. Money has no cost because it is not worth anything, being paper in basis and backed by no collateral. The latest travesty is the upcoming dissolution of Fannie Mae itself. What miracle they might conjure up to make its rotten ramparts and acidic paper and corrupt core go away. Fannie will be buried at sea (of liquidity). The cast of economists cannot comprehend the heavy cost of 0% in the widespread systematic destruction of capital. Marginal business units shut down, turn off the equipment, lay off the workers. The costs rise from the rising price of commodities. The material costs rise from basic hyper monetary inflation, due to the unilateral USFed paper factory output. The essence of retired capital and its broad capital destruction is a foreign concept to economists. They still believe the USEconomy will enjoy the benefits of continued 0% stimulus. How wrong, how backwards, how tragic!! The 0% policy destroys capital and furthers the deterioration process.
UNINTENDED CONSEQUENCES
A repeated message since so important. Focus on suppressed long-term interest rates and their damaging consequences. The US leaders boast of benefits from ultra-low interest rates. Suppressing the 10-year bond yield has dire consequences. Some but not all of them appear unintended. The power centers want unlimited easy money for sure. But in doing so, they permit some horrendous developments like feeding a cancer.
¦- Savers are given nothing in interest yield, slowing the economy with asset erosion
¦- Banks hold home inventory, making housing market clearance impossible
¦- Big banks continue their USTreasury Bond carry trade schemes instead of business capital formation
¦- Investment banks are encouraged to continue speculation, rather than to invest in business formation that create jobs
¦- The USFed further expansion of its balance sheet to buy toxic assets, as rot sets in
¦- The USGovt is not discouraged from deficit reduction, sure to lead to systemic failure
¦- The free money helps to conceal in vast turnover the toxic paper held under the USGovt roof, as in Fannie Mae, and other fraudulent mills such as MFGlobal lookalikes in the sovereign debt securities and their related derivatives.
ALTERNATE NEMESIS TO AUSTERITY
The Europeans are dealing with austerity measures in government budgets. The sovereign debt securities remain a constant problem, although in recent weeks the bond yields have come down to manageable levels, like below 6% in Italy and Spain. Few economists and bank analysts seems to realize that austerity plans put in place result in lower economic activity, more job cuts, fewer large scale projects, and thus higher deficits down the road. The austerity plans are Poison Pills, one and all, designed perhaps to enable installation of unelected Goldman Sachs technocrats in prime minister posts. The Greek situation is testimony, as budget cuts, asset sales, and massive amputations have resulted in worse fiscal deficits. So bring on more of the same!! The plague in the United States is of an opposite type. The budgets are unrestrained, notwithstanding the charades. The integrity is lost while foreign creditors have jumped ship. Instead, the urgent calls within the hollowed (not hallowed) Untied States are for continued 0% policy in order to make the mammoth gargantuan debts and fraudulent toxic paper coverup more cost-free. What incredible opposites exist in Europe and the North America!! The US controls the global reserve currency, having turned its printing press into a well-oiled national shrine. In no way does the USEconomy have the advantages that Japan boasts, like export trade surpluses, a diverse industrial base, and a nationalist fervor that abhors outsourcing. Japan forced JGBond investment by the unions, and the USGovt will do something similar with private pension funds.
ULTIMATE JET ASSIST FOR GOLD
Back in 2003, the gold community made it well-known that the negative real rate of interest was the underlying jet asset kick starter ignition system for the Gold bull market. Take the baseline interest rate, subtract the baseline price inflation rate, and arrive at the real rate of interest. At 2% or 3% for long-term interest rates, at 8% or 10% for accurate honestly measured price inflation, the real rate of interest is calculated in the minus 5% to minus 7% range. Investment in commodity resources, especially Gold & Silver, is the best protection and smartest reaction to the negative real cost of money. The USEconomy is mired in quicksand amidst vast capital destruction. The actual Gross Domestic Product is in a chronic recession of minus 3% to minus 5% for four years running. That explains the absent job growth. Take the payroll tax withholding series to see the steady decline in national income, not easily masked.
GOLD & SILVER READY TO SOAR
Check out the obvious reversal pattern on the Gold chart in full view. It has a 200-point potential rise, which would take the Gold price to 1950. All solutions discussed are bogus and founded in funny money output, new debt, toxic bond redemption, and cost-free recapitalization of banks. No more liberated gold bullion like from Libya via mercenary wars on the horizon. Its 144 metric gold tonnes proved useful to the London and Wall Street Boyz. Syria ain’t got no gold to release. When the 1750 defended flank is overrun, the rise in the Gold price will be rapid. It will capture global attention again. Gold is real money, easily noticed during a time when sovereign debt has turned toxic.

Check out the obvious reversal pattern on the Silver chart in full view. It has a 7-point potential rise, which would take the Silver price to 42 per ounce. The large gap between 32 and 40 has been filled halfway, the next half to be filled in the following several weeks, possibly very quickly. When the 35 defended flank is overrun, the rise in the Silver price will be rapid, more rapid than Gold since the gap will offer little resistance. The rise will capture global attention again. Silver is not just an industrial metal. It has outperformed Dr Copper easily.

THE HAT TRICK LETTER PROFITS IN THE CURRENT CRISIS
By Jim Willie CB
Editor of the "HAT TRICK LETTER"
Hat Trick Letter
February 08, 2012
In the Bullring With Gold By Frank Holmes
CEO and Chief Investment Officer
U.S. Global Investors
(Via e-mail alert February 03, 2012)

After prices fell 10 percent in December, many investors wondered if the bull market in gold was running out of steam. That was before Federal Reserve Chairman Ben Bernanke swooped in with a “red cape” and fired the bulls back up. Since the Fed reassured the world that interest rates will remain at “exceptionally low levels” for another two years, gold has jumped more than three percent.
UBS described the situation simply, “if investors needed a (further) reason why they should be long gold now, they got it yesterday … a more accommodative policy is a very good foundation for gold to build on the next move higher.”
To gold bugs, two more years of near-zero, short-term interest rates means negative real interest rates are here to stay, and this has historically been a strong driver for higher gold prices.
Bernanke and the Fed aren’t the only central bankers in the fiscal and monetary bullring. Brazil has cut its benchmark interest rate a few times and China lowered its reserve rate for banks in December. According to ISI Group, 78 “easing moves” have been announced around the world in just the past five months as countries look to stimulate economic activity.
One of the main weapons central bankers have employed is money supply, which has created a ton of liquidity in the global system. Global money supply rose 8 percent year-over-year in December, or about $4 trillion, according to ISI. I mentioned a few weeks ago how China experienced a record increase in the three-month change in M-2 money supply following China’s reserve rate cut.
Together, negative real interest rates and growing global money supply power the Fear Trade for gold. The pressure these two factors put on paper currencies motivates investors from Baby Boomers to central bankers to hold gold as an alternate currency.
Adrian Ash from Bullionvault says global central banks are on a buying spree and they have been since the Fed cut interest rates by 25 basis points in 2007. Central bankers’ shift to buying gold was a significant sea change for the yellow metal.
You can see from the chart below that official gold reserves have historically been much higher, averaging around 35,000 tons. In the 1990s, central banks began selling, with reserves hitting a 30-year low right around the time the Fed began cutting rates. Adrian says that gold holdings are now at a six-year high with the current amount of gold reserves just less than 31,000 tons.
These are countries large and small. In December, Russia, which has been routinely adding to the country’s gold reserves since 2005, purchased nearly 10 tons; Kazakhstan purchased 3.1 tons and Mongolia bought 1.2 tons. UBS says “although reported volumes are not very large, it is still an extension of the official sector accumulation trend.”
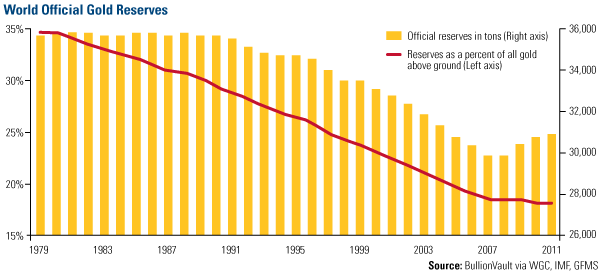
Not all central banks are recent buyers, though. The “debt-heavy West” has sold its gold holdings, while emerging markets increased their gold reserves 25 percent by weight since 2008, says Adrian.
Reserves as a percent of all the gold mined has also declined, with “a far greater tonnage of gold ... finding its way into private ownership,” says Adrian. Since 1979, you can see the percentage of reserves to total gold has declined at a much faster pace as individuals increasingly perceived gold as a financial asset.
Adrian points to China’s Gold Accumulation Plan as a recent example of this trend. A joint effort between the Industrial & Commercial Bank of China (ICBC) and the World Gold Council (WGC), the program allows Chinese citizens to buy gold in small increments as a way to build up their gold holdings over time. The WGC reported in September that the program had established 2 million accounts during its first few months in operation and the amount is growing by the day.
These programs open the door for gold as an investment to a whole new class of people in China but that’s only a fraction of the tremendous demand for gold that we are seeing from China. In addition to the Fear Trade, gold is driven by the Love Trade, which is the strong cultural affinity the East, namely China and India, has to the precious metal.
In 2010, the Indian Sub Continent and East Asia made up nearly 60 percent of the world’s gold demand and 66 percent of the world’s gold jewelry demand, according to the WGC.
Indian jewelry demand has historically increased during the Shradh period of the Hindu calendar, but last year, high prices and a volatile rupee kept many Indian buyers on the sideline.
If you thought $1,900 was too much to pay for an ounce of gold, imagine how Indians felt when the rupee fell against the U.S. dollar, causing a gold price spike in rupees. Gold in Indian rupee terms rose more than 35 percent from July to November, roughly three times the magnitude of gold priced in U.S. dollars, yuan or yen. This currency swing significantly impacted Indian gold imports, which dropped 56 percent in the fourth quarter, according to data from the Bombay Bullion Association.
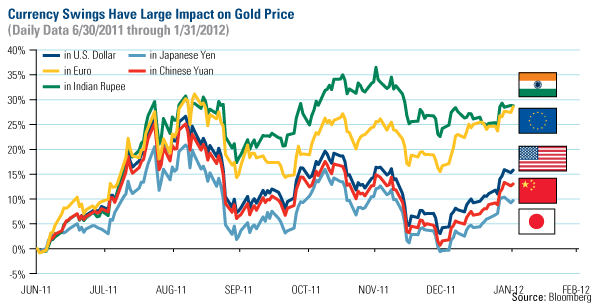
“Indian buyers will be back” after they adjust to the higher prices, says Fred Hickey. In one of his latest editions of “The High-Tech Strategist,” he cites late 2007 as a recent example when the Indian gold market experienced a similar rough patch. That year, gold demand in India fell off a cliff after prices spiked more than $1,000 an ounce in one quarter, tarnishing the country’s love affair with gold for a “brief period.” Fred says their cultural affinity for gold as an important store of wealth and protection against inflation will drive Indian buyers back into the market.
The trend was already changing in 2012, as UBS reported that the first day of trading saw physical sales to India were twice what they usually are, according to Fred. Although this is a very short time frame, I believe the buying trend will continue in this gold-loving country.
In China, “just as in India, gold is seen as a store of wealth and a hedge against inflation,” says Fred. Demand has been growing, especially in the third quarter, when China’s gold purchases outpaced India. “Physical demand for gold from the Chinese has been voracious all year,” says Fred. As of the third quarter, China had already obtained 612 tons, eclipsing its total 2010 demand, according to the WGC.
Across the Chinese retail sector, gold, silver and jewelry demand was the strongest performing segment in 2011, says J.P.Morgan in its “Hands-On China Report.” Growth in this segment far outpaced clothing and footwear, household electrical appliances, and even food, beverage, tobacco and liquor, all of which experienced more modest growth.
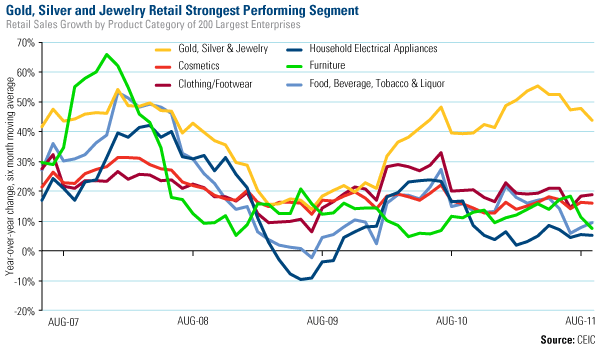
J.P.Morgan says the bulk of the increase came from lower-tier cities “where income levels are rising the fastest and improvements in retail infrastructure have allowed for rapid store expansion.”
Increasing incomes coupled with government policies that support growth have been the main drivers for rising gold prices. Take a look at the chart below, which shows the strong correlation between incomes in China and India and the gold price. As residents in these countries acquire higher incomes, they have historically purchased more gold, driving gold prices higher.
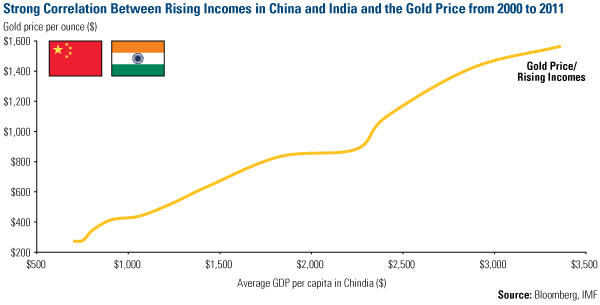
We anticipated that the Year of the Dragon would spur an increase in the buying of traditional gifts of gold dragon pendants and coins. Gold buying did hit new records, says Mineweb, with sales of precious metals jumping nearly 50 percent from the same time last year, according to the Beijing Municipal Commission of Commerce.
This should serve as a warning to all of gold’s naysayers. Gold bullfighters beware—you now have to fight the gold bull while fending off a golden Chinese dragon.
Comex Gold Ends Firmer, At Bullish Monthly High Close
1 February 2012, 2:11 p.m.
By Jim Wyckoff
Of Kitco News
http://www.kitco.com/
http://www.kitco.com/reports/KitcoNews20120201JW_pm.html
(Kitco News) - Comex April gold futures prices ended the U.S. day session modestly higher Wednesday, with prices hitting another fresh seven-week high early on. The bulls have near-term upside technical momentum as the market on Tuesday produced a technically bullish monthly high close on the last trading day of the month. April gold last traded up $5.40 at $1,745.80 an ounce. Spot gold was last quoted up $6.50 an ounce at $1,743.75. March Comex silver last traded up $0.478 at $33.74 an ounce.
The weaker U.S. dollar index Wednesday was a bullish “outside market” force supporting the precious metals markets. The dollar index bears have downside near-term technical momentum. Meantime, crude oil prices did back down from early-session highs, which did help to push gold down from its daily high. Crude oil bulls still have the overall near-term technical advantage, and that’s bullish for the precious metals. Crude oil and the U.S. dollar index will remain the two key “outside markets” that have a daily influence on gold and silver price moves.
There were a few fresh developments coming out of the European Union debt crisis Wednesday. German and Portuguese debt auctions were fairly well-subscribed, and some better-than-expected EU economic data was also released Wednesday. A debt- restructuring deal between the Greek government and the private sector has still not been reached, although there was talk again Wednesday that a deal is close. The EU debt crisis appears to have stabilized. However, if recent history plays out again the EU debt crisis will be back on the front burner of the market place. The EU debt crisis is still a major underlying bullish factor for the gold market, due to gold’s safe-haven asset status.
The London P.M. gold fixing was $1,740.00 versus the previous P.M. fixing of $1,744.00.
Technically, April gold futures prices closed near mid-range Wednesday and hit another fresh seven-week high. Prices Tuesday closed at a bullish monthly high close. Gold bulls have the solid overall near-term technical advantage and still have upside near-term technical momentum on their side. A steep four-week-old uptrend is in place on the daily bar chart. Bulls' next upside technical breakout objective is to produce a close above solid technical resistance at the December high of $1,769.70. Bears' next near-term downside price objective is closing prices below chart trend-line and psychological support at $1,700.00. First resistance is seen at Wednesday’s high of $1,754.00 and then at $1,760.00. First support is seen at Wednesday’s low of $1,735.40 and then at $1,727.00. Wyckoff's Market Rating: 7.5.
March silver futures prices closed nearer the session high Wednesday. Silver bulls have the overall near-term technical advantage. Prices Tuesday hit a 10-week high. A four-week-old uptrend is in place on the daily bar chart. Bulls’ next upside price breakout objective is closing prices above solid technical resistance at the October high of $35.68 an ounce. The next downside price breakout objective for the bears is closing prices below solid technical support at last week’s low of $31.525. First resistance is seen at this week’s high of $34.13 and then at $34.50. Next support is seen at $33.50 and then at Wednesday’s low of $33.07. Wyckoff's Market Rating: 6.5.
March N.Y. copper closed up 490 points 383.90 cents Wednesday. Prices closed nearer the session high. A weaker U.S. dollar index today boosted copper prices. Copper bulls have the near-term technical advantage. Prices are in a six-week-old uptrend on the daily bar chart. Copper bulls' next upside breakout objective is pushing and closing prices above major psychological resistance at 400.00 cents. The next downside price breakout objective for the bears is closing prices below solid technical support at 367.50 cents. First resistance is seen at Tuesday’s high of 387.60 cents and then at 390.00 cents. First support is seen at 380.00 cents and then at Wednesday’s low of 376.30 cents. Wyckoff's Market Rating: 6.5.
Follow me on Twitter! If you want daily, or nightly, up-to-the-second market analysis on gold and silver price action, then follow me on Twitter. It's free, too. My account is @jimwyckoff .
By Jim Wyckoff contributing to Kitco News; jim@jimwyckoff.com
Scoreboard for the week: +1.51%
Gold Trading below its 200 Day Moving Average has Historically Meant Good Things
By Peter Degraaf
Jan 9 2012 9:38AM
http://www.pdegraaf.com
http://www.kitco.com/ind/degraaf/jan092012.html
During the 12 year history of this bull market in gold, only about 5% of the time did we see gold trading below its 200DMA, and each time it turned out to be a prime buying opportunity.
Gold to be Bold in 2012 with its Own Contracting Fibonacci Spiral
By David Petch
Jan 3 2012 9:56AM
http://www.treasurechests.info
http://www.kitco.com/ind/petch/jan032012.html
On holidays this week has definitely been interesting. The new term for investing in today's market should be coined “Volatility Investing”. Since most trading is done by computers with complex algorithms that when their stops are hit, cause mass liquidation. For this reason, everyone should know that the expected move expected in 2012 is going to be finite in price and time, not “To Infinity and Beyond”. When I first made the observation that the markets were following a Contracting Fibonacci Spiral, my first thoughts were that something must be overlooked in my mind. Further thinking on this topic over the past six months just makes one realize the entire Universe runs on mathematical principles at many levels and under different conditions...the collective human psyche is just another example.
As analysis will show today, the US Dollar still has another 3-4 weeks of sideways to upward grinding upward price action. Sideways to slightly negative markets at the end of January will convince most that the year will end lower than this year and that deflation is going to kick in. Everything travels in waves and will continue to follow course until conditions have been satisfied for a reversal to occur.
There are a few interesting points to note:
1) At every time point on the Fibonacci spiral thus far, each subsequent point in time has reached a higher high and on the same note, each gain has been smaller and smaller on a percentage basis than the prior move (e.g. DOW at 40 in 1932 to 995 in 1966 versus any other time period examined...nearly 44 fold higher during the above time frame).
2) Each top has been followed by an excruciating decline of at least 40-50%...this cycle calls for tops, not bottoms.
3) Each point of the contacting Fib cycle is more condensed than the former, so ergo, volatility will increase as we continue to reach the point of singularity nearing 2020-2021.
4) The collective human psyche is driving this cycle...all events that occur on an individual basis be it personal success or failure, deaths, births, accidents wars etc. etc. are randomly occurring while the cycle tops are like towns on a road map with a train holding a constant speed between them...the destination will be reached at a particular point in time and what happens to people on the train during the trip does not affect the outcome of reaching the destination. Like anything, this cycle could be stopped by a nuclear war, asteroid hitting the earth or any event as large as those mentioned...cycles can be stopped, but recognition that we are in a large cycle nearing completion is worth taking note over.
Because the broad stock markets are trapped in a spiral does not mean that tops are limited to other sectors. Here is another revelation I just had as I finish my third cup of coffee...gold bottomed around 2000 and topped in 2008....that is approximately 8 years... September 10, 1999 was the low and May 1, 2008 was the high....this represented 3156 days, or 8 years, 7 months and 21 days (7.5% above the perfect value of 2922 days for an 8 year time frame). If we take 61.8% of this value, then the next top for gold is due on Monday September 2nd 2013...If we put +/- 5% onto this and assume that it will be earlier rather than later (due to the first part of the cycle), then the earliest expected top is February 25th, 2013. Since the first leg was longer than 8 years by 7.5%, it is more than likely the end of January 2013 is a target date...it could occur nearer to mid January 2013, but this is the time frame to expect action.
The above is an observation, but it is rather interesting that gold is operating on a smaller Contracting Fibonacci Spiral Cycle that is in synch with the larger Contracting Fibonacci Spiral the markets are in. Adding together the sum of parts, the price of gold will move up in price in 2013, 2016, 2018, 2019 and 2020, with each subsequent leg moving less in percentage terms than the prior move. Gold advanced 4 foldish from 1999 until 2008 ($252/ounce to $1046/ounce). This suggests that gold should top out below $4000/ounce over the course of the next year (Personally, the highest I think it can reach is $3074/ounce). The price of gold is likely to top out near $7-10,000/ounce by 2020, but each advance will be lower in percentage terms of the former leg.
I thought I would share this thought with everyone, because the cycles the markets are presently in will be difficult to navigate. So, as many over the next month come out with some new but rare fish head pattern or something like that, remember that all markets are interwoven and that the principles of Fibonacci are throughout nature. The cycle we have been in since 1932 has dates locked in, with all events randomly occurring. When late 2012/early 2013 arrives, remember to take money off the table. Everyone, including fish head guy will be screaming hyperinflation, when in fact the exact opposite (deflation) will be in place.
I have mentioned this enough over the past six months so any future articles will simply be index related. I wanted to post this gold info to illustrate that the principle behind the Contracting Fibonacci Spiral is not a one-off thing, but likely to be seen in many other examples in history, either as a pure number or some transformation based value.
Have a great day.
David Petch
January 2nd, 2012
(Jackal Commentary - I do not believe for one second that deflation will ever be a problem except with housing... the more money we have, the lower the value of the money as it exists without a basis for backing (eg silver/gold) as is the case with every currency around the globe... remember that gold/silver thrive in both inflationary and deflationary environments)
MKS Looks For Gold To Hit Record High In 2012; 'Marginally Bullish' On Silver
05 January 2012, 3:39 p.m.
By Kitco News
http://www.kitco.com/
http://www.kitco.com/reports/KitcoNews20120105AS_MKS.html
(Kitco News) - MKS Finance looks for gold to hit record highs in 2012, according to a forecast released Thursday.
The firm said it looks for fixings as high as $2,120 an ounce and an average of $1,808, with the precious metal boosted by geopolitical and sovereign-debt issues and more central-bank buying. However, the trade house also said that it looks for the market to be volatile, listing a forecast low for the year of $1,550.
The firm said it was “marginally bullish” on silver. It forecast that silver will average $36 an ounce in 2012, with a high of $50 and a low of $27.
Gold ended 2011 with a 12% gain from the prior year, MKS said.
“We expect most of the factors that drew gold higher in 2011 to continue to push the yellow metal towards a new all-time high in the course of 2012: geopolitical tensions in specific regions, sovereign-debt quality deterioration, (and) official-sector buying just to name a few,” MKS said.
The firm said it anticipates any crisis spreading over North America and Europe to further affect the liquidity in the banking system. However, such a scenario would have a two-fold impact on gold. It would initially prompt additional gold buying as a safe heaven. But, if liquidity becomes scarce, the market might start dishoarding gold scrap in larger quantities, MKS cautioned.
“Such a scenario would be even more likely if gold reached new highs,” MKS said. “Such a price correction could prompt some central banks to add on some gold to their reserves.
“The revolutionary mood that recently affected certain Middle Eastern and North African countries might be contagious to other regions and further motivate gold buying. To summarize, we expect gold to reach new highs in 2012 and to trade in a wider range. We expect 2012 to be another volatile year.”
Meanwhile, MKS described itself as “only marginally bullish” on silver, although it expects the metal to remain in focus as an alternative to gold in investors’ portfolios.
“We don’t expect the physical demand to drastically increase and the ETF inflow to remain moderate,” MKS said. “As a net importer, China will remain a key factor for the physical silver demand throughout the year. Any rally in gold could prompt speculative buying in silver, resulting in short-lived price spikes. The lack of strong physical interest and support shall dominantly result in speculative trading. Again, silver is set to remain very volatile and to trade in wide ranges with erratically rallies and sharp downside corrections.”
Platinum was forecast by MKS Finance to average $1,498 an ounce, with a high of $1,790 and a low of $1,350. The metal “disappointed” in 2011, and MKS said more of the same could occur in 2012.
“Physical demand shall remain range-bound as the industrial demand is set to further suffer from the very hesitant recovery in global growth,” MKIS said. “Some moderate inflow into ETF(s), if any, could provide some support. Any consistent upside moves in gold and silver could impact the platinum price on a temporary basis as a result of basket buying.”
MKS Finance forecast that sister metal palladium will average $662.50 this year. The firm listed a forecast high of $750 and a low of $570.
“Hesitant global growth recovery shall continue to affect industrial demand,” MKS said. “We are not expecting any wide moves in 2012. While the supply/demand balance remained fragile in 2009-2010, the expected reduction in industrial demand this year shall result in a more balanced equilibrium.”
By Allen Sykora of Kitco News; asykora@kitco.com
Criminals determine gold’s future
James West - MidasLetter.com | January 2, 2012
http://www.mining.com/2012/01/02/criminals-determine-golds-future/
According to faulty interpretations of Mayan calendars, 2012 is supposed to bring with it the demise of humanity. Fortunately for us, this apocalyptic myth, like so many, is based on a superficial interpretation of the Mayan calendar. Like many stories based on a lie, this one nonetheless gains traction in the popular imagination thanks to our fascination with anything apocalyptic.
Besides Mayan disinformation, there are many commentators who advise selling all gold, while acknowledging that gold is going higher in 2012. The lunacy of such advice is self-evident to me, and I presume, to the vast majority of readers. But lets not dwell on mainstream financial media: the credibility of that institution is non-existent going into 2012, and most intelligent people understand that story assignments originate in board room conversations and on golf courses, and filter down through editorial management. Thus, whose who sit on the boards of directors of banks and media conglomerates are easily able to transmit their requirement for negative sentiment towards precious metals easily and without public scrutiny.
There is no point in arguing whether gold and silver price manipulation exist – even Bart Chilton acknowledges that it does. But we are forced now to consider that manipulation as a “fundamental” influence on the future price of gold. The problem is that as a fundamental factor, is not quantifiable like supply and demand metrics, because its intensity is arbitrarily (at least, to public view) decided, and so all we can say for sure is that supply and demand drivers are, in the futures market, seconded to the fundamental influence of futures market manipulation. And since the futures market is exponentially greater than the spot markets, the spot price is determined by such manipulative shenanigans.
I often wonder when I hear people like Dennis Gartman, Jon Nadler and others for whom it would seem that it should be within their interest to be bullish on gold, are bearish because they have factored in that fundamental and participate on the short side more so than the long. How else to justify the main commentator on a site that sells gold being uniformly and relentlessly negative in his comments about it?
Thus, despite the fact that Europe’s Quantitative Easing ship has been launched, and the U.S. QE3 stands by in a hidden harbour, those fundamental facts that are intensely gold price positive must considered in the light of certain facts pertaining to the futures market. These are:
1. Oversight of the futures and derivatives market, presently the domain of the Commodities Futures Trading Commission, is in reality a collusive accomplice in the exploitation of futures markets along with the major financial institutions who represent that vast majority of futures contacts each month. In the future, this criminal activity will be identified and exposed publicly, and properly categorized as criminal manipulation. Nobody will be indicted, however, as the United States government is also an accomplice in shielding the perpetrators from prosecution.
2. Whereas the original purpose of the continued downward manipulation of the gold price was to induce a general perception that the U.S. dollar was and is a sound currency, the major banks who are regularly short silver and gold in significant volume have since understood that through the control of markets and associated volatility, they can regularly reap huge profits, but continuously rolling over losing contracts in their “dark” market, while waiting until the price can be driven downward sufficiently to put short contracts in the red into the black.
3. There is no intention nor interest in curbing the manipulative schemes on the part of the CFTC, because while they have been tasked with oversight, their powers of investigation, and most importantly, their ability to indict or even investigate such criminal activity is limited.
Europe is already printing money technically, in that it is purchasing weak sister bonds where no private entity dare wade in for less than 7% risk premium. While the line item accounting might trace the cash for the purchase of the bonds from a pre-existing balance, following the money leads to a quagmire of murky road forks that wear obscurity as a mark of intention. That the ECB has already decided to yoke its last resort bank backstop to the most larcenous countries’ bad loans is, to some, proof positive that solving the problem is not the priority: keeping the game going is the number one goal of current Eurozone management.
As the European Central Bank prepares to launch a program to replace frozen bank lending with thinly and delusionally configured quantitative easing as a last-option defense against the seizing up of the European banking system, markets rally, alebeit temporarily, lending the impression that there is a solution to the problem available. Quite the opposite is true. Succumbing to the last ditch fabrication and distribution of capital in a system that is choking on an excess of capital is merely deferring the inevitable while amplifying the severity of future market implosion on the near horizon.
The blinking red light on this latest ham-fisted implementation of perception management was the absence of confirmation that systemic risk appetite was back in the form of anemic bond market activity. If there was a real rise in confidence unfolding, then interest rates should arguably be dropping and private appetite for sovereign bonds materializing. Neither is the case.
If it were possible to stimulate real economic growth (as opposed to nominal economic growth that appears as profit on bank and financial sector-related companies as a direct result of free government money), then stimulus and government lending might be considered advisable.
Consider the effect of TARP, Bailouts, and the various QE’s that started in 2008 in the U.S. in repsonse to the freeze-up of credit markets. At the onset of the stimulus, stocks rallied and the “recovery” was declared officially underway.
But after injecting a total of $1.5 trillion into bank bailouts and stimulus, we are three years down that road with zero economic growth, banks who used the funds mostly for proprietary transactions that have created the illusion of market stability through reported earnings, and a fabulously expanded Fed balance sheet. The debt crisis in Europe is on a par with the debt crisis in the United States, and the value of money is in terminal decline. The lesson is that while QE and other forms of stimulus are superficially satisfactory treatments for the symptoms, they are far from a cure, and at the end of the day, have only compounded the problem. The effectiveness of stimulus and easing, most importantly, exponentially increasing the quantity of currency in the system, is now known to have a finite window of influence, and, once exhausted, begins to affect the economy negatively. That’s because the emergent perception is that stimulus only benefits the top layer of the financi
al system, and benefits the broader economy negligibly.
Extending credit facilities and replacing private sector capital sources with public ones, while at the same time inflicting austerity measures on the general population, is a recipe for absolute disaster in the long term, for the weaker economies. A population that finds itself expected to work harder, pay higher taxes, amid diminished infrastructure, services, and opportunities is going to respond with outrage, and will not work harder, or pay higher taxes, or tolerate social safety net destruction. They are going to take to the streets, and further paralyze economic activity.
We’ve seen riots in France, Spain and Greece, and as economies continue to deteriorate in 2012, violence and protests will escalate, and at some point, it may pass the threshold of public protest into civil war.
If the Occupy Wall Street movement were to seek some relevance, targeting the causes of economic disparity – primarily the protection of predatory financial institutions who control governments in North America and Europe through corrupt and collusive political systems – would yield a far more effective dividend than protesting against the outcome of such activity.
Maybe that’s what we can look forward to in 2012…an end to the corrupt governments of the United States and Europe, and a dismantling of the largest financial institutions, whose boots rest on all of our throats.
Gold Bounce Confirms Bull Market Intact on Its Way to $3,000 – $10,000
Friday, December 30th, 2011 | Posted by Editor
http://www.munknee.com/2011/12/gold-bounce-confirms-bull-market-intact-on-its-way-to-3000-10000/
With what is happening in the price of gold these past few weeks/months it is imperative to take a look at the big picture and in doing so it shows that we are still very much in a long-term bull market. Let’s take a look at some charts that clearly outline where we are currently and where we could well be going. Words: 925
So says Lorimer Wilson, editor of http://www.munKNEE.com (Your Key to Making Money!) and http://www.FinancialArticleSummariesToday.com (A site for sore eyes and inquisitive minds). Please note that this paragraph must be included in any article reposting with a link* to the article source to avoid copyright infringement...
see the link above for the rest of the article...
Gold, Silver and HUI Index to Bounce Back to Major Highs by May 2012
Tuesday, December 13th, 2011 | Posted by Editor Goldrunner
http://www.munknee.com/2011/12/goldrunner-gold-silver-and-hui-index-to-bounce-back-to-major-highs-by-may-2012/
With the present major correction in gold, silver and the mining sector it is important to look at the big picture and see what the charts are saying from a technical fractal relationship with what happened back in 1979 when the last truely major bull run occurred. To date the situation is, frankly, no different than it was back then unfolding just as it should. As a result we can expect MAJOR upward price action in physical gold and silver and in their mining (producers, developers, explorers and royalty streamers alike) in the next few months on their way to their respective parabolic peaks in the years ahead. Read on. Words: 1604
Those are the views of Goldrunner (http://www.GoldrunnerFractalAnalysis.com) as conveyed in his original article (see original version here). Lorimer Wilson, editor of http://www.munKNEE.com (Your Key to Making Money!), has severely edited the article below for the sake of clarity and brevity to ensure a fast and easy read. The author’s views and conclusions are unaltered and no personal comments have been included to maintain the integrity of the original article. Please note that this paragraph must be included in any article re-posting to avoid copyright infringement...
see the link above for the rest of the article...
Don’t Look a Gift Horse in the Mouth – Buy Gold Now With Both Hands! Here’s Why
Friday, December 2nd, 2011 |
http://www.munknee.com/2011/12/dont-look-a-gift-horse-in-the-mouth-buy-gold-now-with-both-hands-heres-why/
Since the fundamentals still point to gold’s long-term viability… why [are] investors responding by selling gold…? I was always told not to look a gift horse in the mouth… [so] take advantage of the dip. Words: 962
So says Peter Schiff (http://www.europac.com) in edited excerpts from his original article*...
click the link above for more...
COMEX: The March to Irrelevance
http://news.goldseek.com/GoldenJackass/1324501200.php
By: Jim Willie CB, GoldenJackass.com -- Posted Wednesday, 21 December 2011
Divergence between paper gold and physical gold price is happening, the process begun. Actual physical shortages have kept the price up. The naked shorting of futures has kept the paper price down. The fraud cases and lawsuits, with no hint of prosecution, provide the levered force to create much wider divergence, as traders and entire firms depart the tainted crime scene that is the COMEX. Trust has vanished along with private accounts. At the center of the backdrop for the divergence, apart from the criminal events, is the economic deterioration and asset market downdraft. It leads to margin calls, loan payment obligations, fading investor confidence, negative sentiment, and a desire to avoid loss. Hence the huge liquidity concerns, selling of good assets that command a strong price, and central bank encouragement of gold sales even with lease. These forces conspire to push down the gold futures price from the discovery process, called the paper gold price. These forces, although real, are exaggerated by the Syndicate to explain all. On the other side is the desperation among central bankers to cover debt securities up for sale or rollover funding. They resort to utter hyper inflation by monetizing the many types of government bonds. They are obligated to aid their banker cohorts, and thus purchase truckloads of badly impaired sovereign bonds and other collateralized bonds. Over time these sovereign bonds have proved toxic. The compelling need to stimulate economies, to redeem toxic bonds, and to recapitalize and nationalize the big banks adds to the monetary inflation outcome. Therefore, two sides are in opposition in a battle to the death of one or the other. No middle ground can be achieved, not any longer. It is the quintessential battle between monetary hyper inflation and restoring bank system integrity to avert collapse. The insolvency has recently met illiquidity. The battle features strong forces on each side. The divergence between physical and paper gold price is widening.
The incurable speculator junkies committed to the addictive leveraged game rigged by the Forces of Evil seem stuck at the casino tables, where fingers are lost, finally entire hands and arms. If their practice was to purchase physical, they could benefit from the paper price swoon, and join the Forces of Good team, rather than fighting the evil side on their dominated turf. To be sure, many aware analysts in the news maintain a small gold position in COMEX that is rolled over constantly. Many have physical positions but keep with the paper trades as a hobby, better described as an addition to the juice. Leverage cuts both ways. Their continued activity has left them exposed to theft, while knowing the criminality was widespread within the arena. So many players and firms are departing the arena altogether like Ann Barnhardt of BCM Capital. The divergence between physical and paper gold price is widening.
The desperation of the bad team is growing. The gold cartel has benefited significantly from the fresh Libyan gold supply (144 metric tons) and Greek gold supply (111 metric tons), not to mention the ample Dollar Swap Facility. It is the bankers New Gold, as reported by intrepid Jeff Neilson. In a fresh sign of bankster desperation, the lease rates for gold have been pushed down to net negative levels. The fresh supply from the two broken nations has greatly aided the COMEX, providing new cannon fodder. Perhaps more wars to liberate the oppressed can be conjured up, to release more tyrant wealth. It is not a coincidence that negative gold lease rates came when Libyan gold was made available (heisted) and when Italian sovereign bonds went into critical DEFCON mode. The gold supply helped to aid the lack of bond demand. The gold lease story is analyzed more fully in the December Hat Trick Letter.
INELASTICITY BLEMISH
A preface is warranted. The paper Gold market is very different in its internal dynamics from the physical. The paper Gold market shows signs of inelasticity that borders on comical. Witness the low demand in 2001 and 2002 when Gold had a paper price tag at $300 or less per ounce. Witness nowadays the amplified selling when the paper price declines. The leverage from the corrupted paper mechanisms forces margin pressures and sales. The leveraged game goes opposite to the real world of price mechanisms. On the upside, global demand rises with a rising physical price, called the gold fever. The inelasticity on the supply side is prevalent in the paper market, while the inelasticity on the demand side is prevalent on the physical market. To confuse the mix, mining firms realize some inelasticity as price falls, they are stuck with a liquidity crunch on their forward sales ruin. A huge amount of money is required to cover their losses, urged on by Wall Street advisors. Their mining operations suffer from lack of funds, and projects are curtailed. The paradoxical differences in dynamics help to push the gap between the paper and physical Gold price. The incompatible forces work to rip apart the COMEX. The divergence between physical and paper gold price is widening.
ILLICIT USAGE OF CLIENT FUNDS AS COLLATERAL
The hypothecation battle will bring sufficient publicity to help the divergence along. As more assets are seen as committed, involved, and tainted in the process of grabbing, snatching, and securing collateral, even by illegal means, the physical assets will be removed from the system. Parties will remove accounts and metal from the COMEX in response from basic self-preservation. On the investment and speculation side, harm has been rendered to managed risk. The client funds have begun to flee. The protection and security of money in private accounts has been under siege in recent weeks since the MF Global crime scene was established and the yellow tape cordon has been put in place. Investors are pulling money out of hedge funds at a rapid rate. The COMEX will be increasingly isolated. Clients funds were redeemed to the tune of $9 billion in October, almost four times as much as they pulled in September, according to Barclay Hedge and TrimTabs Investment Research. Investors in October yanked more from hedge funds, setting a single month high over the last two years.
The redemptions are the largest for the hedge fund industry since July 2009, when $17.8 billion was returned. The Barclay Hedge office put lipstick on the corrupt pig by commenting on how investors have lost patience with lackluster investor returns. To be sure, the average hedge fund is down by about 4% this year. The global hedge fund industry size has been reduced to $1.66 trillion, still sizeable. It is always interesting, if not amusing, to read the spin from the isolated corners. Hedge funds are seeing capital depart for the simple reason of moving away from crime centers. In the process the COMEX is being isolated. With increased isolation comes the easily recognized fraud. Look for some major stories soon about the raids to the GLD and SLV inventories by their custodians engaged in naked shorting. The Exchange Traded Fund fraud story is analyzed more fully in the December Hat Trick Letter. The divergence between physical and paper gold price is widening.
DYNAMICS OF PAPER VERSUS PHYSICAL BASIS
Grand divergence dynamics are becoming clear. Ann Barnhardt explained in detail how the COMEX will go away. It will not default, but rather fall into irrelevance. She laid it out in credible detailed form with numerous factors coming to play. The COMEX might still suffer the shame and spotlight of criminal prosecution. It will more certainly suffer from being ignored and shunned. The physical basis market will not respond to the declines in the paper futures market. The current dominant market will go away due to lost integrity and eroded trust. The consequences and implications of the recent major scandal and coverup are enormous, staggering, and sweeping. The changes from the MF Global failure and theft of private segregated accounts will come in time, perhaps accelerated by another similar event to slam the message home. The Syndicate has turned desperate, resorting to theft in the open daylight, which has resulted in direct consequences. Hundreds of COMEX clients waited in line for delivery of gold, and had their wallets stolen by JPMorgan. Their Gold & Silver set for delivery found its way into JPMorgan accounts at the COMEX. The details of the missing silver then reappearing silver is discussed in the December Hat Trick Letter. The slow mentally overlook this fact. The alert who point to fraud consider it a smoking gun. On its face, evidence mounts that JPMorgan simply converted 614k ounces of MF Global client silver into JPM licensed vaults. Big hats off to the Silver Doctors for excellent financial fraud forensic analysis. Do not expect prosecution over the crime, for MF Global, for JPMorgan, or for the accomplices in London, not even Jon Corzine. The Fascist Business Model in the Untied States does not permit prosecution. The bigger the crime, the more likely the perpetrator is in control of the government high offices, the financial ministry, the printing press, or the regulators.
Ann Barnhardt explained how the COMEX will fade away into oblivion. Its final chapter will be marred by a grand price divergence, where the futures market price declines from shunned avoidance, while the cash physical market price holds steady then rises. Many including the Jackass had thought that a slew of delivery demands would force a drain in their gold & silver inventory, eventually leading to a slew of lawsuits, together to shut them down as a corrupt enterprise arena. The MF Global theft reveals the alternative route that seems more clear. The gold cartel led by JPMorgan and secretly by the USFed will not go quietly. They have resorted to theft of private accounts on the open stage. The money is not missing. That is the lie. It is held in JPMorgan accounts in London, where fraud laws are more relaxed. We have seen this Madoff movie before, but it will be shown on the silver screen again. The divergence between physical and paper gold price is widening.
The backlash has begun and will gain strength. Barnhardt offered many cogent arguments with detail on how the COMEX will be ignored from distrust and suspicion of further thefts, as clients remove funds and close accounts. Here are her main points. They apply to Gold & Silver. She has the Barnhardt weblog: http://barnhardt.biz/
• Arbitrage is set to kick in. Players will buy at the cheaper corrupt paper market in COMEX and sell in the higher honest physical market, wherever brokers can match to make deals. (It is the same phenomenon that ripped the Euro sovereign bond market apart, as the German Govt Bond yields remained much lower than the Spanish and Greek.) They will take advantage of a strong basis, buy at the discount offered by COMEX, and sell into the cash spot physical market.
• A linchpin holds the market together. Keeping the futures markets tied to the underlying cash physical market is the fact that the futures contracts permit taking delivery. That delivery mechanism just broke as linchpin in full view. The futures market has lost viability and trustworthiness because of the MFG collapse and theft.
• The entire delivery mechanism has been corrupted and undermined. Taking delivery has meant a holding of physical metal bars is stored in a certified vault with your name attached. No longer are such holdings considered safe. Thefts occurred, and lawsuits have occurred to decided upon ownership of bars in dispute.
• The de-coupling process comes when arbitrageurs finally lose all confidence in market interaction dynamics, as the cash market will lose connection on price from the futures market. Players will not be willing to take the risk of having their money, positions, and physical metals stolen or confiscated.
• As players flee the futures market, the paper futures prices will decline. The cash physical market will hold steady. The divergence will come and be noticed, then be widely publicized. The players will realize that the physical market is the only remaining game to be played with honest rules in effect. The cash dealers will ignore the futures prices, no longer a valid price discovery, seeing that market demand for their physical inventory is robust, and maintain their prices steady. Later, they will even raise the physical prices. Then later still, the parabolic spike comes for physical Gold & Silver.
THE GREAT SHUN BY MINERS
Asset management funds are appealing to mining firms for direct metal supply. They are bypassing the COMEX in a new trend. It is a natural development, as miners seek a fair price and the funds seek a reliable supply. The COMEX is cut out of the process. The Sprott Funds have revealed how they sourced their precious metal from mining firms last year. The official exchanges are being cut off, a form of isolation as a result. The divergence between physical and paper gold price is widening.
See the Ashanti story as typical. The COMEX is seeing reduced supply lines, reduced operations, more criminal implications, horrible publicity, and fewer clients. Criminal fraud does that, as lawsuits will follow like cold rain. The trend shapes up well for higher gold & silver prices. Mark Cutifani is CEO of AngloGold Ashanti, a $16 billion mining firm. He said, "Major [asset management fund] buyers are finding it is hard to get physical gold. People are coming directly to us [for large gold purchases,] people who want tonnes of physical gold, people with serious financial muscle, because they are finding it is very difficult to secure the volume of gold they want. That is something we have noticed over the last 18 months, and it has been increasing in the last six months. People are finding its hard to get physical gold." The clear message is that the COMEX has no spare available metal at all. Cutifani has good insights into the commodities and precious metals markets, and describes a fascination new trend regarding the global picture. He pointed out that major gold buyers are emerging from the Middle East and Asia. See the Bull Market Thinking article (CLICK HERE).
NEW MARKETS FLOWERING
New gold centers are forming, where the safety is most assured. Hong kong and Dubai have emerged as reliable honest brokers, and will continue to provide valid safe haven. Switzerland, London, and other locations are fading fast. They are the corrupt centers where fascism has become prevalent, laced through the financial system.Takahiro Morita, the Japan director of the World Gold Council, reported that Japan's gold exports in the 10 months ended October totaled 95.6 metric tonnes, their highest level since 2008, when it registered at 95.5 metric tonnes. People who bought gold and jewelry in the 1980 and 1990 decades are selling back what they purchased, according to precious metals traders. Japan has turned into a big exporter. Contrast to the official side. Central bank purchases have risen by 114% over the previous quarter. Purchases by central banks could hit 450 metric tonnes this year, concludes the investment research at the council. The volume represents the highest level of central bank buying since at least 1970, perhaps the greatest in recent history. A veteran gold trader with actual experience in these locations pitched in to explain. He said, "These are not sales in Japan. They are exports, an important distinction. Many investors are busily relocating their precious metal bullion to Hong Kong and Dubai UAE. Look for Dubai to be the HK of the Middle East. The Chinese have made that decision, and it is being implemented with lightning speed." Most of the relocation from Japan shows up as exports, which require payments.
October imports into China from Hong Kong rose 50% over September, and up 40-fold from last year. The more attractive fair price paid in Shanghai reached $50 above the corrupt controlled London price. The arbitrage has been very active. Chinese gold imports from Hong Kong hit a record. The Financial Times reported Chinese gold imports from Hong Kong hit a record high in October and astoundingly, they accounted for more than one quarter of the entire global demand. Data showed that China imported 85.7 tonnes of gold from Hong Kong in October, up 50% from the previous month and up more than 40 times from October of last year. It marks the fourth consecutive month that China's gold flows from Hong Kong have hit new highs. The article noted that the price arbitrage between London and Shanghai was favorable for Chinese imports during late September and early October, giving astute clever traders an edge. Gold on the Shanghai Exchange traded up to $50 per ounce above the main global market based in London, a record price difference. Purchases from China have fallen since October, as the recent strength in the USDollar has made gold more expensive. Also, considerable new strain has been felt inside China in recent weeks. Conclude that price arbitrage has begun to show itself across international boundaries. The divergence between physical and paper gold price is widening.
ONE GOLD EVENT, THE BIG SQUEEZE
No gold chart will be shown in this article, out of disrespect deserved for the COMEX criminal activity. A story was recounted in recent days from my best source of solid reliable gold information. The aware gold community has overlooked a phenomenon that might be more profound in action here and now. A major squeeze is on that capitalizes on the artificially low COMEX price and the higher honest physical price. The Barnhardt effect can be seen, or at least recounted. A gold trader informed that some multi-$billion purchase Gold orders have been in the process of filling at or near the $1600 price per ounce. The price must remain near $1600 to complete the orders and permit them to clear. Call it Agent2000 who seeks the massive amount of Gold, one of the Good Guyz. The name fits since their goal is to force the Gold price back over $2000/oz after the sale transaction clears. Since so large, the orders take time to fill completely. The low-ball buy orders have been filling for over two weeks. At the same time, the Agent2000 buyer has enlisted the aid of numerous assistants to push down the paper Gold price by putting extreme pressure on some bad players, some nasty types from the usual list of suspects in the Western banking sector. These bankers are being squeezed out of their gold, as they contend with deep insolvency, reserves requirements, falling sovereign bond values, depositors exiting, and more. They are players in what has been widely called the Gold Cartel. The Jackass term has been applied in a wider sense, as they have been part of the Syndicate that reaches into the Wall Street banks, the defense contractors, news media, and big pharma.
The other side of Agent2000 is where additional intrigue lies. He (they) have buyers lined up on the physical side some deals ready to close at $1900 per ounce. Later the price will push over the $2000 mark. The buyers are ready. One must infer that the buyers have a great deal of money ready to devote to the battle. Maybe some is piled up to escape the clutches of the cartel, removed from the system. Maybe some is piled up at a major new slush fund to do battle with the cartel at their own game. Maybe some is piled up and kept out of sight from greedy hands in government officials, like off-shore in the Caribbean or sequestered in the Persian Gulf. This story might be perplexing to many in the gold community since the Good Guyz are pushing down the Gold price in order to facilitate a gigantic order that will work toward crushing the cartel by draining their gold. Their gold cannot be drained without the completion of a great many orders. It is only natural to attempt to achieve the lowest possible price. If the gold cartel insists on pushing the price down, then they open the door for major volume sales at the artificially low and very much bargain price. It is happening, but the gold community does not enjoy the symptoms of the process.
So a huge huge huge buyer of gold is busy, and a multi-$billion order is working through. The buyer demands a $1600 price, while on the other side of the table Agent2000 has a sale lined up for the same metal at a $1900 price on physical. The trade will take gold bullion from the Bad Boyz hands and put it into the Good Guyz hands. In the process, the COMEX supply lines will be drained more. This is consistent with mining firms removing supply lines to the COMEX. The Agent2000 buyer is pushing price down, squeezing some evil parties hard, crushing testicalia along the way. He (they) describe to the distressed seller at $1600 that pressures will continue until the deal is closed. The seller is in tremendous pain with open distress showing. So many assume the Bad Powerz are pushing down the Gold price. Not so!! This event and transaction displays how some pain comes in many isolated cases of Good Guyz pushing the Gold price down to empty the Bad Powerz vaults. My source would not reveal the identity of Agent2000 or the location of the squeeze. It seemed like London. The money is not exclusively coming from China. Word has it that Russia is also applying the pressure, with some Chinese teamwork. The Competing Currency War has a new major flank. The divergence between physical and paper gold price is widening.
THE HAT TRICK LETTER PROFITS IN THE CURRENT CRISIS.
Jim Willie CB, editor of the “HAT TRICK LETTER”
Look at the gold lease rates moving upward:
..............................................................
This explains my red highlighted comments in the previous post:
PERPETUAL Q.E. WITHOUT THE BILLBOARD
Jim Willie CB 30 November 2011
http://www.gold-eagle.com/editorials_08/willie113011.html
Quote:
The US Federal Reserve has fooled a lot of people into believing that the grand monetary pump and debt monetization project has been put on hold. The only thing that changed was their talking publicly about it. The money press has been working to the limit, never stopped. The discussion has been kept quiet, but the machinery still makes a lot of shrill noise. The proof is not movement of lips by central bankers, but the data from the monetary aggregate. The data is compelling in calling them out. The conclusion to reach is that Quantitative Easing has become the norm, the foundation policy, the emergency action to prevent implosion of the US banking system. Hyper monetary inflation is the New Normal. The sinkholes are so broad and dispersed that even run of the mill analysts are beginning to see the light. They are concluding more and more than the credit-based system is collapsing. Never does the Jackass rely upon central bankers to inform of events, policies, and actions. They have been dedicated lately to deceptions much like turning off smoke alarms, killing the electricity on fire station monitors, laying off the working firemen, and hoping the public does not notice the raging fires which have been accompanied by grand larceny looting to hide the flames
......................................
Continued at the link above...
Gold drops nearly 5%, breaks 200-day average
Dec. 14, 2011, 3:05 p.m. EST
http://www.marketwatch.com/story/gold-futures-continue-slide-after-fed-decision-2011-12-14?dist=countdown
By Laura Mandaro and V. Phani Kumar, MarketWatch
SAN FRANCISCO (MarketWatch) — Gold futures skidded nearly 5% Wednesday, sinking below the $1,600 level for the first time in nearly three months, as a drop in the euro signaled a new level of anxiety about the region’s debt crisis and investors sought cash as the safest asset.
The decline blew the yellow metal past some long-held technical levels, which then exacerbated the selloff. Silver futures, which often shadow gold’s moves, closed down 7%, copper lost nearly 5% and palladium sank almost 7%.
Gold for February delivery /quotes/zigman/656382 GC2G -0.77% settled down $76.20 an ounce, or 4.6%, to $1,586.90 on the Comex division of the New York Mercantile Exchange, the lowest settlement for a most-active contract since mid-July. It was the first time gold had lost grip on $1,600 since late September.
The day’s loss, also its worst since late September, was also a recovery from an intrasession decline. February gold had fallen as low as $1,565.70 an ounce, according to FactSet, representing a $97.40 drop for the day.
A combination of factors sent gold prices lower, with concerns over Europe at the forefront. But in contrast to long stretches of the past two years, investors have been choosing dollar-denominated cash over gold in recent weeks.
“It’s the never-ending European debt crisis still playing out, combined with some year-end profit-taking and a weakening of the euro,” said Jeff Wright, metals and mining analyst at Global Hunter Securities. “A number of funds are rotating into money-market funds in the U.S. It’s safe and they don’t have volatility,” he added.
Gold’s decline early in the session sent the contract below a 200-day moving average of around $1,619 an ounce, its first break below this level since January 2009. The drop deepened from there, pushing the contract below $1,600. Read more on 200-day average breach on the Tell.
A break below that average usually marks the start of a bear market, said Jon Nadler, senior metals analyst at Kitco Metals Inc. North America.
Gold had been trading with a $20 to $30 loss ahead of the U.S. session, declining after Tuesday’s decision by the Federal Reserve to keep U.S. interest rates unchanged and to avoid new monetary-stimulus programs amid a slightly improving economic outlook. This decision, while largely expected, served to end speculation of more quantitative easing — a central-bank move that‘s had the effect of weighing on the dollar and feeding demand for gold the past three years. Read about the Fed’s statement.
Wednesday’s trading action in the precious metal, however, largely was focused on developments in Europe.
The euro /quotes/zigman/4867933/sampled EURUSD +0.03% dropped below the key $1.30 level, down more than 1%, after Italy had to pay a euro-era-high yield to sell 5-year bonds. European and U.S. stock indexes dropped more than 1%. Read more on currencies.
“So much had been on the house of cards of the Dec. 9 meeting,” or the European Union summit where leaders were expected to come up with a definitive solution to prevent the break-up of the European currency union, Kitco’s Nadler said. In recent days, analysts have criticized the summit’s agreement to forge a stronger fiscal union as resulting in little immediate aid to struggling euro zone-members.
“The icing on the top was [Fed Chairman Ben] Bernanke’s decision not to give more,” in terms of monetary stimulus.
But we know this is a terrible fat lie as the money can be tracked and the supply continues to grow despite all the contrary talk... do your due diligence and find the real facts.
When you add “year-end book squaring, profit taking and realization that the safe-haven asset remains the dollar, that’s snowballed for frustrated longs and panicked late comers,” Nadler said.
Gold has fallen more than 9% this month, worse than the decline in stocks, as the dollar has gained. Mounting worries that the euro-zone currency union could break up have prompted investors to raise cash, analysts say, and gold is often seen as a liquid and profitable source of funds. Some analysts say European banks are likely leasing out their gold reserves, also to raise short-term funds.
Also the dollar’s /quotes/zigman/1652083 DXY +0.01% rise has curbed the metal’s value as an alternative to paper currencies.
“Gold prices are being influenced by factors that do not necessarily reflect underlying fundamentals,” said James Steel, a metals analyst at HSBC Securities, ahead of Wednesday’s U.S. session.
He also noted that hedge funds seeking to cash in on gains, at the end of a difficult year for professional traders, may be weighing on prices.
Silver for March delivery /quotes/zigman/656950 SI2H +0.43% sank $2.33, or 7.4%, to $28.94 an ounce.
March copper /quotes/zigman/654297 HG2H +0.49% lost 16 cents, or 4.7%, at $3.28 a pound.
March palladium fell /quotes/zigman/2304934 PA2H -0.14% $44.55, or 6.7%, at $619.60 an ounce.
January platinum /quotes/zigman/2304885 PL2F -0.98% lost $66, or 4.4%, at $1,426.30 an ounce.
/quotes/zigman/656382 Add GC2G to portfolio GC2G Gold - Electronic (COMEX) Feb 2012 $ 1,574.90 -11.50 -0.73% Volume: 11,503Dec. 14, 2011 9:02p
/quotes/zigman/4867933/sampled Add EURUSD to portfolio EURUSD USD/EUR 1.2985 +0.0003 +0.0254% Volume: 0.0000Dec. 15, 2011 2:00a
/quotes/zigman/1652083 Add DXY to portfolio DXY U.S. Dollar Index (DXY) 80.53 +0.01 +0.01% Volume: 0.00Dec. 14, 2011 9:02p
/quotes/zigman/656950 Add SI2H to portfolio SI2H Silver - Electronic (COMEX) Mar 2012 $ 29.06 +0.13 +0.43% Volume: 1,157Dec. 14, 2011 9:02p
/quotes/zigman/654297 Add HG2H to portfolio HG2H Copper - Electronic (COMEX) Mar 2012 $ 3.30 +0.02 +0.49% Volume: 2,438Dec. 14, 2011 9:02p
/quotes/zigman/2304934 Add PA2H to portfolio PA2H Palladium - Electronic (NYMEX) Mar 2012 $ 618.75 -0.85 -0.14% Volume: 59Dec. 14, 2011 9:01p
/quotes/zigman/2304885 Add PL2F to portfolio PL2F Platinum - Electronic (NYMEX) Jan 2012 $ 1,412.00 -14.00 -0.98% Volume: 600Dec. 14, 2011 9:01p
Laura Mandaro is a MarketWatch editor, based in San Francisco.
Varahabhotla Phani Kumar is a reporter in MarketWatch's Hong Kong bureau.
The Myths and Reality of Gold Confiscation
Nov 24 2011 11:39AM
http://www.kitco.com/ind/Turk/turk_nov242011.html
There are a number of common misconceptions about the gold confiscation foisted on the American people by President Franklin Roosevelt in 1933. Most of these have been offered as justification for FDR’s nefarious deed, and over time have endured to become urban legends.
For example, perhaps the biggest and most enduring myth is that FDR had to confiscate gold because it was needed to back the dollar, which was still defined as 23.22 grains of fine gold, i.e., $20.67 per ounce. What the propagators of this popular myth conveniently ignore is basic math.
In December 1932, the US Gold Reserve equaled 204.5 million ounces. This weight was slightly more than the reserve’s average weight of 202.2 million ounces from the October 1929 stock market crash through December 1932, a period that covers the worst of the depression.
After FDR’s election victory in November 1932, rumors began circulating that once in office, FDR would seize the people’s gold. Because of these rumors, which perhaps originated from tips by White House insiders who knew of the confiscation scheme, dollars were redeemed for gold, as was possible at the time, and much of this gold was exported or simply hidden. This point is explained in detail in Milton Friedman’s The Monetary History of the United States.
As a result of these redemptions of paper dollars for physical gold, the US Gold Reserve dropped to 193.3 million ounces by FDR’s inauguration in March 1933. With the confiscation thereafter in place, the outflows stopped, and the reserve began to grow with the metal collected from the confiscation. The reserve reached 195.1 million ounces in January 1934 when FDR re-defined the dollar as only 13.71 grains. It was a 41% devaluation of the dollar, which meant that it thereafter took $35 to exchange for one ounce of gold. So here is the math.
At $35, the 195.1 million ounces in the US Gold Reserve in January 1934 equaled $6.83 billion of gold backing for the dollar. Gold was now overvalued in dollar terms, as evidenced by the rapid flow of gold into the US Gold Reserve, which in the first month rose to 212.5 million ounces. But the bonanza for gold holders did not stop there. People continued to exchange their overvalued gold for dollars, with the result that the US Gold Reserve reached a new all-time record high of 227.9 million ounces only six months later in August 1934.
From these huge gold-flows into the reserve, it is clear that valuing the gold reserve at $6.83 billion was high enough to re-establish confidence in the dollar. Therefore, if we divide this value by the 193.3 million ounces in the reserve before the confiscation, we can conclude that a devaluation of the dollar to $35.33 per ounce would have achieved the same $6.83 billion valuation necessary to re-establish confidence in the dollar, but it would have done so without any confiscation.
So clearly, notwithstanding the enduring myth, FDR really did not need the weight of gold collected from the confiscation to re-establish confidence in the dollar. Simply devaluing the dollar by a slightly greater amount would have achieved the same objective. So why did FDR confiscate gold?
In our book, The Collapse of the Dollar, John Rubino and I provided an answer, but it wasn’t an explanation that we developed. Rather, the answer came from Alan Greenspan’s 1966 essay entitled “Gold and Economic Freedom”.
“The abandonment of the gold standard made it possible for the welfare statists to use the banking system as a means to an unlimited expansion of credit…The financial policy of the welfare state requires that there be no way for the owners of wealth to protect themselves. This is the shabby secret of the welfare statists' tirades against gold. Deficit spending is simply a scheme for the confiscation of wealth. Gold stands in the way of this insidious process. It stands as a protector of property rights. If one grasps this, one has no difficulty in understanding the statists' antagonism toward the gold standard.”
So it seems clear to me that FDR confiscated American’s gold for the same reason Lenin confiscated it in Russia and Hitler confiscated it in Germany, namely, to get it out of the hands of the people. This point is made clear in a wonderful speech given in 1948 by Howard Buffett, the father of Wall Street legend Warren Buffett, entitled “Human Freedom Rests on Gold Redeemable Money”. A thorough reading of Buffett’s thoughtful speech will help clear the myths and explain the reality of gold confiscation. http://www.fame.org/pdf/buffet3.pdf
by James Turk,
November 23rd, 2011
The $gold downtrend is short term and the Point & Figure chart above says a bearish price objective is in effect down to $1540... the market will tell us... if it happens, it should bounce back FAST!!!
Thanks. I didn't hear about the higher margin rates. Ouch.
The dip is being caused by multiple factors:
1) continued worries over the European debt crisis
2) Higher margin requirements for gold trades that were announced Friday by the CME Group
3) fears due to another ression,people have more faith in the dollar than gold
*Any prediction on how low it will go is only a guess, but im prepared to load as much as i can once i feel a bottom has been reached
$GOLD - Daily Candlesticks
Futures, where do ya think the bottom of the dip is? What's driving the dip? People taking huge profits? If it'd dip to 1400 area, I'd jump in.
Vaults... what a way to confiscate the majority of the yellow metal... hold your own physical!!!
Gold Vaults Running Out of Space!

Rooms in vaults designed to hold gold bullion are filling up faster than ever. The Swiss Precious Metals bullion vault in the 7.4-acre Singapore FreePort has seen demand rise fivefold this year since opening the facility.
Every day, more and more investors are interested in paying up to 1 percent of the value of their gold holdings just to ensure they remain secure. CEO Jean-Francois Pages is planning to expand in order to accommodate those investors. Blueprints for extensions are underway.
Other banks are doing just the same. Barclays Capital is adding an entirely new vault. Deutsche Bank AG and The Brink's Co. are contemplating making more room for gold bullion as well. For the first time in eight years, the 112-year-old Perth Mint refinery is also considering expansions, anticipating gold demand to continue its rise for quite some time. In this most recent 11-year rally prices have increased SEVENFOLD.
Brink’s, the largest bullion carrier in the U.K., is considering adding more storage after opening a new London vault earlier this year. Barclays, based in London, is building a vault in the city that will open next year, the bank said in a statement last week.
Deutsche Bank, based in Frankfurt, is considering expanding existing facilities and developing new ones to meet demand, Matthew Keen, a director at the bank, said earlier this month. JPMorgan Chase & Co. (JPM) started a vault at the Singapore FreePort location last year and opened another in the financial district of New York.
“With gold prices where they are, we encourage people to keep it in safety-deposit boxes at banks or vaults, which gives that sense of security,” said Scott Carter, chief executive officer of Goldline International Inc., a Santa Monica, California-based precious-metals retailer established a half- century ago.
On September 6, 2011 gold set an all-time record high of $1,921.15 per ounce. That's double what gold was worth just four short years ago in 2007. The market dilemmas and overall trouble in the global financial system have millions leaning on gold for wealth-security.
European customers are the #1 big-buyers right now. Frightened for the future of their continental economy and the euro, the European investors are turning to gold and other precious metals for a safe-haven.
According to a recent Bloomberg poll at the London Bullion Market Associate conference in Montreal earlier this week, 16 experts believe gold will surpass $2,000 this year then peak around $2,268 next year.
Other's have more dramatic assertions, saying the world economy is worse off than we think...
With central banks, major hedge funds, sovereign funds, and individuals alike backing up nearly all of their wealth in gold, it seems like gold is perfectly positioned to climb to nearly unthinkable levels in just a matter of time...
by Brittany Stepniak - Wednesday, September 21st, 2011
JER1
Comex Gold Extends Already Sharp Gains in Wake of Very Weak U.S. Jobs Report
02 September 2011, 08:39 a.m.
By Jim Wyckoff
Of Kitco News
http://www.kitco.com/
http://www.kitco.com/reports/KitcoNews20110902JW_update.html
(Kitco News) -Comex gold futures prices are trading sharply higher and have hit a two-week high in the wake of a very weak U.S. employment report. The key non-farm payrolls figure came in at zero growth during August, while the consensus was for growth of 80,000. The July non-farm jobs figure was also revised downward. It's keener "risk off" trading Friday morning and that's bullish for the safe-haven precious metals. Keep an eye on the U.S. stock indexes Friday. Stronger losses in the U.S. stock market Friday could push gold prices still higher and close to $1,900.00 an ounce. If the U.S. stock indexes stabilize and move off their lows Friday during the session, then gold would also likely come off its session highs. December gold last traded up $41.00 at $1,870.00.
By Jim Wyckoff contributing to Kitco News; jim@jimwyckoff.com
Zero growth??? WTH!!! Thanks almighty power brokers/puppet masters... Any other companies want to send facilities/jobs overseas???
How Low Can Gold Go on a Correction?
By Nu Yu, Ph.D.
Aug 25 2011 11:14AM
http://www.munKNEE.com
http://www.kitco.com/ind/Yu/aug252011.html
Gold is in the second phase of a Bump-and-Run Reversal Top pattern, which typically occurs when excessive speculation drives prices up steeply, and is now at a critical juncture where substantially lower prices could be realized. Let me explain.
According to Thomas Bulkowski, the Bump-and-Run Reversal Top pattern (read here for details) consists of three main phases:
1) - A lead-in phase in which a lead-in trend line connecting the lows has a slope angle of about 30 degrees. Prices move in an orderly manner and the range of price oscillation defines the lead-in height between the lead-in trend line and the warning line which is parallel to the lead-in trend line.
2) - A bump phase where, after prices cross above the warning line, excessive speculation kicks in and the bump phase starts with fast rising prices following a sharp trend line slope with 45 degrees or more until prices reach a bump height with at least twice the lead-in height. Once the second parallel line gets crossed over, it serves as a sell line.
3) - A run phase in which prices break support from the lead-in trend line in a downhill run.

As the chart above shows the price of gold has breached the sell line at $1,830 so we can expect to see a correction with downside price targets for support as follows:
$1,750 for support from the dotted pink line.
$1,650 for support from the warning line.
$1,500 for support from the lead-in trend line.
Dr. Nu Yu
What a tremendous bounce today for $GOLD:
......
After Correction, Big Rally for Gold, Silver: Puru Saxena
8/24/2011
http://www.kitco.com/kitconewsvideo/
WOW!!! Gold Off Charts as Prices Heading ’Parabolic’
By Nicholas Larkin - Aug 22, 2011 12:34 PM ET
http://www.bloomberg.com/news/2011-08-22/gold-goes-off-charts-as-gartman-sees-prices-for-metal-heading-parabolic-.html
|
Followers
|
29
|
Posters
|
|
|
Posts (Today)
|
0
|
Posts (Total)
|
524
|
|
Created
|
07/13/08
|
Type
|
Free
|
| Moderators | |||
| Volume | |
| Day Range: | |
| Bid Price | |
| Ask Price | |
| Last Trade Time: |


