News
News  Market Data
  Discover
Support: 888-992-3836
Copyright © 2023 InvestorsHub Inc.


Register for free to join our community of investors and share your ideas. You will also get access to streaming quotes, interactive charts, trades, portfolio, live options flow and more tools.
Silver has been consolidating sideways at the top of its range for a year. Looks particularly bullish to me. If and when it breaks its consolidation range higher, to new highs, seems the breakout will trigger a continuation to the bull run much higher. Plus the reddit dude silver short busters, and the silver bugs, are waiting and ready to break the banker hedgie shorts cartel.
$AG back to $10
To each his own. We are heading higher.
$AG First Majestic Silver is too expensive now at 9 Year high.. Silver is trading sideways and down for the year.
Wow. Great job, Capt, with the translations! I sense the paper markets will be coming to an end soon. Honest weights and measures will be restored. What the herd doesn't realize is that the honest, or "true" value of silver/gold will send them into shock mode.
Interesting how folks used to laugh at Mr. Sinclair years ago, when he said gold was going to $1,650/oz. and beyond.
Translation: "You are forcing us to obtain more gold to back our unallocated gold."
Translation: "If you go through with this, it won't just end the paper game in London - it will affect every part of the gold market across the entire world. If make us get rid of our unallocated gold, we won't be able to make money and we'll be finished."

Thanks for posting.
https://www.cnbc.com/2021/06/03/russia-to-remove-dollar-assets-from-national-wealth-fund.html
Just more fuel for higher Silver/Gold prices...
That could be a concern for the U.S., according to a former U.S. Treasury official, Michael Greenwald.
“What alarms me is if Russia, China, and Iran each creates central bank digital currencies to operate outside of the dollar and other countries followed them,”
#AG: CHECK THIS OUT SLIM,..BASEL III...
BOMBSHELL: LBMA Admits that Basel III Would Kill Unallocated Gold and Lead to Higher Prices!
https://www.lbma.org.uk/articles/lbma-responds-to-prudential-regulation-authority-consultation
https://new.reddit.com/user/captainscottty/comments/ns1uzf/bombshell_lbma_admits_that_basel_iii_would_kill/
SPOILER: THERE ARE SOME HUGE BOMBSHELLS IN THIS LETTER/REPORT!
This was not getting the attention is deserves, so I'm doing a quick write-up to get the word out. There are some screaming bombshells in this report that all apes should know about as banks are dragged, kicking and screaming, into a post-Basel III world.
The LBMA and World Gold Council have explained, in their own words, why Basel III would end the paper game as we know it.
In their own words:
"LBMA and World Gold Council jointly respond to the Prudential Regulation Authority’s consultation paper on the implementation of Basel Standards.
"This response focuses on the application of the Net Stable Funding Ratio (NSFR) and the unintended consequences that the NSFR would have on the precious metals market."
You can download this research letter yourself from the LBMA website. I've posted a screenshot of the relevant section here, which I will translate into plain language below.
"The Basel Committee on Banking Supervision (BCBS) NSFR standard is designed to oblige banks to finance long-term assets with long-term money and thus avoid the liquidity constraints and failures witnessed during the 2007-2008 global financial crisis."
Translation: "You are forcing us to obtain more gold to back our unallocated gold."
"However, the BCBS standard does not expressly exclude from bank NSFR calculations the unallocated balances of precious metals held on balance sheet by the LPMCL clearing banks as a result of clearing and settlement activities nor recognise that gold does behave as a currency when providing a gold loan or borrowing against gold."
Translation: "You should change the standards to treat unallocated gold as gold itself." (It's understood here that because there isn't enough gold to back their unallocated gold, they will have to significantly pare down their unallocated gold, i.e. end the unallocated shell game.)
"Indeed, had the BCBS considered the treatment of unallocated balances in the clearing and settlement system, or had information to understand how gold is treated in a financing transaction, we believe that these unallocated balances would have been expressly excluded from the NSFR calculations, and gold would have been treated in the same way as currency, in the appropriate transactional context."
Translation: "Unallocated gold is just as good as actual gold, and if you were smart like us, you'd know that."
"An 85% RSF charge would: Undermine clearing and settlement – The required stable funding for short-term assets would significantly increase costs for LPMCL clearing banks to the point that some would be forced to exit the clearing and settlement system, which may even be at risk of collapsing completely. [Emphasis mine.]
Translation: "If you do this, unallocated gold will be far less profitable and the whole unallocated game could collapse."
"An 85% RSF charge would: Drain liquidity – The required stable funding would dramatically increase costs for remaining LPMCL members taking gold on deposit to be held as unallocated metal relative to the cost of providing custody of allocated metal. This would prevent LPMCL clearing banks from holding unallocated metal and drain essential liquidity from the clearing and settlement system. These unallocated balances are the only material source of liquidity in the clearing and transaction financing systems. Without this liquidity, there would be a material deleterious effect on the global precious metals market."
Translation: "Unallocated gold is liquid, so you're going to kill the liquidity if you kill the unallocated gold, and you don't want that, now do you?"
"An 85% RSF charge would: Dramatically increase financing costs – The required stable funding would penalise LBMA members who hold unallocated balances of precious metals. This would increase the cost of short-term precious metals financing transactions as stable funding costs are passed through to non-bank market participants. Such cost increases would impact miners, restrict refining and raise the costs of an inelastic key input to industrial and consumer goods. This includes some essential medical equipment and technologies required to reduce pollutants (such as catalytic converters)."
Translation: "Because we won't be able to fix metals prices, there will be volatility in prices when sourcing and delivering metal. This will raise metal prices for industry and consumer goods." (It's no mistake that they're emphasizing an increase in price due to volatility and "illiquidity", i.e. a market that isn't flooded with paper "supply." Also, note that bit about catalytic converters - this will affect more metals than just gold.)
"An 85% RSF charge would: Curtail central bank operations – Fewer LPMCL clearing banks may curtail central bank deposit, lending and swaps in precious metals. These operations are essential to offset the costs of storing gold reserves and generating income. In addition, this provides important liquidity to the market."
Translation: "If you get rid of us, good luck screwing with the gold price. You won't be able to lease it to us to dilute supply and control the gold price."
"The effects of an 85% RSF charge would not just be limited to the London OTC market, but would be felt globally across the entire gold value chain. While London acts as the default settlement location for most global OTC spot transactions, the precious metals market is international. An undermining of the clearing and settlement system, reduced market liquidity, significantly increased financing costs and curtailed central bank activity would fundamentally alter the structure and attractiveness of this market."
Translation: "If you go through with this, it won't just end the paper game in London - it will affect every part of the gold market across the entire world. If make us get rid of our unallocated gold, we won't be able to make money and we'll be finished."
Pretty scary shit, in this article they claim that farm land is risky, not so much if you're farming trees in Northern Maine, I'd imagine that true of most tree farms where fire isn't a big issue.
Captain, you keep posting, I'll keep reading.
I own another thousand shares since my last post, dumped my near useless Fiat currency according to your article, which unfortunately, has more fact than most want to believe!
Sliver keeps climbing, up today: Silver Futures 27.860 0.374 1.17%
AG is being held back.
#AG: The End Of Paper Gold & Silver Markets...?
The conclusion is that unless the BIS has an ulterior motive to trigger a chaotic financial reset of some sort, it is a case of regulators not understanding the market consequences of their actions.
https://www.zerohedge.com/commodities/end-paper-gold-silver-markets
The End Of Paper Gold & Silver Markets
Tyler Durden's Photo
BY TYLER DURDEN
SATURDAY, MAY 22, 2021 - 09:20 AM
Authored by Alasdair Macleod via GoldMoney.com,
https://www.goldmoney.com/research/goldmoney-insights/the-end-of-paper-gold-and-silver-markets
This article looks at the likely consequences of the Bank for International Settlements’ introduction of the net stable funding requirement (NSFR) for bank balance sheets, insofar as they apply to their positions in gold, silver and other commodity markets.
If they are introduced as proposed, banks will face significant financing penalties for taking trading positions in derivatives. The problem is particularly important for the London gold market, as described in last week’s article on this subject. Therefore they are likely to withdraw from providing derivative liquidity and associated services.
This article delves into the consequences of the NSFR leading to the end of the London forward markets in gold and silver. Replacement demand for physical metal appears bound to rise, and an assessment is therefore made of available gold not tied up in jewellery and industrial uses. An analysis of gold leasing by central banks, leading to double ownership of physical gold, is included.
The conclusion is that unless the BIS has an ulterior motive to trigger a chaotic financial reset of some sort, it is a case of regulators not understanding the market consequences of their actions.
https://assets.zerohedge.com/s3fs-public/styles/inline_image_mobile/public/inline-images/Breather%20%281%29.gif?itok=-Wy5at7a

Introduction
Last week I explained why as they stand the new Basel 3 regulations will make it uneconomic for banks to continue to run bullion trading desks. The introduction of the net stable funding requirement (NSFR) means that mainland European banks, of which ten are LBMA members including the Swiss, will have to comply with the new regulations from the end of June, and all UK banks, in effect the entire banking membership of the London Bullion Market Association (LBMA) will have to comply by the year-end. There are 43 LBMA members listed as banks, and on Comex there are currently 17 with long and 27 with short positions in the Swaps category, which represent bullion bank trading desks in the dominant futures contracts. So being similar, the Comex numbers must broadly replicate those operating in London. It is therefore reasonable to assume that if the LBMA’s banking membership ceases dealings in unallocated bullion, then very few will continue to deal on Comex — the LBMA crowd having ceased taking trading positions.
We are discussing not gold or silver but their derivatives. But there is a problem borne out of the LBMA’s insistence that it involves bullion, albeit unallocated, and not derivatives. The distinction could be important, depending on how the UK regulator applies the NSFR rules. This is because in the calculation of required stable funding, gold consumes 85% of available stable funding while gold liabilities contribute no available stable funding at all. The effect is to impart a negative factor into a bank’s overall net stable funding calculation, making unallocated gold trading hopelessly uneconomic in terms of deployment of total funding capital. The alternative, which does not appear to be under the LBMA’s consideration, is to admit that the whole unallocated gold trading business has nothing to do with gold bullion but is in fact gold derivatives; in which case capital funding penalties under the NSFR would be broadly limited to imbalances between derivative liabilities and derivative assets.
Consequently, it appears that an allocation backstop of 85% of available stable funding (ASF) must be swallowed in the case of gold, which does not appear to be the case if the LBMA confesses to the paper charade.
There are in London, in effect, two markets conflated into one, but they must not be confused. The unallocated market, otherwise known as dealing for forward settlement, is the product of bank credit expansion, not as the LBMA claims, physical metal whose bar origins, weights and fineness are not recorded for convenience’s sake. Perhaps the LBMA would like to let us know where they think it’s all stored; it’s certainly not in LBMA vaults, where after deducting headline figures for custodial gold the float reduces to as little as a few hundred tonnes. Unsurprisingly, the Bank for International Settlements lists these transactions as over-the-counter derivatives for statistical purposes, so we know how they are regarded by the international regulator.
Physical gold held on behalf of customers is never recorded on bank balance sheets. If a bank owns physical gold in its own vault, an independent vault, or allocated to it by another bank acting as custodian with its own vaulting facilities then that appears as an asset on its balance sheet. In that case, it can hedge out the price risk with a matching liability for a zero price-haircut within Basel 3 rules. But this has nothing to do with the NSFR calculation.
Clearly, unless the NSFR calculation is amended at the last moment, following its introduction the character of bullion markets will become markedly different. Gone will be roughly $600bn of paper gold, while presumably some of the paper demand released will migrate to physical metal. There is also the question of how outstanding imbalances will be resolved. This article assesses the consequences.
Unknown motives and politics
It is difficult to understand why the Financial Stability Board, under whose aegis the Basel Committee on Banking Supervision has produced Basel 3, seems intent on destroying derivative markets for gold, silver and also for other commodities. That will be the consequence of the introduction of the NSFR calculation in these markets. As the supreme authority overseeing fiat currencies, the Bank for International Settlements, which oversees the FSB, has no love for gold. One can explain the desire to do away with it: as the riskless form of money, it has been at the centre of monetary affairs for ever and the desire to do away with it must be overwhelming for neo-Keynesian modernists. But if that is the case, then it will be a serious misjudgement, because as this article reveals, the consequence of withdrawing paper supply is likely to drive the gold price significantly higher, along with silver and a host of other important commodity prices. Furthermore, this delayed act, first published in 2014, now comes at a time of rapidly rising commodity prices, reflecting the unprecedented acceleration of global money-printing in 2020, which ironically proves the importance of sound money — gold.
Already, tight, gold silver and commodity markets cannot accommodate a migration out of defunct paper into physical metals and energy without massive price rises to defuse the unsatisfied demand unleashed by this action. Perhaps the regulators at the FSB know this. If they do, then we can only conclude it is a deliberate attempt at a reset of all commodity markets. Bank corruption, particularly in precious metals has been rife: major banks have been regularly fined and continue to manipulate and spoof these markets, fines being seen as little more than a cost of doing business. These are systemic risks a regulator should address. But to assume the FSB is shutting down these paper markets to curb this behaviour exhibits a touching faith in its altruism.
Another popular theory is of an even wider financial reset. The BIS is coordinating research into central bank digital currencies, which if adopted cuts out the commercial banks altogether. In theory, it would allow central banks to more effectively target stimulus and do away with the destabilising cycle of bank credit. The ultimate aim could be to demote and then remove commercial banks from the financial system entirely, in which context the closure of derivative markets by regulatory means makes some sense.
Quantifying gold derivatives
We know from the Bank for International Settlements’ statistics that at the end of the second half of 2020, gold forwards and swaps totalled $530bn, which at the then price of $1898 was the equivalent of 8,685 tonnes of gold in paper form. But other than a triannual survey, the next being due in 2022, according to the BIS this figure is culled from dealers, mainly banks, in only twelve jurisdictions. With respect to commodities and foreign exchanges, these twelve jurisdictions have been found to capture roughly 80% of the total, so grossed up the gold tonnage rises to an equivalent of 10,806.
The LBMA positions are just part of the BIS total. The LBMA only records monthly settlements in London (Loco London) reported by the four clearing members that own and operate London Precious Metals Clearing Limited. They deal solely with LBMA members. The daily average settlement for December 2020 was recorded at 18.9 million ounces, or 588 tonnes. This is only one eighteenth of the BIS figure quoted above. The first thing to note is that daily settlements are not the same thing as outstanding obligations. Furthermore, the BIS statistic includes swaps and forwards not recorded in London nor, for that matter, are they necessarily settled through the LPMCL. But even taking these factors into account the difference between the BIS and LBMA figures still need further explanation.
In an analysis for Hardman & Co published in January 2020, Paul Mylchreest identified two other sources of turnover not included in the LBMA figures: trade between LBMA members and non-members, and central banks dealing in unallocated gold.
Now let us assume that the new Basel regulations have the effect of bringing unallocated bank trading in gold to an end. From the value of outstanding OTC contracts recorded by the BIS adjusted for the trends of its triannual surveys, we can take it to be about 10,800 tonnes. Assuming LBMA members on their own account run relatively minor net positions in the context of this enormous figure, we can assume this outstanding balance is mostly split between central banks, other non-LBMA users of the unallocated market, and OTC trades recorded in other centres.
We have no idea what the central bank position is at any one time, but it would be surprising if they took long positions. Instead, they can be expected to attempt to bolster market confidence in fiat currencies, and in particular the US dollar by selling gold. And by shorting paper gold, they also would seek to encourage physical supply by shaking out weak holders in ETFs. That being the case, not only has the central bank cohort no reason to be long of gold derivatives, but if they have positions, they are almost certainly short. The only likely exception is when a central bank which has leased gold sold into the market might hedge the price risk of not getting it back.
The ending, therefore, of London’s forward settlement market would remove an artificial supply of gold, which we can estimate to be the equivalent of over 10,800 tonnes of gold. To this we should add the net short Swap position on Comex, comprised of bullion bank trading desks, which is currently 486 tonnes. From the main sources of derivative supply, we can therefore see roughly 11,300 tonnes of paper gold supply being withdrawn from the markets if the bullion bank cohort ceases trading in derivative gold. We should now examine the position of central banks further.
Central bank leasing — yet to be resolved
In 2002, Frank Veneroso, a respected analyst, concluded that central banks had leased anything between 10,000—16,000 tonnes of gold at that time — the upper figure being about half of global central bank gold reserves at that time. He gave his reasoning at a speech in Lima on 17 May that year. Central bank leased gold was being sold into the market for dollars, which as part of a carry trade were being reinvested by banks in US Treasury bills and the like, the cost of finance being a gold lease rate of one or two per cent, for a yield of six or seven. Veneroso concluded that much of the gold was repurposed into jewellery and had effectively disappeared from the market.
Between the 1980s and the turn of the millennium, gold had been in a bear market, so the general public, including investing institutions, were either genuine sellers (which was in limited physical quantities) or hedging and speculating on the short side using derivatives. This enabled the bullion banks to hedge out the price risk on gold that would have to be eventually returned to central banks by going long for forward delivery relatively cheaply. But at the time of Veneroso’s speech, gold was $325, having risen from about $255 over the previous fourteen months.
Conditions were changing from a long-established bear market, which favoured gold leasing activity, into the beginning of a new bullish phase. Leasing and even undeclared sales then became a tool for central banks to supply physical liquidity to the gold market, either to rescue bullion banks from being badly squeezed or simply to suppress the price.
The leased gold might not have always left the vaults of central banks in the main gold dealing centres, as Veneroso assumed. However, during the period covered by Veneroso’s analysis, I regularly lunched at The Banker’s Club opposite the Bank of England’s rear entrance in Lothbury. On most days, security vans could be observed entering and leaving the Bank’s premises, transporting physical gold to and from the Bank’s vaults. So perhaps Veneroso was right about physical being sold and delivered into the market, at least to some degree.
In March 2008 gold breached $1,000 for the first time. It would have been impossible for central banks to recover their leased gold by then, because Chinese and Indian demand was beginning to suck physical gold out of Western markets at an alarming rate, in any case significantly faster than any replacement by available mine and scrap supplies. It might appear that leased gold could then have been returned to central banks during the 2012—2015 bear market, but again, Chinese and Indian demand continued to absorb most of the available physical released by any ETF sales and other sources of physical supply.
Alternatively, there would have to have been substantial selling of Western-owned stockpiles, and there is no evidence of that. The best one can say is that in some years, notably 2013, there was some ETF liquidation, but not in the quantities required to resolve the leasing problem. By way of confirmation, in 2014 I was told by one of the large Swiss refiners that they were working double shifts seven days a week turning 400-ounce LBMA bars into 1 kilo 9999 bars, the new Chinese standard. Some of the LBMA bars arrived in a poor condition and obviously had not been touched for decades, scraped out from the darkest recesses in deep-storage vaults. Furthermore, customers from the Middle East were submitting LBMA bars for refining into the new 1 kilo standard and taking them back to be re-vaulted in that form. Not only did this indicate that they were aligning themselves with China’s growing gold presence, but they were definitely not selling. Clearly, the 40% decline in the gold price between September 2011 and December 2015 led to substantial unrecorded increases in physical demand, cleaning out Western vaults. It would not have been possible for central banks to regain their leased gold.
There was, perhaps, further circumstantial evidence of the leasing problem, when Germany decided to withdraw her earmarked gold from the New York Fed’s vaults. The desire to do so was publicly justified on the basis that Germany’s gold no longer needed to be stored abroad, because the threat of a Soviet invasion had been removed by the collapse of communism. But given that the suppression of gold involved leasing and gold swaps in significant quantities in order to maintain the dollar’s credibility, was the true reason nothing to do with Soviet presence but that the Bundesbank suspected its gold was being used for this purpose without its permission?
The Bundesbank’s first action was to request to inspect its gold, a request that was flatly refused. Following that refusal, the decision was taken to begin a process of repatriation. Why it was partial is not entirely clear but could be explained if the Bundesbank suspected it wasn’t actually there. There would be nothing to be gained by demanding the return of all of it, but a partial return might at least enable the New York Fed to find some gold from elsewhere and avoid a public crisis. It turned out that after a series of meetings it was agreed to repatriate only 300 tonnes of Germany’s gold over a period of seven years. In fact, it was returned three years early. The Netherlands also sought, and obtained, 122.5 tonnes of her gold repatriated from New York. Austria arranged for the repatriation of some of its gold from London. While some of these repatriations were in the wake of public demands, they were never important enough to trigger them on their own. But they are consistent with substantial quantities being leased and assessments by the central banks repatriating national gold stocks that they are better secured on their own territory.
Since the days, as Veneroso put it, when central bank gold ended up adorning Asian women, leasing procedures, being targeted at providing liquidity and at supressing the gold price, will have changed. Wherever possible, leased gold need not leave the Bank of England’s or the New York Fed’s vaults. A ledger entry, or book entry transfer confirming it is at the disposal of the lessee is all that’s required, and for the payment for the sale of leased gold to be arranged through the appropriate channels. And from there it can be reassigned by another book entry transfer. We saw this in action when GLD, the gold ETF, ended up with the Bank of England recorded as a sub-custodian holding some 70 tonnes of gold last August precisely in these conditions.
In a leasing contract, ownership remains with the lessor. When arranging gold leasing, we can be sure that in recent times the Bank of England will have comforted lessors that their gold never leaves the Bank of England’s vault, so there’s no need to worry about repossession. This would be an operational justification for continuing leasing activities to offset physical shortages in the market. But the question over how much leased gold that has left the Bank of England and the New York Fed in the past remains unresolved, but it is likely to be in significant quantities with Veneroso’s lower estimate perhaps a bare minimum.
The true quantity of monetary gold
It is commonly stated that the above-ground gold stock is 200,000 tonnes. While that may be a reasonable approximation, most of it is not monetary gold in any sense of the definition and is not therefore its monetary supply.
The statist definition of monetary gold is physical bullion held as part of a central bank’s declared monetary reserves. According to the IMF the current total of all such monetary gold is 35,244 tonnes, though as we have seen from the foregoing paragraphs it is unlikely to be all there or unencumbered. But to this we must add gold bullion hoarded and stored by all other parties on the assumption that it is either a more stable store of monetary value than fiat or an insurance against fiat currencies losing purchasing power. It must be in a form immediately available for monetary purposes, being in bar or coin form. Of an estimated 200,000 tonnes of above ground gold, it is generally assumed that 60% is used for other purposes, mainly jewellery but also some industrial purposes, leaving 80,000 tonnes of monetary gold conforming with our definition. After subtracting official monetary gold from the total, we are left with 44,756 tonnes.
In October 2014 I published an article explaining why China had considerably more gold in storage than her declared reserves, and I estimated that by 2002, when the Chinese government removed the ban on personal ownership and opened the Shanghai Gold Exchange, the state could have acquired up to 25,000 tonnes. Much of this gold would have been leased gold sold into the London market. (Veneroso’s statement about ending up adorning Asian women could not have been true for Chinese women, because they were not permitted to own gold until 2002 and Indian imports were severely restricted for some of the relevant time).
That China had accumulated substantial undeclared bullion stocks was confirmed to me anecdotally by experienced China watchers. If we treat that as part of our estimate of monetary gold, and make an allowance for Russia, of perhaps an unrecorded 5,000 tonnes, monetary gold in the hands of everyone else appears to amount to only 15,000 tonnes.
But this figure will have been bolstered by central bank leasing activity, perhaps even doubled, with leased gold appearing to have two or even more owners, and the actual possession being in undeclared Asian hands. It is in this context that the threat to derivative trading from Basel 3 must be viewed. Not only will paper supply estimated at 11,300 tonnes equivalent in unregulated and regulated markets be threatened with removal, but there is an additional unknown figure of central bank leasing and swaps to be unwound. Obviously, there is significant guesswork involved, but if the numbers outlined herein have the slightest validity, the ending of gold derivative markets, if it is permitted to go ahead, will create a major gold crisis, of which the BIS regulators seem blissfully unaware.
Silver
The mechanics behind dealing in the LBMA silver market are the same as for unallocated gold. The LPMCL settlement system is the same, providing access only to LBMA members. The basis of calculating the net stable funding requirement is the same, so silver derivatives suffer from the same balance sheet disincentives. The principal difference is no silver is vaulted at the Bank of England, nor, so far as we are aware, in the vaults of any other Western central bank.
In terms of demand, it is also primarily an industrial metal, and is mostly consumed. According to the Silver Institute, of a total annual demand of roughly a billion ounces that is forecast in the current year, 253 million ounces is identified as investment demand and a further 150 million ounces as ETF/ETP demand. Bizarrely, the report estimates there will be a fall in ETF demand, when it is already rising. And of the supply, only 18.5% is from recycling.
The BIS figure for outstanding silver OTC derivatives is included in “Other precious metals” at $64bn. The same NSFR treatment for all commodity derivatives, including energy, involves an estimated $858bn’s worth. Not only is the introduction of the NSFR disruptive of precious metal markets, but it also threatens to disrupt wider commodities at a time when their prices are already increasing rapidly as a consequence of falling purchasing powers for fiat currencies.
The run is about to begin! :)
AG SQUEEZE ahead?!... Massiv short quote...
Huge day and we are only getting started. This SP will be laughable soon.
#AG: USA Producer Prices Surge Most On Record....!
April 2021 Producer Prices exploded 6.2% YoY
https://www.zerohedge.com/economics/us-producer-prices-surge-most-record
US Producer Prices Surge Most On Record
Tyler Durden's Photo
BY TYLER DURDEN
THURSDAY, MAY 13, 2021 - 08:37 AM
After consumer prices exploded higher yesterday - and were immediately rejected by establishment types as 'transitory', despite the market's obvious disagreement - all eyes were on this morning's producer prices for signs of more pressure. Many were fearful of a repeat of last month's debacle delay (and there were rumors of a softer PPI print leaked earlier today)
The rumors were wrong as April Producer Prices exploded 6.2% YoY (well ahead of the 5.8% expected) which was clearly impacted by the base effect of last year's collapse, but even sequentially, the PPI print was shockingly hot, rising 0.6% MoM (double the +0.3% expected). Excluding food and energy, so-called core PPI advanced even more, or 0.7%.
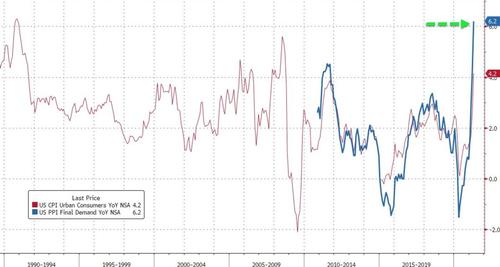
Source: Bloomberg
That was the biggest YoY jump on record:"There is more inflation coming,” Luca Zaramella, chief financial officer at Mondelez International Inc., said on the food and beverage maker’s April 27 earnings call.“The higher inflation will require some additional pricing and some additional productivities to offset the impact.”
jumped 0.7% from the prior month and increased 4.6% from a year earlier.
Michael Hsu, chief executive officer at consumer-product maker Kimberly-Clark Corp., said in April that the maker of Scott toilet paper and Huggies diapers is “moving rapidly especially with selling price increases to offset commodity headwinds.”
Digging below the surface further, ex-food, energy, and trade, producer prices soared 4.6% YoY, the most on record also.
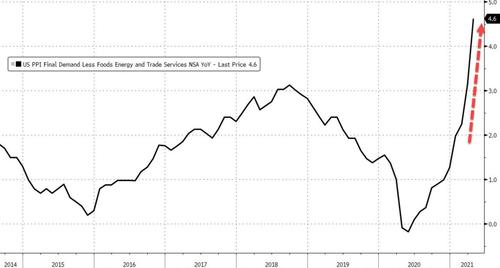
Source: Bloomberg
Some more details at the final demand level:
Final demand services: Prices for final demand services rose 0.6 percent in April, the fourth consecutive advance. Half of the broad-based increase in April is attributable to the index for final demand services less trade, transportation, and warehousing, which moved up 0.5 percent. Margins for final demand trade services also rose 0.5 percent, and the index for final demand transportation and warehousing services jumped 2.1 percent. (Trade indexes measure changes in margins received by wholesalers and retailers.)
Product detail: Within the index for final demand services in April, prices for portfolio management rose 1.5 percent. The indexes for airline passenger services; food retailing; fuels and lubricants retailing; physician care; and hardware, building materials, and supplies retailing also moved higher. Conversely, margins for machinery and vehicle wholesaling fell 5.6 percent. The indexes for apparel wholesaling and for securities brokerage, dealing, investment advice, and related services also declined.
Final demand goods: Prices for final demand goods climbed 0.6 percent in April, after rising 1.7 percent in March. Leading the April advance, the index for final demand goods less foods and energy increased 1.0 percent. Prices for final demand foods moved up 2.1 percent. In contrast, the index for final demand energy fell 2.4 percent.
Product detail: A major factor in the April increase in prices for final demand goods was the index for steel mill products, which jumped 18.4 percent. Prices for beef and veal, pork, residential natural gas, plastic resins and materials, and dairy products also moved higher. Conversely, the index for gasoline fell 3.4 percent. Prices for chicken eggs and for carbon steel scrap also declined.

Yesterday's data - which showed the strongest monthly gain in the overall consumer price index since 2009 - suggested companies are passing along at least some of the input-price inflation.. and today's PPI surge suggests that push through to CPI is far from over.
Not transitory.
Silver Futures 27.370 up 0.311 5/14/2021 7:49AM
I bet someone still knocks AG down at the open
Not sure, may be correct. See this short report:
AG short shares and short and short covering volume:
https://marketwirenews.com/stock/ag/short/
If the Hedge Fund that is shorting AG is Citadel, they came up with a new way of making money, they don't borrow shares to short, they just sell "air shares" fake share, invoices if you will.
https://cnafinance.com/amc-stock-manipulation-like-youve-never-seen-before/
I understand it's hard to believe, but there's the site and it's an interesting read.
Do you believe this number to be true,
Short Interest
(7.92% of float 04/15/21)
This is what TD Ameritrade is saying
200% Bullshit !!! Lolzzzz
#AG: HIGHER POWERS RUNNING THINGS HERE... $USD... LOSING GROUND AND SILVER GOES PROFIT TAKING...! STAIR STEPPING TO OPEN SKY'S...
Complete Bullshit News! lolzzzzz
Goldman Sachs, jp morgan, BofA, (c/o Fed), and hedgies
Yet, we are down $15.98 0.41 (2.50%)
Bunch of nonsense! Who's shorting AG?
Is this the same Panzer that didn't hold Hill 15 over on AMC. I had fun that day playing Patton. Good to see you here, I love AG.
Someone is playing with AG's share price, we get a nice earnings report and yet, we're down while SLV is up. Good sign to buy more AG!
#AG: Basel III Threatens to Break The Gold Derivative Market in June...!
https://goldsilverpros.com/2021/01/22/basel-iii-threatens-to-break-the-gold-derivative-market-in-june/
https://youtu.be/O4DeNbm1BNU?t=21
Taking profits from battlefields and put it right here man
Dude this CEO knows it ALL IN
Looking to load Massice Panzers here for 5-10+ years
captainscotty my man!!!
#AG: PM GOING MAINSTREAM...:-} $16.43
https://youtu.be/toGaARDgnjM?t=1400
#AG: SILVER GOING TO $300.....!
Is Silver Going to $300?
https://www.silverdoctors.com/silver/silver-news/is-silver-going-to-300/
There are some indicators worth examining…
by Peter Krauth via Streetwise Reports
I know this might sound ridiculous to some, but I think silver could reach $300.
No, I haven’t lost my mind. After all, it’s a metal that’s known for massive rallies.
You see, when silver went through its 1970s bull market, it started from a low of $1.31 in October 1971. By the time it reached its peak in 1980, silver had run all the way up to $49. That was a 37x return.
If we consider that silver was priced at $4.20 in late 2001, a 37x return would take it to about $155. However, I think this bull market could be an order of magnitude larger for a number of reasons, the main ones being debt, credit and money printing.
As a result, I think silver’s ultimate peak could be $300, and I won’t rule out possibly even higher.
Bullish Silver Fundamentals
Most developed and many developing nations have been in multi-year or even multi-decade deficit scenarios. This now looks to have become a permanent state, at least until we reach some sort of global financial reset.
The Institute of International Finance explains how the COVID-19 pandemic response added $24 trillion to the global debt mountain last year, to reach a new all-time record high of $281 trillion.
And interest rates being maintained at 5,000-year lows will only encourage more debt. Couple that with many countries borrowing to meet interest payments, and central banks soaking up much of that new sovereign debt, and inflation havens like precious metals gain strong appeal.
Silver in particular has the added benefit of 50% of its demand being industrial. With unprecedented economic stimulus programs, many favoring green energy, silver is uniquely positioned to profit. What’s more, according to Metals Focus, silver supply was down 4% in 2020 by 42 million ounces. According to the Silver Institute, total supply will rise by 8% this year, though total demand will rise nearly twice as much, by 15%, led by industrial, jewelry and physical demand.
So, the fundamental side of silver demand is looking strong, but the technical side is also very bullish.
Bullish Silver Technicals
Let’s consider the gold-silver ratio.
As a quick refresher, the gold-silver ratio is calculated by simply dividing the spot price for one gold ounce by the spot price of one silver ounce. That’s it. Naturally the higher the ratio, the more silver ounces are needed to buy one gold ounce, and vice versa. The most bullish scenario is when the ratio is falling from a high level, ideally from above 80, and the silver price is rising.
Here’s a chart of the gold silver ratio during the 1970s silver bull market.

To me it’s very intriguing to note how recessions, which are the grey vertical bars, tended to mark troughs and/or peaks in the ratio. What’s also interesting is that when silver reached its peak in 1980, the gold-silver ratio ultimately bottomed around the same time at a level near 15, which was below the starting point near 20.
Let’s now move to the current silver bull market that I believe began in 2001. The following chart shows us silver prices since 2000, not adjusted for inflation.

Of course, silver had a tremendous run from $4.20 in 2001 to its 2011 peak at $49. It then corrected until late 2015, then moved sideways until bottoming near $12 last year in March. It had a tremendous move up to $30 within just five months and has been mostly consolidating since.
Now let’s examine the gold-silver ratio action since 2001.

Again we see peaks and troughs tend to occur (though not exclusively) around recessions (gray bars). At silver’s peak in 2011, the ratio bottomed near 33. It then rose almost constantly up to its all-time peak last March at 125, then fell dramatically to its current level around 67, as silver started to significantly outpace gold. Consider that we know from history silver always outperforms gold in precious metals bull markets. So the current action is particularly exciting for silver.
Silver Targets
But what does it all mean for how high the silver price can go? Of course, no one knows for sure. But there are some indicators worth examining for clues and suggestions.
I believe the ratio will ultimately reach a low near 15. And given the inflationary path we’re on, I think gold could peak at $5,000 per ounce. That’s just 2.5 times last August’s peak near $2,000. In fact, I think there’s even a decent chance gold could reach $10,000, which is just five times last August’s peak. But if we stick with $5,000, and an ultimate bottom in the gold-silver ratio of 15, we get ($5,000/15) $333 per ounce of silver.
Let’s look at silver price targets from another angle: inflation.

If we consider inflation-adjusted silver prices going back to 1970, we see that the peak reached in 1980 was actually $120/ounce in today’s dollars, and that’s using government sanctioned inflation statistics, which tend to be well below what we experience in everyday life.
Considering the old way of calculating inflation, which the U.S. abandoned decades ago and I reference below from Shadowstats.com, a realistic inflation rate would have averaged 7%–8% since 1980 (triple official inflation), which would mean an equivalent silver price of $240–$360 dollars at the 1980 peak.
My gold-silver ratio target for silver of $333 is comfortably within the range of $240–$360. If we take the mid-way point between $240 and $360, we get $300. I think that’s as good an estimate as any of where silver can peak in its current bull market.
On this basis, the silver price would need to be up by more than 10x from current levels to reach its ultimate high. Imagine for a moment, if silver were to soar tenfold from here, what the silver producers’ and silver explorers’ share prices would do. It’s not difficult to expect simply spectacular returns. Which is exactly why it’s so attractive to allocate to this space, while being diversified across several stocks, as it’s impossible to know which will do best. Still, odds are very good that if silver goes up by a factor of 10, the average silver stock should easily double that, and be up by a factor of 20, while the most successful juniors could gain 50x or more. That would simply be a repeat of previous bull markets.
Larger silver producers and royalty companies should be seen as core positions to be held for the long term. The more junior explorers should be treated more cautiously as speculations, on which to take profits when they materialize. Selling half of one’s position on a double would be especially sensible.
In any case, I believe it remains early days for silver and silver stocks. I expect to see much higher prices ahead in the metal and the equities. And in my view the current bout of weakness is an opportunity to buy or add to positions in this space. Remember, at $26 silver is still nearly 50% below its all-time nominal high, while gold is just 10% below its all-time nominal high. Silver is clearly the better relative bargain.
In the Silver Stock Investor newsletter, I provide my outlook on which silver stocks have the best prospects as this bull market progresses. Many offer 5x to 10x return potential in just the next few years, especially as silver heats up.
I think silver is currently at or very close to its bottom, but that its ultimate peak could well be in the $300 range.
Either way, silver is headed much, much higher.
–Peter Krauth
Peter Krauth is a former portfolio adviser and a 20-year veteran of the resource market, with special expertise in precious metals, mining and energy stocks. He is editor of two newsletters to help investors profit from metal market opportunities: Silver Stock Investor, www.silverstockinvestor.com and Gold Resource Investor, www.goldresourceinvestor.com. In those letters Peter writes about what he is buying and selling; he takes no pay from companies for coverage. Peter has contributed numerous articles to Kitco.com, BNN Bloomberg, the Financial Post, Seeking Alpha, Streetwise Reports, Investing.com, TalkMarkets and Barchart, and he holds a Master of Business Administration from McGill University.
If only that gap filled, though.
No brainer here, hold and realize solid profits in the future.
#AG: First Majestic Reports First Quarter Financial Results, Inaugural Dividend Payment, and Appointment of VP Operations..:-}
https://www.firstmajestic.com/investors/dividends/
![]()
https://seekingalpha.com/pr/18304843-first-majestic-reports-first-quarter-financial-results-inaugural-dividend-payment-and
First Majestic Reports First Quarter Financial Results, Inaugural Dividend Payment, and Appointment of VP Operations
Vancouver, British Columbia--(Newsfile Corp. - May 6, 2021) - First Majestic Silver Corp. (AG) (TSX: FR) (the "Company" or "First Majestic") is pleased to announce the unaudited interim consolidated financial results of the Company for the first quarter ended March 31, 2021. The Company has also adjusted its cost reporting to reflect cash costs and all-in sustaining cost per ounce ("AISC") on a per silver equivalent ounce ("AgEq") basis compared to previous disclosure of only payable silver ounces. The full version of the financial statements and the management discussion and analysis can be viewed on the Company's website at www.firstmajestic.com or on SEDAR at www.sedar.com and on EDGAR at www.sec.gov. All amounts are in U.S. dollars unless stated otherwise.
FIRST QUARTER 2021 HIGHLIGHTS
Revenues totalled $100.5 million, or 17% higher compared to Q1 2020, including a record $4.8 million from silver coins and bullion sales from the Company's online retail store
Realized average silver price of $27.13, a 56% increase compared to Q1 2020
Cash costs increased to $12.61 per AgEq ounce, compared to $8.25 in Q1 2020, primarily due to higher ore development rates and mining contractor costs at Santa Elena to increase future production and higher energy costs at San Dimas
AISC increased to $19.35 per AgEq ounce, compared to $12.23 in Q1 2020
Mine operating earnings of $28.1 million, up 33% compared to Q1 2020
Net earnings of $1.9 million, compared to net earnings of ($32.4) million in Q1 2020
Adjusted EPS of $0.03 after excluding non-cash and non-recurring items
Cash flow per share was $0.14 per share (non-GAAP)
Strong working capital position of $232.8 million and total available liquidity of $297.8 million, including $65.0 million of undrawn revolving credit facility
Declared a cash dividend payment of $0.0045 per common share for the first quarter of 2021 for shareholders of record as of the close of business on May 17, 2021 and will be distributed on or about June 4, 2021
"Strong metal sales, robust silver prices and higher-than-normal premiums for coins and bullion generated healthy revenues, earnings and cash flows during the first quarter," stated Keith Neumeyer, President and CEO. "Due to the high demand for physical coins and bullion, our online retail store generated $4.8 million in silver sales during the quarter, or approximately 5% of our $101 million in total quarterly revenues, representing a new record in its 13-year online history. Furthermore, due to the current demand, the Company is working with numerous mints and refiners to direct as much silver sales as it can through its online store as possible."
Mr. Neumeyer continued, "At the mining units, capital investments are beginning to accelerate at Santa Elena's Ermitaño project as higher development rates are reached in order to prepare the new mine for initial production in early 2022. In addition, Santa Elena is expected to realize significant annualized cost savings of approximately $8 to $10 million starting in the second quarter as a result of its new LNG power plant. At the newly acquired Jerritt Canyon Gold Mine our operations team has begun the integration process and in the coming months ahead we expect to provide our operational plan and market guidance. Finally, I'm pleased to announce that our board of directors has approved the first-ever quarterly dividend payment which will be distributed to shareholders in early June."
OPERATIONAL AND FINANCIAL HIGHLIGHTS
NM - Not meaningful
(1) The Company reports non-GAAP measures which include cash costs per silver equivalent ounce produced, all-in sustaining cost per silver equivalent ounce produced, total production cost per tonne, average realized silver price per ounce sold, working capital, adjusted EPS and cash flow per share. These measures are widely used in the mining industry as a benchmark for performance, but do not have a standardized meaning and the methods used by the Company to calculate such measures may differ from methods used by other companies with similar descriptions. See "Non-GAAP Measures" on pages 25 to 30 30 of the Company's MD&A for further details of how these metrics are calculated by the Company together with for a reconciliation of non-GAAP to GAAP measures.
Q1 2021 FINANCIAL RESULTS
The Company realized an average silver price of $27.13 per ounce during the first quarter of 2021, representing a 56% increase compared to the first quarter of 2020 and a 9% increase compared to the prior quarter.
Revenues generated in the first quarter totaled $100.5 million compared to $86.1 million in the first quarter of 2020, primarily due to a 56% increase in average realized silver price, partially offset by a 24% decrease in silver equivalent ounces sold. First quarter revenues included a record receipt of $4.8 million from the sale of 146,827 ounces in silver coins and bullion at an average silver price of $32.65 per ounce, or a premium of approximately 24% above the quarterly spot price of $26.25 per ounce. Revenue from the sale of coins and bullion in the first quarter more than doubled over the prior year.
The Company reported mine operating earnings of $28.1 million representing a 33% increase compared to $21.1 million in the first quarter of 2020. The increase in mine operating earnings is primarily attributed to higher metal prices.
The Company reported net earnings of $1.9 million (EPS of $0.01) compared to net earnings of ($32.4) million (EPS of ($0.15)) in the first quarter of 2020. The increase in net earnings was primarily attributed to higher metal prices as well as a $22.7 million loss in the first quarter of 2020 related to mark-to-market adjustments on the Company's foreign currency derivatives.
Adjusted net earnings for the quarter was $7.0 million (Adjusted EPS of $0.03) compared to $8.2 million (Adjusted EPS of $0.04) in the first quarter of 2020, after excluding non-cash and non-recurring items.
Cash flow from operations before movements in working capital and income taxes in the quarter was $31.1 million ($0.14 per share) compared to $23.3 million ($0.11 per share) in the first quarter of 2020.
Cash and cash equivalents at March 31, 2021 was $201.7 million. In addition, the Company had strong working capital of $232.8 million and total available liquidity of $297.8 million, including $65.0 million of undrawn revolving credit facility.
OPERATIONAL HIGHLIGHTS
The table below represents the quarterly operating and cost parameters at each of the Company's three producing silver mines during the quarter.
Total production in the first quarter was 4.5 million silver equivalent ounces, consisting of 2.9 million ounces of silver and 23,873 ounces of gold, representing a decrease of 16% and 9%, respectively, compared to the Company's record setting production in the previous quarter.
COSTS AND CAPITAL EXPENDITURES
Cash cost for the quarter was $12.61 per silver equivalent ounce , compared to $10.21 per ounce in the previous quarter. The increase in cash costs were primarily due to higher ore development and mining contractor costs at Santa Elena in preparation of additional ore faces to increase future production, as well as higher energy costs at San Dimas as a result of lower energy contribution from the hydroelectric dam due to dry season, which forced the mine to rely on the public electricity grid and diesel generators.
AISC in the first quarter was $19.35 per ounce compared to $16.12 per ounce in the previous quarter. The increase in AISC was primarily attributed to the increase in cash costs and sustaining costs being divided by 17% less silver equivalent ounces produced combined with a 14% increase in mine development rates.
Total capital expenditures in the first quarter were $45.1 million, primarily consisting of $14.5 million at San Dimas, $14.3 million at Santa Elena (including $6.7 million towards the Ermitaño project), $2.7 million at La Encantada, $12.6 million for strategic projects and $0.9 million at non-producing properties.
Q1 2021 DIVIDEND ANNOUNCEMENT
The Company is pleased to announce that its Board of Directors has declared a cash dividend payment in the amount of $0.0045 per common share for the first quarter of 2021. Under the Company's dividend policy, the quarterly dividend per common share is targeted to equal approximately 1% of the Company's net quarterly revenues divided by the Company's then outstanding common shares.
The first quarter cash dividend will be paid to holders of record of First Majestic's common shares as of the close of business on May 17, 2021 and will be distributed on or about June 4, 2021.
The amount and distribution dates of future dividends remain at the discretion of the Board of Directors. This dividend qualifies as an 'eligible dividend' for Canadian income tax purposes. Dividends paid to shareholders outside Canada (non-resident investors) will be subject to Canadian non-resident withholding taxes.
APPOINTMENT OF VP OPERATIONS - MEXICO
The Company is pleased to announce the appointment of Colin Bower as Vice President of Operations - Mexico who will be responsible for all operational efforts at the Company's Mexican operations. Mr. Bower will report directly to Steve Holmes, COO, of First Majestic.
Mr. Bower is a seasoned mining professional with over 30 years of successful operational, technical and commercial management experience and is fluent in Spanish. He brings a diverse skillset to First Majestic through his experience with medium and large-scale global surface and underground mining operations where he has focused on value creation through Operational Excellence, Resource Expansion, Cultural Change and ESG all while maintaining a keen focus on safety. Colin's senior management experience includes Executive General Manager at Nevada Gold Mines and Barrick Nevada, General Manager at BHP's Cerro Colorado Mine and KGHM's Robinson Mine, Head of Non-Operated Joint Ventures at BHP Minerals Americas and Vice President Operations at the Sierra Gorda Mine in Chile.
ABOUT THE COMPANY
First Majestic is a publicly traded mining company focused on silver and gold production in Mexico and the United States and is aggressively pursuing the development of its existing mineral property assets. The Company presently owns and operates the San Dimas Silver/Gold Mine, the Santa Elena Silver/Gold Mine, the La Encantada Silver Mine and the Jerritt Canyon Gold Mine.
FOR FURTHER INFORMATION contact info@firstmajestic.com, visit our website at www.firstmajestic.com or call our toll-free number 1.866.529.2807.
FIRST MAJESTIC SILVER CORP.
"signed"
Keith Neumeyer, President & CEO
Cautionary Note Regarding Forward Looking Statements
This press release contains "forward-looking information" and "forward-looking statements" under applicable Canadian and U.S. securities laws (collectively, "forward-looking statements"). These statements relate to future events or the Company's future performance, business prospects or opportunities that are based on forecasts of future results, estimates of amounts not yet determinable and assumptions of management made in light of management's experience and perception of historical trends, current conditions and expected future developments. Forward-looking statements include, but are not limited to, statements with respect to: the Company's business strategy; future planning processes; commercial mining operations; cash flow; budgets; mine plans and mine life; costs of production; costs and timing of development at the Company's projects; capital projects and exploration activities and the possible results thereof; commencement of initial production at the Ermitano mine; and payment of dividends. Assumptions may prove to be incorrect and actual results may differ materially from those anticipated. Consequently, guidance cannot be guaranteed. As such, investors are cautioned not to place undue reliance upon guidance and forward-looking statements as there can be no assurance that the plans, assumptions or expectations upon which they are placed will occur. All statements other than statements of historical fact may be forward-looking statements. Statements concerning proven and probable mineral reserves and mineral resource estimates may also be deemed to constitute forward-looking statements to the extent that they involve estimates of the mineralization that will be encountered as and if the property is developed, and in the case of measured and indicated mineral resources or proven and probable mineral reserves, such statements reflect the conclusion based on certain assumptions that the mineral deposit can be economically exploited. Any statements that express or involve discussions with respect to predictions, expectations, beliefs, plans, projections, objectives or future events or performance (often, but not always, using words or phrases such as "seek", "anticipate", "plan", "continue", "estimate", "expect", "may", "will", "project", "predict", "forecast", "potential", "target", "intend", "could", "might", "should", "believe" and similar expressions) are not statements of historical fact and may be "forward-looking statements".
Actual results may vary from forward-looking statements. Forward-looking statements are subject to known and unknown risks, uncertainties and other factors that may cause actual results to materially differ from those expressed or implied by such forward-looking statements, including but not limited to: the duration and effects of the coronavirus and COVID-19, and any other pandemics on our operations and workforce, and the effects on global economies and society, risks related to the integration of acquisitions; actual results of exploration activities; conclusions of economic evaluations; changes in project parameters as plans continue to be refined; commodity prices; variations in ore reserves, grade or recovery rates; actual performance of plant, equipment or processes relative to specifications and expectations; accidents; labour relations; relations with local communities; changes in national or local governments; changes in applicable legislation or application thereof; delays in obtaining approvals or financing or in the completion of development or construction activities; exchange rate fluctuations; requirements for additional capital; government regulation; environmental risks; reclamation expenses; outcomes of pending litigation; limitations on insurance coverage as well as those factors discussed in the section entitled "Description of the Business - Risk Factors" in the Company's most recent Annual Information Form, available on www.sedar.com, and Form 40-F on file with the United States Securities and Exchange Commission in Washington, D.C. Although First Majestic has attempted to identify important factors that could cause actual results to differ materially from those contained in forward-looking statements, there may be other factors that cause results not to be as anticipated, estimated or intended.
The Company believes that the expectations reflected in these forward-looking statements are reasonable, but no assurance can be given that these expectations will prove to be correct and such forward-looking statements included herein should not be unduly relied upon. These statements speak only as of the date hereof. The Company does not intend, and does not assume any obligation, to update these forward-looking statements, except as required by applicable laws.
Congrats on great earnings report, Cheers
#AG: LOOKING GOOD...:-} $14 DOUBLE BOTTOM...!
https://stockcharts.com/c-sc/sc?s=AG&p=D&b=5&g=0&i=t8201280465c&r=1620298105118
|
Followers
|
144
|
Posters
|
|
|
Posts (Today)
|
0
|
Posts (Total)
|
2507
|
|
Created
|
11/12/09
|
Type
|
Free
|
| Moderators | |||

| Volume | |
| Day Range: | |
| Bid Price | |
| Ask Price | |
| Last Trade Time: |