 News
News  Market Data
  Discover
Support: 888-992-3836
Copyright © 2023 InvestorsHub Inc.


Register for free to join our community of investors and share your ideas. You will also get access to streaming quotes, interactive charts, trades, portfolio, live options flow and more tools.
The easiest way to get back in sync with the sheet is to change the starting "SHARES HELD" until it matches the current shares you actually own. (Change the top cell until the last cell in the column matches your current holdings).
Changing this metric does not effect any of the other parameters that affect ROI.
I have done this on multiple occasions with my 4 hour sheets.
Hey Alex....I'm feeling a bit better but still not out of the woods so I'll try to answer some of your questions.
I just gave your Tezos sheets a quick glance. Very nice results! I've done the experiments you have been doing many times in the past which is why I have a very high confidence in the program. I just wish you came along earlier and I had your improvements back then....lol. Even without them though the system has proven itself time and again.
I like to check optimizations every 2 to 3 weeks or so (on daily data), every week or so on my 4 hour charts. There is no hard and fast rule on these time frames so I'm not sure if these time frames are best, but it seems to work for me. I always want to make sure my signals are optimal for the current trend and make sure they have been adjusted if a trend change has occurred. Trend changes are easy enough to spot using the charts we have on the sheets but you never know if the trend change is gonna stick or just go back to the original trend in whipsaw like fashion. Frequent optimization checks help either way.
Do you re-optimised over an (expanding) full length of data when you trade?
Do you re-start a new chart using 3 months (or 2 x buy or sell signals) at some point?
Have you observed whether it is better to use longer strips of data?
3 months of data (daily sheets) is plenty of time to fully optimize any play. I will usually start with that then continue to use that sheet for around 6 months. After 6 months of the same sheet I will begin to think about cutting it back to 3 months again. I haven't found that the additional data is necessary to keep achieving high quality signals as long as you maintain 3 months of data or better.
Hi Myst,
I hope you will be feeling better soon.
I have shared two charts of Tezoz (XTZ) starting 14 6 20.
In the first, I optimised 15 9 20, using 3 months of data and then walked forward month by month without re-optimising the settings to see how well XDEV would continue to do in a scenario in which no further amendments were made to the settings.
It is reassuring to see a continued out-performance versus buy & hold using the initial XDEV settings, from using 3 months of data. XDEV performed well even when the settings were not changed.
In the 2nd sheet, I re-optimised the settings on 31 12 21 utilising the full strip of data back to 14 6 20.
Although the results in the first un-optimised play are impressive, the re-optimised results are more incredible still.
The question is whether re-optimising every month (or making small incremental changes weekly) brings one to this end result slowly over time?
I will, perhaps, try to do the same “walk forward” experiment again, this time re-calibrating the settings each month using the data from the months before.
Do you re-optimised over an (expanding) full length of data when you trade?
Do you re-start a new chart using 3 months (or 2 x buy or sell signals) at some point?
Have you observed whether it is better to use longer strips of data?
Kind regards,
Alex
Hi Myst,
I have shared a MARA sheet in which I tried an alternative approach.
Since you have more firsthand experience in the problems you encounter trading XDEV, you will be able to share what you think is useful.
Instead of calculating the size of the BUY or SELL % as a % of the Portfolio Value, I tried turning the $ values in the BUY Forecast and SELL Forecast columns into a % of Stock Value.
The Market Order is not always exactly what turns out to be traded as the BUY signal in the Market Order column sometimes exceeds the CASH VALUE available for a BUY.
I thought sizing relative to Stock Value might be easier to follow. If the STOCK you hold is different to what is shown in the spreadsheet then you will simply BUY or SELL a % relative to that amount of STOCK.
The question of how much stock to hold in the first place is one we will do more work to try and answer, perhaps calculating a maximum % of the total trading account and perhaps with reference, to the Zone % idea you discussed previously.
I would love to hear your thoughts on how and when to bring an investment inline with the $ value shown on the sheet, or, whether, in your experience, it is necessary at all. In particular, after a re-optimisation, as it is after a re-optimisation that the numbers can sometimes on the sheet indicating one's exposure can dramatically change.
Best regards,
Alex
Hi Myst,
I hope you are feeling better soon.
Further to this earlier message I shared another YINN sheet, the same as the previous version except that I added to the SELL Forecast formula so that it never forecasts a SELL larger than the actual current holding of STOCK shown in Stock Value - Column "V". There may be pros and cons to this. We'll see.
Best regards,
Alex
Hi Myst,
Sorry to hear you feel poorly. Get well soon!
Alex
Alex....I just caught the flu and feel like pooh 
I may be out of commission the next few days. I will answer your questions as soon as I am able.
Hi Myst,
I have shared a sheet for YINN. Like LINK, which has gone down 50% in the period covered in your 4-hour sheet, this play has gone down about 60% in the period covered by the sheet. The optimisation is quite strange. I suppose because the daily data is less granular than the information you are trading on the 4-hour sheet. All the money in this optimisation was made in one trade taken in 27 July 2021. I am not sure if it would be successful going forward. Have you traded assets in a downtrend successfully in the past? Perhaps, if you don’t mind, you could optimise the sheet yourself and share the results?
Kind regards,
Alex
Hi Myst,
Did you get the BUY and SELL forecast to work?
The 4-hour sheet you sent me still did not seem to show the correct numbers.
Alex
Hi Myst
Thank you for the 4 hour LINK sheet.
I think you are trying the 4-hour time frame for the first time. Are you proposing to trade the LINK chart with the 4 hour timeframe going forward?
Optimisations for assets in a downtrend seem to be different to optimisations in an uptrend. Are there any observations you want to share?
Have you traded assets in a pronounced downtrend like this with XDEV before and achieved similar results? I'd be interested to hear if you have had similar results in the past.
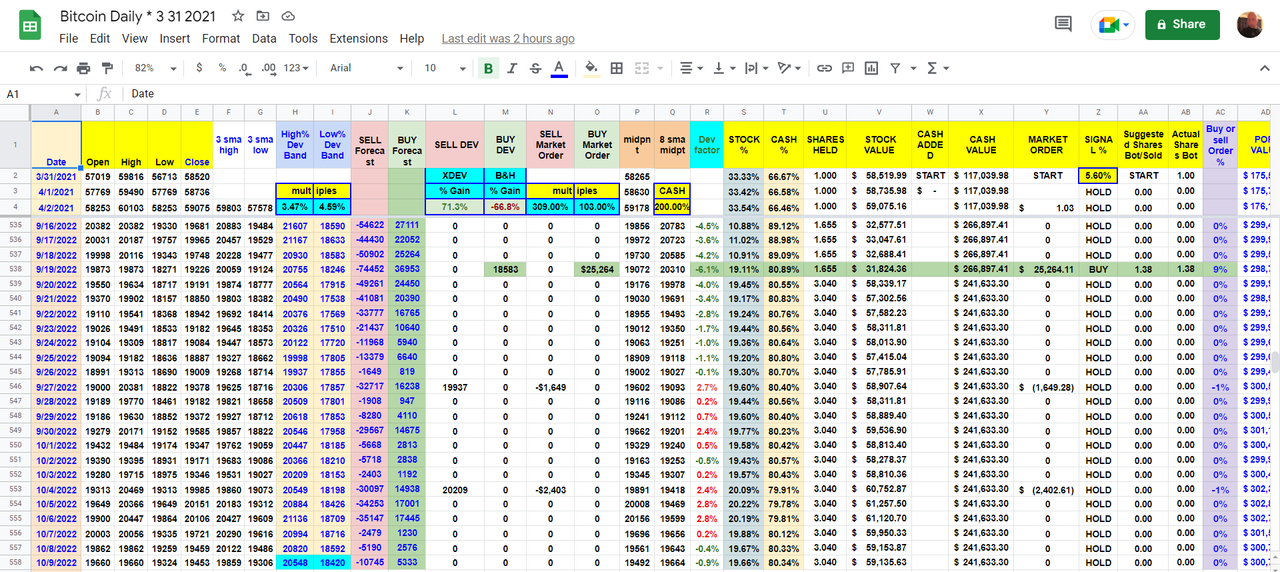
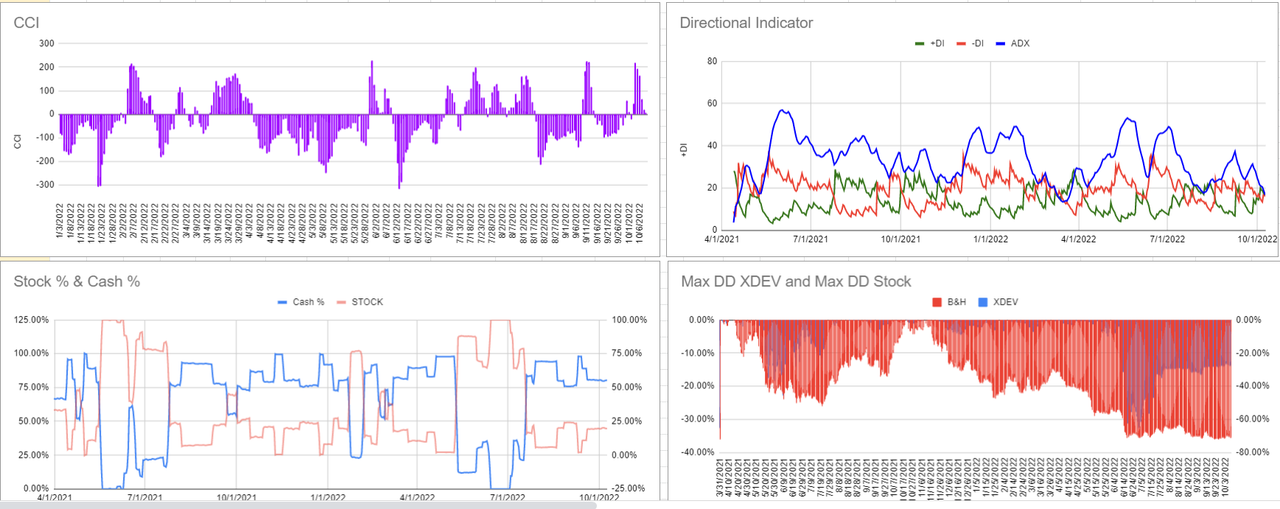
With regards to the 2 drawdown column... On each row, for both XDEV and B&H, the column calculates how much the equity curve is in drawdown since your last high. Whenever you see a 0% (in black) it means your equity curve is back at all time highs or above. This allows for comparisons between XDEV and B&H in terms of depth of drawdown and of duration of drawdown. It is interesting to compare the timing and depth of XDEV and B&H drawdowns.
The top 2 cells show the MAX drawdown experienced over the period modelled in the sheet. The calculation in the cell simply looks through all the data below and finds the largest negative value (in other words biggest drawdown) and this is shown at the top of the column.
For example, in your 4-hour LINK sheet, if you look through the column below, you will see XDEV experienced a MDD (Max Drawdown) of -9.13% and B&H experienced a MDD of -51.87% over the same period.
Dividing the Profits (or losses) modelled in a sheet by the MDD during the same period allows us to calculate a reward to risk ratio and get a sense of the reward received for risk taken and make comparisons between assets in terms of reward to risk, rather than, simply return. This ratio is calculated in cells J7 and K7. This allows us to compare XDEV to B&H, but the ratios may also allow us to compare XDEV's performance across different assets.
As stated above, in itself, it is interesting to compare the timing and depth of XDEV and B&H drawdowns. I also wonder whether the Reward to Risk Ratios will help us in our optimisations to see when an optimisation is "good enough", or, when it is "under-optimised" or "over-optimised", i.e. curve-fitted. Maybe helping us find parameters that are "good enough" and robust and therefore will be effective going forward.
I read this comment online, which is why I included it. I quote, "The other factor I always like to look at is the profit/drawdown ratio. If this is anywhere near 1 [then] I see this as not a good strategy. This indicates that the risk and return are essentially equal, and if you have ended up ahead it is probably due to luck, not by your strategy having a statistical edge. If it is too high (say > 4) then I start to wonder whether it is over-optimised. The drawdown also provides a good guide for the expected future strategy performance, if in real use the strategy exceeds your expected drawdown it may be time to switch it off." https://www.forexfactory.com/showthread.php?t=263380
I am not sure how fruitful the ratio will be. It will be interesting to see if there is some correlation between this metric and other metrics that might indicate when an optimisation is "good enough".
I think your preferred metric is checking whether BUY or SELL signals occur at "extreme" moves in the DEV factor.
Alex
Hi Myst,
This is really helpful. The situation of my numbers not looking like the sheet exactly is already something I have across. For example, after re-optimising a sheet.
The question is what to do then? Do you have any tried and tested answers?
How do you try and get back into balance with what the sheet is proposing?
Alex
I added the Buy or Sell % column to your Bitcoin 4 hour sheet. (Column AC)
That way if for some reason your numbers don't match the sheet exactly you will still know exactly what % of your portfolio should be used for a buy or a sell.
Nevermind.....I just figured it out. I had the wrong cell number referenced. All fixed!
When I plug the Buy and Sell forecast into my 4 hour Bitcoin sheet I am not getting the correct numbers.
Not sure why.
I'll send you the sheet. Take a look when you have time.
No rush....thanks,
Nevermind.....I just figured it out. I had the wrong cell number referenced. All fixed!
When I plug the Buy and Sell forecast into my 4 hour Bitcoin sheet I am not getting the correct numbers.
Not sure why.
I'll send you the sheet. Take a look when you have time.
No rush....thanks,
I have a 4 hour LINK sheet I am going to share with you shortly.
Quick question....still trying to wrap my head around the Draw down columns. How do you arrive at the top 2 cell figures in those two columns? What do they mean?
Disregard the yellow shading in those cells you mentioned. It doesn't mean anything. I just forgot to change them to the same as the rest.
Hi Myst,
It is my pleasure.
I’ll check out the improvement in ROI’s on both.
I am gratified to hear you think we have improved the sheets and I am grateful to hear you think they are honing in on what your vision for X_DEV was meant to be.
I am sure we'll share many more insights.
I look forward to trading them with you!
Alex
Hi Myst,
I received the MSTR and 4-hour BTC and ETH 4-hour sheets. Thank you.
With regards the BTC and ETH 4-hour sheets:
See below:

If you look at the formula in J5, you'll see I multiplied 365 * 6. This is the number of 4-hour periods there are per day. I.e. 365 x 6 to annualise the period return. Doing this gives the correct Annualised Return in J5. In your ETH sheet 253.62% per annum.
The number "3.98" in J7 is a ratio, not a percentage, calculated by dividing the Profit / Loss by the Max Drawdown to express the reward in terms of risk taken, where risk is defined as max drawdown. In the ETH sheet 22.79% (PROFIT) / 5.73% (MDD) = 3.98. Showing a return of 3.98 x the risk during the period.
Is that clear?
I notice some of the 4-hour periods are coloured a darker yellow. Why is this?
Alex
Well done Alex!
Now it's just like the program.
Yea, that is a pretty complicated formula! lol
Did you receive my sheets? MSTR, BTC and Ethereum?
Hi Myst,
I have shared another iteration of the ETH sheet with you in which I have now added BUY Forecast and SELL Forecast columns.
I think I have managed to calculate BUY Forecasts which allow us to set limit orders in advance and incorporate actual CASH VALUE at the time. It was a little complicated.
You will see how, from time to time, the BUY Forecast will seem to be different to the BUY Market Order in column “O”. This is because the value shown in the BUY Forecast Column takes into account the CASH VALUE available at the time, so the value shown in the BUY Forecast column is actually equal to the CASH VALUE column available at the time in instances where the BUY Market Order suggested is greater than actual CASH VALUE. In these instances, the BUY forecast simply equals remaining CASH VALUE. (This works out to equal the amount shown in the next day’s Suggest Shares Bot/Sold column.) When we have run out of CASH and are 100% invested the BUY Forecast column simply shows $0.
Take a look.
Best regards,
Alex
One change I forgot to make on your sheets....
I color code the dev factor. Red for positive numbers which are generally sells and green for negative numbers which are generally buys.
Makes it easier to see if the larger numbers are being hit for signals which adds confidence that the parameters are optimized correctly.
If you want to make that change it's entirely up to you.
I've sent you my 4 hour sheets of Ethereum and Bitcoin.
I've seen incredible improvement in ROI's on both!
I think we have really improved the sheets greatly with your new insights and formula's.
They are feeling like they are honing in on what my vision for X_DEV was always meant to be. For that I am extremely grateful for your efforts!
Looking forward to trading these sheets in the new year!
X_DEV - MSTR
In just over 8 months, the MSTR stock decreased by -11.1%. By using X_DEV you would have managed a +69.2% return. That's a difference of +80.3% !
X_DEV +69.2% vs -11.1% for Buy & Hold
Current settings for those I gave the sheet to:


Alex, I've just sent you my MSTR sheet with all of the updates.
The new formulas added +28% to the ROI!
I'll have to post the data in another post so any viewers that stop by can check it out.
Thanks again,
Really nice job Alex!
Thanks a bunch! Excited to try all the new formulas on my sheets. I'll share as soon as ready.
Hi Myst,
I have shared an ETH sheet with you that incorporates a new formula in the Shares Bot column. Take a look.
Doing this turned out to be a bit complicated. I also had to adjust the formula in the CASH VALUE column - column "V".
Previously, the CASH VALUE column also linked to the CLOSE column - column "E".
Now, the formula in the CASH VALUE column adds or subtracts from the CASH VALUE based on the correct BUY or SELL amount. Take a look.
In the ETH sheet I have shared with you, by correcting the CASH VALUE calculation from row to row, there is a dramatic performance improvement. I have yet to test this on other plays.
Experiment with the sheet and please confirm this is the case as well.
Aside from the above, the sheet includes your most recent SELL Market Order and BUY Market Order formulas.
The sheet also incorporates the “1-day lag” version of the formulas in the SELL Market Order and BUY Market Order columns. In other words, following the way XDEV is designed to work, it uses the previous day's XDEV factor in order to allow limit orders to be set in advance.
The above is certainly progress. However, at this stage, we still lack the functionality to set Limit Orders in advance.
We need to replicated the following on the sheet:

As shown in the picture, each row will have to show the amount to BUY and SELL, covering both eventualities in advance, to allow us to set limits orders.
I will try and add 2 new columns to the sheet and title them BUY Forecast and SELL Forecast and have them show the BUY or SELL amounts to set as limit orders.
Entering the OHLC information into the spreadsheet the next day will confirm which of the two options was hit - or none at all - and the existing calculations on the sheet will update the sheet in the usual way.
However, as in the picture above, we need to calculate both options in advance in each row in order to set limit orders in advance.
Kind regards,
Alex
Whether the results improve or not, it is the way the system should work so please send me a sheet with the new formulas as soon as you can. I'd like to work with those as I optimize my other sheets.
The 1 day lag is also the way the system is designed to work so I have made that change permanent. So far the results have been mostly positive.
Thanks for your patience!
Hi Myst,
It is not at all clear it will improve the results, but logically, sure, it needs to be changed. I’ll update the formulas to reflect the change.
I am look forward to feedback from you as to whether the “1-day lag” version of the spreadsheet is working for you.
I think it is good that both of us carry out the amendments and compare the result. The outcome is more likely to be objective. Two heads are better than one!
No need to apologise for the delay. I understand it is Christmas.
Just update me as soon as you are satisfied with your results.
Alex
Right again!
Wow....great catch! I originally brought that formula over from my AIM sheet, which is why I missed it. AIM uses the close price and not the highs and lows, which is an XDEV advantage over AIM.
Now I have to revise the sheets yet again.
Apologies for the delay in getting my sheets to you. Been busy with the holiday stuff plus I am experimenting with different time frames other than the 4 hour sheets I told you about. As soon as I am satisfied with my results I will certainly share them with you.
In the meantime maybe it would be better if you updated the formula's to reflect the change you just mentioned, since you are far superior to me in spreadsheet wizardry.
Hi Myst,
I was looking at the XDEV sheet and thought the following: In the Suggested Shares Bot / Sold column “Y” shouldn’t the formula divide the Market Order in column “W” by the either the HIGH % BAND column “H” or LOW % BAND in column “I” rather than the CLOSE price in column “E” since we are ideally executing our trades by limit order at the HIGH % BAND and LOW % BAND prices and not the CLOSE price?
Best regards,
Alex
Hi Myst,
Thanks. I look forward to it.
Yes,..... XDEV would have been given the chance to buy the dip and sell higher during the smaller up and down movements that took place mid to late May before the price steadily turned down.
Lately I have been using just my 4 hour sheets. Not sure you would be interested in those so I will spend some time updating my daily sheets with the new innovations. I will send those to you later today....hopefully.
Hi Myst,
I am only now beginning to be able to get a feel for what matters in the question of starting CASH.
Can I ask a simple question first:
Say, you started your play, somewhere mid-May, where price was in line with the red moving average, with 45%-50% of the capital you usually allocate for each play.
Price then drops to the 75%-80% zone.
It did not do this immediately. Am I right to think that XDEV would have been given the chance to buy the dip and sell higher during the smaller up and down movements that took place mid to late May before the price steadily turned down?
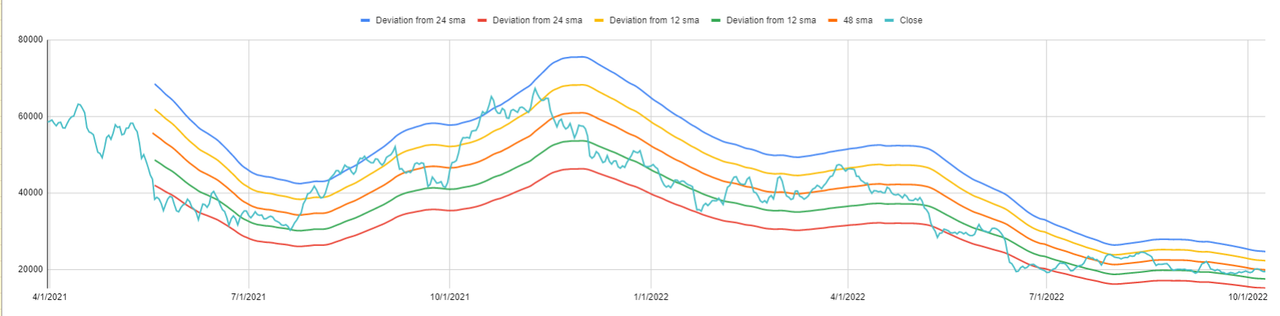
I think you sent me a spreadsheet where you had incorporated this longer-term 48 sma. Have you been able to observe its interaction with the allocations that XDEV is indicating, over time? I would be very interested to explore the interplay of the two.
Is there a latest sheet incorporating this you can send me?
Best regards,
Alex
I have received all your posts here. I am unsure why some of them were deleted...odd!
I have used your "lagged" formula on all my sheets for consistency as most have shown better ROI's by using it. So congrats for another great innovation! I will be sharing those with you later this evening.
As for your other queries....it all depends how you want to use the system. I've used it everyway imaginable over the years....lol! I've found that the easiest method is using it in the strictest sense and following it's signals as closely as possible. With our new "lagged" method you can set your limit orders, sit back and relax. Is it possible the play will continue to pump after your limit order has triggered...sure. But I've found that the next day's price even exceeded the preceding days high on many occasions. (That is when I was trading stocks) With crypto, the 24/7 trading makes a difference. Even though most data feeds use UTC time zone to start and end a 24 hour cycle, crypto doesn't adhere to any particular daily cycle.
So if you feel strongly about a particular play and feel you are in tune with it's trading pattern and feel you have a grasp on the technicals that suggest another trade may be beneficial, then by all means go for it. X_DEV is great at identifying price highs and lows and range highs and lows so you can feel confident in the trade.
As far as entering data, if it's multiple trades on the same day you could simply average them out and input the average price you entered or exited. I've done this also.
CELO is doing great! Nice play!

Hi Myst,
CELO is on a tear today, which leads to the following question:
Assuming I am using the XDEV “Original” sheet and not the “1-day lagged” version.
I have HIGH % and LOW % price levels indicated the day before, in the morning CELO hits the HIGH % price level, setting off a price alert. I open the sheet and input the OHLC information current at the time and, in this case, sell some CELO.
Entering the OHLC information generates the new HIGH % and LOW % Dev band price levels.
Now, imagine CELO continues to rise during the day - the markets are still open, after all - and imagine CELO hits the next HIGH % band the same day.
Have you come across such a situation before?
I thought I might add in another row of data and give it the same day’s date and a letter, e.g. “22 12 21 A”, essentially entering in more than one row of information for the same day.
As a result I would enter two rows of information for the same day and take two trades the same day.
Is this something you have ever done when assets are in an extreme pump?
Alex
Hi Myst,
My responses yesterday to your messages are no longer showing on the message board today.
Has that ever happened to you?
To make our understanding explicit, we are exploring the possibility of a "1-day lag" XDEV sheet, which might allow for limit orders set in advance.
I was ready to accept that trading XDEV means using a combination of XDEV band price levels determined a day in advance and trades which are sized in "real time"by inputting OHLC data when a price level is hit during the day. This would effectively mean XDEV is a trading system that uses a combination of price alerts set in advance and some real time "live trading" and no limit orders set in advance.
However, your comments indicated that you think it could be worth investigating the XDEV program using "1-day lagged" data, using the XDEV factor from the previous day to size trades, which might allow trades to be set as limit orders a day in advance.
I look forward to seeing the results of your experiments.
Best regards,
Alex
I'll share them with you as soon as I have them ready.

It is already in shared status. Just pull up google sheets and it should be there.
I have revised the sheet below and included the fix. Take a look when you can.
XDEV - CELO - DAILY - 14 5 21 - PRESENT - Amended DEV Factor - RL
I've fixed the positive /negative values issue in the buy and sell market order columns. Simple change in the formula was all it took. I'll send over a sheet when I'm done optimizing. I've tried your "1 day lag" sample on 5 of my plays and the results were encouraging. I may have to alter my initial reaction. Going to try a few more examples now that I have the issue mentioned above fixed.
Again, I don't think it wise to use the previous period dev factor....or the "one day lag" option. To do that is bending the algorithm out of optimal performance. Yes, it will still work, but "sub-optimally". The dev factor is calculated by using the current high and low price for the daily midpoint. Then using the 3 day average of midpoints divided by the current days midpoint you get the dev factor. So the current days data is a necessity. The interplay between the dev factor and the portfolio value is the key component to X_DEV. Much like the "Safe" and "Portfolio Control" metrics are key to AIM. I'm not exactly sure of the metrics used by my programmer for the X_DEV program that allows for the buy and sell forecast functions. All of his coding wizzardry was accomplished by him alone as I had no coding experience.
I'll see if I can contact him for his input.
Hi Myst,
I am concentrating on daily spreadsheets currently.
Do you know how the XDEV program generates its “buy forecast” and “sell forecast”?
To recap:
The XDEV sheet uses 3 sma price information and the XDEV multiple to generate the HIGH % and LOW % DEV bands to “forecast” the price levels at which to trade the next day. This is historical data.
The question we are asking is how best to generate the amount to BUY or SELL?
Currently, the amount to BUY or SELL is calculated with reference to prices inputted the same / or next day.
While the levels at which to BUY or SELL are “forecast” or forward-looking, the amount to BUY or SELL are calculated with reference to information in the spreadsheet that is current and is generated in “real time”.
As you understood, this makes it impossible to input BUY or SELL orders in advance.
You say you are nearly always at home when you trade. Can you say what that looks like?
Does that mean that you are watching the price and if the price reaches either the HIGH % or LOW % band targets you enter the (current) OHLC information into the sheet to generate a BUY or SELL amount?
Does that mean you will in instances have to enter current / ongoing OHLC information before the end of the trading day?
This is fine, as you say, but means you have to be watching the charts to enter the current OHLC price information into the sheet, which cannot be done in advance.
However, doing this means the amount you buy or sell will be calculated using the most up to date price information.
It seems that the “cost” if we want to set limit orders the day before is that we have to also quantify the amount to BUY or SELL using data from the day before.
Let me know what you think after you have have given thought to incorporating that feature back into the spreadsheet.
You say: “Use the high or low from the period before to let it forecast the buy or sell amounts.”
In terms of the spreadsheet this means changing the formula in the BUY Market Order column from:
=IF(D10<I9,ABS(AA9*P10)-$M$4*(AA9*P10),”0”)
to:
=IF(D10<I9,ABS(AA9*P9)-$M$4*(AA9*P9),"0")
and changing the formula in the SELL Market Order column from:
=IF(C10>H9,(ABS(AA9*P10)*-1)-(AA9*P10)*$L$4,"0")
to:
=IF(C10>H9,(ABS(AA9*P9)*-1)-(AA9*P9)*$L$4,"0")
Essentially, this introduces the one day lag.
I have shared a sheet with the change above. The results are still good. No doubt you will have a better grasp of the drawbacks of doing this.
I can send over another sheet with the same changes if you want to work on a specific play.
Best regards,
Alex
Ok...now I see the issue. I hadn't considered it before because the program, as you can see from the screenshot below, has the "buy forecast" and "sell forecast" feature which tells you the amounts to buy or sell in advance.

I'll need to give some thought to incorporating that feature back into the spreadsheet. Since I am nearly always home when I trade I have the benefit of not needing to place trades in advance. I can input the figures into the sheet and let it tell me the amounts in real time. I only use daily and 4 hour spreadsheets so I don't have the same issue as one that uses weekly or monthly data.
Until I have figured it out you can just input current data into the sheet and use the high or low from the period before to let it forecast the buy or sell amounts. It may not be exact but it will be close enough. I wouldn't use the previous periods XDEV factor. It would be more accurate to use current data especially if you are working with weekly or monthly sheets.
Hi Myst,
In the example shown in the screen shot, the question, then, I suppose, is should we not use the DEV factor of 10.2% from the 7 12 21 rather than the DEV factor of 8% shown 8 12 21?
Unless I am mistaken, currently, the DEV factor is calculated using price information relating to data on the same row. This information would not have been know the day before.
The amount bought or sold would need to be calculated with reference to the DEV factor from day before.
So, if I were to place limit orders in advance at the price levels indicated by the HIGH % and LOW % Dev Bands on the 7 12 21 - i.e. $175.74 and $139.66 - I would have to use the DEV factor from the same row, in this case, 8%.
Best regards,
Alex
Yes…. On the last column ( column V) on Aimagic MSTR sheet I have the % buy or sell portfolio value calculation
Look 2 columns over in the “sell market order” column. If you are using the same amounts in the spreadsheet then you would have sold $6466.66.
However I also have a column (I think column AE) on the XDEV sheets that calculate the % buy or sell of your portfolio value. So if the dollar amount you have differs from the sheet you will still know how much to buy or sell.
This could be incorporated in the Aimagic sheets as well. Not at my computer now so I’m not sure if I have done this already.
Hi Myst,
Oh wow. I have definitely been reading the spreadsheet wrong. That makes all the difference! LOL
I see now how 7 12 21, the High % DEV BAND indicated $175.74, which would allow me to enter this price as a SELL LIMIT ORDER in advance.
I could do the same for a BUY Limit Order using the Low % DEV BAND price indicated as well.
Now, forgive my asking a really stupid question, but where, then, is the size of each LIMIT ORDER also indicated in advance please?
Alex
Sorry for the delay in response....I was traveling the last few days.
The sell target of $175.74 was reached on 8/12 which means if your limit order was in place as indicated on 7/12 you would have sold.
I think you are misreading the spreadsheet signals. The sheet gives you the targets in advance....not for "the day after".
Does this clarify the situation?
Hi Myst,

This screenshot comes from an NRGU play.
8 / 12 / 21, the close was 170.81 and updating the spreadsheet indicated selling almost all STOCK at a price of $175.74 the next day.
However, the next day, that target was never reached and has still not been reached so you never got the opportunity to sell at the price indicated on the sheet.
There have been 2 BUY signals since then, as you can see. If you had set a limit order to SELL or were waiting for the price indicated on the sheet to SELL, you would be unable to follow the trades on the sheet. Effectively, 100% exposed, waiting for the opportunity to sell.
Have you come across this kind of situation?
Kind regards,
Alex
“The greatest shortcoming of the human race is our inability to understand the exponential function.”
-Albert A. Bartlett-
A good trader can achieve good returns following a good system.
An exceptional trader can achieve exponential returns following a good system that has been optimized.
Compounding gains by buying low and selling high in partial amounts is the best way to achieve exceptional returns over time and can lead to financial freedom/independence.
Below is the X_DEV program. It is an algorithmic trading system (similar to A.I.M.) that automatically finds the best buy and sell targets of any stock, index, mutual fund, or cryptocurrency and also recommends the amount of money to buy or sell based on your initial investment, usually in partial amounts. It will also list (in advance) the next best buy or sell opportunity based on the parameters the user sets up. This is not a "blackbox", set it and forget it system. It is meant to be an interactive, adaptible system utilizing sound mathematical principles and the users trading/investing experience. It is my belief that this type of symbiotic relationship is the best possible method for achieving much better returns than is otherwise possible.
The X_DEV Program - (Bitcoin below)
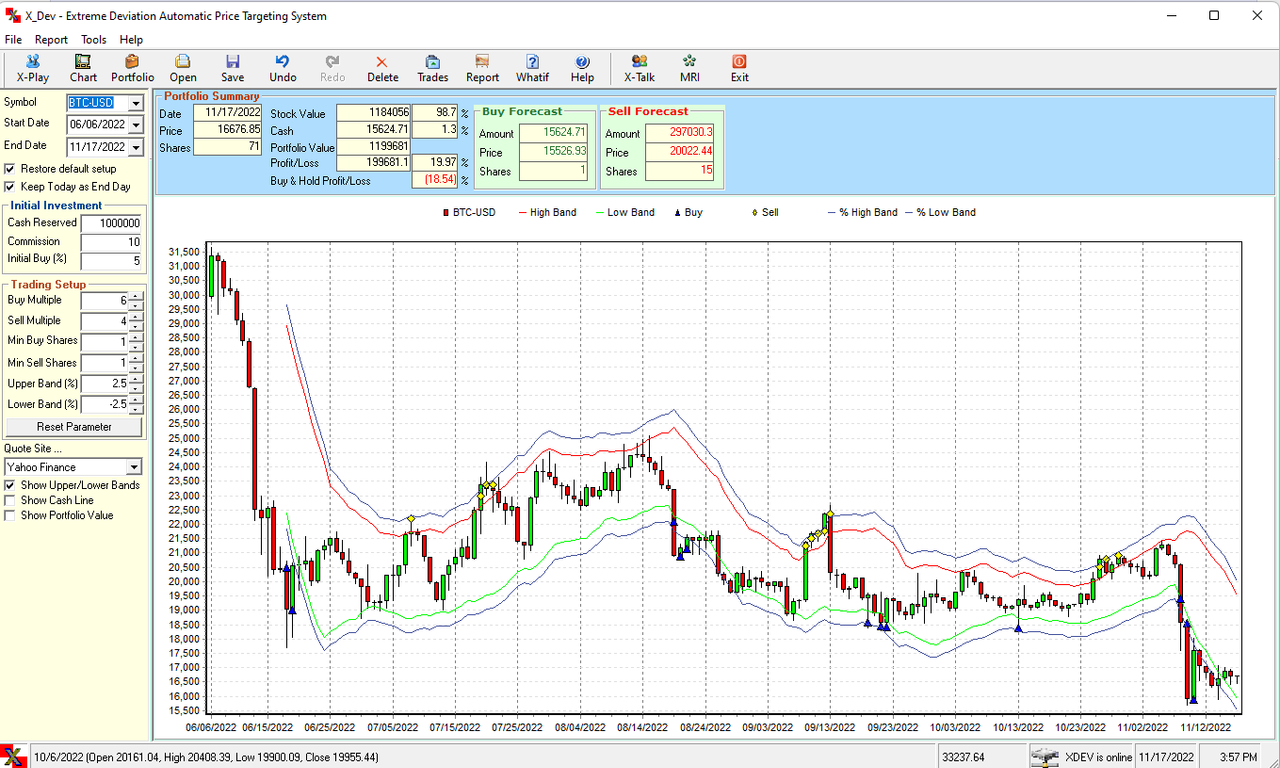
Below is my spreadsheet for trading Bitcoin. The algorithm used for it's construction was created back in 2002 which is when this board was created. Inspiration for the algorithm arose from reading Robert Lichello's book on A.I.M. From this spreadsheet a windows based program which I called X_DEV (above) was developed with the help of a genius programmer friend. Unfortunately my programmer friend became unavailable to support X_DEV development so the program faded into obscurity. Just recently (8/2021) my programmer friend resurrected a copy for me. The program is no longer for sale, though who knows what the future holds if programmer friend finds the time and interest again. I never lost interest in X_DEV as I believe it is an invaluable tool for trading/investing. I hope all who visit this board will develop an interest in X_DEV and are willing to discuss it's features or flaws (if any), in a polite, positive friendly way. Any other topics related to trading/investing are welcome as well. If you have a stock or a crypto that you would like run through the X_DEV program just ask on the board below. Cheers!
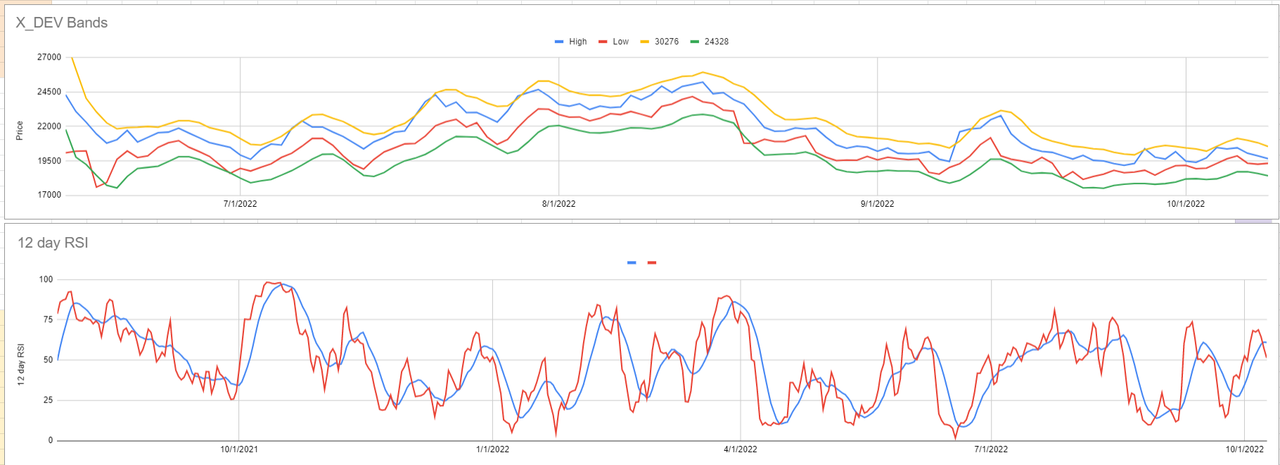
X_DEV Bitcoin - Note the High % DEV Band and Low % Dev Band for targets.
X_DEV Bands
For anyone that wants to post images in your messages I highly recommend using https://postimages.org/. It's free and extremely easy and fast.
Important posts:
X_Dev vs. AIM : Post 4097 https://investorshub.advfn.com/boards/read_msg.aspx?message_id=652928
Quick guide to optimization : Post 4318 https://investorshub.advfn.com/boards/read_msg.aspx?message_id=663945
X_DEV User Manual - https://web.archive.org/web/20070101012309/stockwerld.com:80/xdevusersmanual.pdf
X_DEV 3 day Rule : Post 4349 https://investorshub.advfn.com/boards/read_msg.aspx?message_id=668865
| Volume | |
| Day Range: | |
| Bid Price | |
| Ask Price | |
| Last Trade Time: |


