News
News  Market Data
  Discover
Support: 888-992-3836
Copyright © 2023 InvestorsHub Inc.


Register for free to join our community of investors and share your ideas. You will also get access to streaming quotes, interactive charts, trades, portfolio, live options flow and more tools.
Got Smileys in the IBox........et z
I wanna be 'Gone Fishing'.......Siempre.........et z
best to you as you move forward zardiw 
Wow! 6 years is a long run, congrats z
Sorry guys....my heart just isn't into it anymore....too much bs on ihub lately.........Board had a nice run.......almost 6 years.....time to call it a nite....z
Death Drop v3.57 - 20100915 (>30% 3 Day Drop or 5 day drop > 50%) -
Google Ron Paul, our Last Hope
 We are starting our OWN Company (LINA):
Message Board: http://investorshub.advfn.com/boards/board.aspx?board_id=14808
Website: http://www.LighthouseNova.com
Modifications: Finally aligned the columns! (Sort of)
Graduate Flag: If the symbol has an @ sign
next to it, it means that the stock has risen enough to leave the DD Zone.
Speed is the rate of change today, vs the total 3 day drop
i.e. it is the current "drop speed" of the stock. A negative speed
means the price is rising.
Power is vol today divided by 20 day avg volume. i.e. a power value of 2.6
would mean the volume was 2.6 times the 20 day avg volume.
Torque is the % change in volume today vs yesterday.
Pressure is the dollar amount (in thousands) traded.
Pressure had to be > 10 at one time to be listed.
G is the G-Spot, and is the number of days
in a row it has gone down/stayed even.
D is the Depth, and is the number of days
it has been in Death Drop mode. Will become more accurate atgb.
Volts represents Pressure divided by the Gap (high low range).
Watts represents Pressure divided by the Net (open close range).
 SYMB    Last   Chg     G       D     Pressure Volts  Watts   Speed    Power   Torque   3 Day Drop    (4/5 Day Drop)    Volume

 ABWTQ   0.0202  -16%  	4	1	37.7	42	99	48	3.5	146	-33%		-36/-35		1,539,700
 ADAC   0.0062  -17%  	2	1	12.8	46	71	46	0.5	-78	-38%		-32/3		1,945,000
 AMFE   0.0058  -22%  	2	1	21.8	84	104	70	8.3	-5	-31%		-3/-31		3,301,400
 AMNG   0.0128  -2%  	9	6	53.5	206	297	7	0.3	6	-22%		-26/-28		4,574,400
 ANWM @ 0.0123  12%  	0	99	14.3	72	110	-57	0.8	-67	-21%		-28/-21		1,194,500
 ATIG   0.0070  -21%  	4	1	10.3	35	10,252	59	0.7	235	-36%		-42/-13		1,376,100
 BFHJ @ 0.0010  25%  	0	99	28.7	957	957	-67	1.5	-63	-38%		-23/11		33,781,500
 BGMO   0.0180  -4%  	4	4	5.5	27	27	43	0.6	-65	-10%		-14/0		287,000
 BLLD   0.0080  -11%  	5	3	5.9	31	117	56	0.8	-6	-20%		-28/-47		728,100
 BNYN   0.0003  0%  	5	3	0.3	300	300	0	0.2	-98	-25%		-40/-73		1,000,000
 BUGS   0.0034  6%  	0	6	1.9	31	38	-206	0.2	-72	3%		-8/-11		590,100
 CLDR   0.0005  0%  	8	6	22.2	1,111	2,222	0	0.7	-34	-38%		-38/-38		44,444,400
 CLRH   0.0170  0%  	7	2	15.2	51	152	0	2.5	1	-26%		-29/-32		921,600
 CMGR   0.0100  -22%  	4	6	121.1	275	551	38	1.7	3	-59%		-63/-62		11,761,600
 CNEX   0.0007  -30%  	1	1	35.8	1,192	1,192	100	0.9	38	-30%		-22/-30		42,076,000
 DGMA   0.0006  -33%  	2	2	63.1	2,102	2,102	100	1.2	-36	-33%		-33/-54		84,086,500
 ECMH   0.0040  5%  	0	1	4.3	22	4,320	-14	2.0	-46	-38%		-38/-38		1,079,900
 ECOF   0.0160  -11%  	4	3	4.6	15	15	27	1.1	47	-41%		-47/-41		261,500
 EGIL   0.0100  -23%  	4	1	4.0	12	12	69	0.5	40	-33%		-41/25		341,500
 ENSLR @ 0.0004  100%  	0	99	3.8	76	190	-200	3.7	-11	-50%		-43/-69		8,444,600
 ESYR   0.0008  -11%  	8	6	4.7	467	4,667	56	0.3	-69	-20%		-20/-38		5,491,000
 ETNL   0.0036  -3%  	3	20	3.5	88	88	27	0.5	-37	-10%		-3/-5		927,700
 EVRM @ 0.0064  25%  	0	99	3.7	62	3,708	-174	0.4	-51	-15%		-20/-25		553,500
 EVRN   0.0015  -12%  	1	1	68.2	974	6,820	31	2.4	-14	-37%		-44/-53		43,998,000
 GAZU   0.0150  -25%  	2	7	8.1	10	16	100	1.0	100	-25%		-36/-50		424,500
 GFGU   0.0120  0%  	5	3	8.8	18	44	0	0.2	-22	-29%		-33/-37		706,000
 GRGR   0.0005  0%  	8	9	0.0	0	0	0	0.0	2627	-50%		-50/-50		300
 GVDI   0.0140  -13%  	3	1	19.7	25	98	42	0.7	15	-30%		40/27		1,416,600
 HHGI   0.0005  -17%  	3	1	4.2	421	421	44	0.4	-67	-38%		0/-29		7,646,700
 HLXW   0.0075  -9%  	2	4	115.8	681	1,931	137	1.1	210	-6%		-17/-36		15,761,500
 HSCO   0.0040  -41%  	3	1	24.0	60	71	75	1.4	74	-55%		-55/-53		4,368,200
 IHSN   0.0026  8%  	0	1	4.2	209	209	-24	0.3	46	-35%		-13/73		1,675,000
 IMAI   0.0017  -43%  	1	1	23.1	128	178	135	13.3	42423	-32%		-29/-29		11,013,500
 LGTT   0.0040  -13%  	4	1	6.6	22	22	26	3.5	144	-50%		-71/-60		1,199,600
 LTDU   0.0200  -13%  	3	1	1.0	3	3	42	0.3	-82	-31%		-29/-26		46,900
 MMTE   0.0004  0%  	8	8	11.9	593	11,862	0	1.1	200	0%		0/0		29,655,700
 MMUH   0.0005  0%  	4	2	14.6	1,464	14,644	0	0.4	-88	-29%		-38/67		32,541,200
 MSGI*  0.0300  0%  	3	5	17.5	44	17,539	0	1.0	-6	0%		3/-25		604,800
 MSOA   0.0006  -45%  	5	2	355.9	5,931	7,117	66	5.7	798	-68%		-68/-77		395,393,800
 NWMT @ 0.0005  25%  	0	99	25.8	1,288	1,288	-2.5E8	0.8	45	0%		0/-17		64,409,600
 PCLI   0.0005  0%  	9	7	3.6	3,581	3,581	0	0.4	7063	0%		0/0		7,162,900
 PRPM @ 0.0009  29%  	0	99	173.6	1,021	17,363	-100	8.3	1861	29%		-10/12		105,232,800
 PVRE   0.0090  -10%  	3	1	0.3	342	342	30	0.1	-5	-33%		-31/-40		38,000
 PWLK   0.0003  0%  	5	3	0.0	0	0	0	0.0	-100	-25%		-25/-40		1,000
 REFG   0.0150  -38%  	9	4	1.3	2	3	89	1.0	-80	-42%		-48/-52		81,000
 RLAB   0.0039  0%  	4	2	0.0	0	0	0	0.0	-100	-35%		-43/-22		0
 RPPR @ 0.0080  116%  	0	99	106.5	150	260	-1046	1.1	235	-11%		-13/-56		14,298,000
 SAEI   0.0300  -56%  	2	1	66.6	17	18	100	4.4	25	-56%		-79/-81		1,373,800
 SHAR   0.0007  -13%  	5	1	2.7	136	272	42	0.5	-67	-30%		-30/-36		3,881,900
 SLGLF   0.0050  -19%  	1	1	45.7	415	415	58	0.7	-39	-33%		-32/-26		8,233,500
 SLRW   0.0019  0%  	4	3	2.3	58	115	0	0.5	66	-37%		-51/-37		1,356,700
 SMKG   0.0055  -21%  	3	1	5.8	29	39	55	3.1	196	-39%		-31/-21		964,700
 SNEYD   0.0065  0%  	7	14	0.0	0	0	0	0.0	-100	0%		-3/-7		0
 SNPY   0.0100  0%  	4	2	3.2	32	65	0	1.9	-75	-17%		-50/-33		340,000
 SOLU   0.0070  -18%  	6	2	28.6	56	95	35	6.9	43	-50%		-53/-53		3,022,600
 TFBN   0.0001  0%  	42	40	0.0	0	0	0	0.0	-100	0%		0/0		0
 TLAG   0.0031  0%  	1	4	21.9	547	1,093	0	0.7	247	0%		-16/-48		7,540,800
 TRDX   0.0120  -8%  	3	1	10.3	23	34	20	1.4	-72	-38%		-25/-23		810,100
 UNDT   0.0009  -10%  	3	3	6.0	602	602	55	0.1	-74	-18%		-10/-44		6,338,200
 UWRL @ 0.0008  14%  	0	99	36.1	1,803	36,051	-52	0.9	-20	-27%		-27/-11		45,064,100
 VPER   0.0010  -33%  	4	2	0.5	11	26	56	0.2	-95	-60%		-60/-44		423,700
 VRNI   0.0007  -30%  	2	2	20.9	419	698	83	1.5	-25	-36%		17/-22		24,643,300
 WSTM   0.0170  -24%  	1	1	7.1	7	7	59	0.7	-32	-41%		-40/-43		331,600
 WTCT   0.0021  -16%  	4	1	0.8	20	20	53	0.2	-35	-30%		-36/-12		352,000
 WTKN   0.0070  -13%  	3	1	4.7	95	95	42	0.4	106	-30%		-22/75		652,500
 XMDC   0.0100  -14%  	3	1	4.9	24	30	46	0.3	-85	-30%		-22/-11		441,600
Death Drop v3.57 - 20100914 (>30% 3 Day Drop or 5 day drop > 50%) -
Google Ron Paul, our Last Hope
We are starting our OWN Company (LINA):
Message Board: http://investorshub.advfn.com/boards/board.aspx?board_id=14808
Website: http://www.LighthouseNova.com
Modifications: Finally aligned the columns! (Sort of)
Graduate Flag: If the symbol has an @ sign
next to it, it means that the stock has risen enough to leave the DD Zone.
Speed is the rate of change today, vs the total 3 day drop
i.e. it is the current "drop speed" of the stock. A negative speed
means the price is rising.
Power is vol today divided by 20 day avg volume. i.e. a power value of 2.6
would mean the volume was 2.6 times the 20 day avg volume.
Torque is the % change in volume today vs yesterday.
Pressure is the dollar amount (in thousands) traded.
Pressure had to be > 10 at one time to be listed.
G is the G-Spot, and is the number of days
in a row it has gone down/stayed even.
D is the Depth, and is the number of days
it has been in Death Drop mode. Will become more accurate atgb.
Volts represents Pressure divided by the Gap (high low range).
Watts represents Pressure divided by the Net (open close range).
 SYMB    Last   Chg     G       D     Pressure Volts  Watts   Speed    Power   Torque   3 Day Drop    (4/5 Day Drop)    Volume

 AAVG @ 0.0150  15%  	0	99	7.4	25	30	-215	0.3	23	7%		7/7		551,500
 AMNG   0.0130  -10%  	8	5	54.4	187	1,087	42	0.3	-19	-24%		-27/-38		4,332,500
 ANWM   0.0110  -21%  	3	1	45.4	99	142	61	2.6	90	-35%		-29/9		3,658,100
 ARGC @ 0.0080  33%  	0	99	0.5	2	2	-67	0.1	-96	-50%		-47/33		70,000
 AUBC   0.0300  -25%  	6	1	8.0	4	4	55	0.9	-25	-45%		-79/-85		201,700
 BFHJ   0.0008  -27%  	2	1	77.1	1,543	2,571	71	4.4	267	-38%		-11/-11		90,744,000
 BGMO   0.0188  -1%  	3	3	16.6	52	830	10	1.7	174	-10%		4/-35		813,900
 BLLD   0.0090  -10%  	4	2	6.9	38	688	53	0.8	599	-19%		-40/-36		773,000
 BNYN   0.0003  0%  	4	2	14.9	1,487	14,869	0	6.7	10	-40%		-73/-63		42,483,300
 BTDG @ 0.0095  171%  	0	99	176.0	293	352	-154	6.2	6702	111%		86/138		25,139,000
 BUGS   0.0032  7%  	0	5	6.7	96	223	-49	0.8	-26	-14%		-16/-20		2,127,100
 CLDR   0.0005  -38%  	7	5	40.4	2,020	2,020	100	1.1	-16	-38%		-38/-50		67,344,100
 CLRH   0.0170  -23%  	6	1	17.8	36	36	78	2.7	-16	-29%		-32/-34		914,700
 CMGR   0.0129  -32%  	3	5	186.2	196	262	61	1.8	15	-52%		-50/-66		11,459,900
 DGMA   0.0009  -18%  	1	1	145.1	2,419	4,838	1.818E8	1.9	197	0%		-31/-67		131,932,900
 ECOF   0.0180  -3%  	3	2	3.3	33	33	7	0.7	-60	-40%		-33/-44		177,900
 EMLL @ 0.0004  33%  	0	99	4.7	468	4,683	-167	0.2	-23	-20%		-33/-43		13,380,900
 ENSLR   0.0002  -60%  	2	1	5.7	71	284	84	5.1	243	-71%		-85/-93		9,482,500
 ESYR   0.0009  0%  	7	5	14.0	698	13,963	0	0.8	79	-10%		-31/-40		17,453,300
 ETNL   0.0037  0%  	2	19	5.7	113	566	0	0.8	49	0%		-3/0		1,471,100
 EVRM   0.0051  -22%  	6	1	6.6	47	47	59	0.8	-35	-36%		-40/-43		1,139,500
 EVRN @ 0.0017  13%  	0	99	74.3	1,062	3,717	-36	3.2	54	-37%		-47/-64		51,267,900
 GAZU   0.0200  0%  	1	6	4.2	142	212	3	0.5	113	-15%		-33/-33		211,900
 GFGU   0.0120  0%  	4	2	11.8	20	30	0	0.3	-38	-33%		-37/-5		907,200
 GRGR   0.0005  0%  	7	8	0.0	0	0	0	0.0	-100	-50%		-50/-50		0
 HIDE @ 0.0300  48%  	0	99	2.0	3	3	-1386	0.7	-10	3%		3/-9		74,300
 HLXW   0.0082  -5%  	1	3	43.2	432	719	52	0.4	-81	-9%		-30/-66		5,077,900
 MMTE   0.0004  0%  	7	7	4.4	444	4,442	0	0.4	-57	0%		0/0		9,872,100
 MMUH   0.0005  0%  	3	1	125.7	4,191	1.2572E5	0	3.8	32	-38%		67/25		279,367,900
 MSGI*  0.0300  0%  	2	4	18.4	26	18,380	0	1.1	48	3%		-25/-33		644,900
 MSOA   0.0011  -42%  	4	1	72.6	559	908	100	0.9	148	-42%		-58/83		44,009,300
 MTRO @ 0.0220  29%  	0	99	15.7	17	31	-94	3.5	53	-31%		-37/-37		899,500
 NWMT   0.0004  0%  	9	8	15.5	1,551	15,507	0	0.5	-80	-20%		-33/-33		44,306,600
 PCLI   0.0005  0%  	8	6	0.1	50	50	0	0.0	-95	0%		0/-17		100,000
 PRPM   0.0007  -13%  	1	1	4.0	402	4,024	42	0.6	-69	-30%		-13/-13		5,365,300
 PWLK   0.0003  0%  	4	2	1.9	1,907	1,907	0	0.4	148	-25%		-40/-25		6,356,900
 QEGY @ 0.0080  264%  	0	99	0.1	0	0	-100	7.1	1.3445E5	264%		264/264		14,800
 REFG   0.0240  0%  	8	3	9.7	9,742	9,742	0	5.0	169	-17%		-23/-40		405,900
 RLAB   0.0039  -25%  	3	1	3.1	11	31	59	3.0	481	-43%		-22/-3		612,400
 RPPR   0.0037  -26%  	5	4	18.4	131	141	43	0.3	-67	-60%		-79/-84		4,272,500
 SLRW   0.0019  -5%  	3	2	1.5	50	151	10	0.3	-98	-51%		-37/-46		815,800
 SNEYD   0.0065  0%  	6	13	0.0	0	0	0	0.0	-100	-3%		-7/-7		0
 SNPY   0.0100  -1%  	3	1	15.4	51	154	2	8.3	661	-50%		-33/-50		1,340,000
 SOLU   0.0085  -29%  	5	1	27.9	29	80	67	7.3	664	-43%		-43/-53		2,106,900
 STWG @ 0.0150  36%  	0	99	1.3	3	3	-173	1.3	-82	-21%		-21/-21		100,500
 TFBN   0.0001  0%  	41	39	0.0	0	0	0	0.0	-100	0%		0/0		0
 TLAG   0.0031  3%  	0	3	6.7	112	224	-21	0.2	-80	-16%		-48/-43		2,172,000
 UNDT   0.0010  0%  	2	2	24.6	1,232	24,646	0	0.6	-23	0%		-38/43		24,645,800
 UWRL   0.0007  -22%  	3	1	47.7	1,590	1,590	61	1.2	-13	-36%		-22/-30		56,125,500
 VPER   0.0015  -6%  	3	1	11.2	186	1,118	16	3.3	110	-40%		-17/-25		8,596,300
 VRNI   0.0010  -38%  	1	1	52.6	438	526	56	2.2	-59	67%		11/-86		32,884,300
Death Drop v3.57 - 20100913 (>30% 3 Day Drop or 5 day drop > 50%) -
Google Ron Paul, our Last Hope
We are starting our OWN Company (LINA):
Message Board: http://investorshub.advfn.com/boards/board.aspx?board_id=14808
Website: http://www.LighthouseNova.com
Modifications: Finally aligned the columns! (Sort of)
Graduate Flag: If the symbol has an @ sign
next to it, it means that the stock has risen enough to leave the DD Zone.
Speed is the rate of change today, vs the total 3 day drop
i.e. it is the current "drop speed" of the stock. A negative speed
means the price is rising.
Power is vol today divided by 20 day avg volume. i.e. a power value of 2.6
would mean the volume was 2.6 times the 20 day avg volume.
Torque is the % change in volume today vs yesterday.
Pressure is the dollar amount (in thousands) traded.
Pressure had to be > 10 at one time to be listed.
G is the G-Spot, and is the number of days
in a row it has gone down/stayed even.
D is the Depth, and is the number of days
it has been in Death Drop mode. Will become more accurate atgb.
Volts represents Pressure divided by the Gap (high low range).
Watts represents Pressure divided by the Net (open close range).
 SYMB    Last   Chg     G       D     Pressure Volts  Watts   Speed    Power   Torque   3 Day Drop    (4/5 Day Drop)    Volume

 AAVG   0.0130  -7%  	7	5	5.9	40	59	100	0.3	-17	-7%		-7/-13		447,500
 AMNG   0.0145  -12%  	7	4	71.9	144	480	65	0.4	161	-19%		-31/-45		5,329,600
 ARGC   0.0060  -14%  	2	1	11.7	58	117	24	3.0	-38	-60%		0/20		1,944,600
 BGMO   0.0190  -5%  	2	2	5.8	48	58	90	0.7	-69	6%		-34/-41		297,000
 BLLD   0.0100  0%  	3	1	1.2	5	1,189	0	0.1	-89	-33%		-29/-17		110,600
 BNYN   0.0003  -25%  	3	1	13.5	1,346	13,459	34	9.1	467	-73%		-63/-63		38,453,800
 BTDG   0.0035  -13%  	3	1	1.5	15	15	40	0.1	-88	-31%		-13/-13		369,600
 BUGS   0.0030  -9%  	6	4	9.1	101	304	43	1.1	83	-21%		-25/-33		2,890,700
 CLDR   0.0008  0%  	6	4	67.9	1,358	6,789	0	1.3	4	0%		-20/-38		79,866,200
 CMFV @ 0.0300  76%  	0	99	0.3	0	0	-153	0.2	686	50%		11/-25		11,000
 CMGR   0.0190  -21%  	2	4	235.3	216	235	79	1.8	-25	-27%		-50/-75		9,993,500
 CYNS @ 0.0015  36%  	0	99	0.4	6	7	-3.636E8	0.2	-70	0%		-17/-48		296,000
 DGMA @ 0.0011  22%  	0	99	53.2	887	2,661	-144	0.7	-58	-15%		-59/-59		44,348,700
 DTRO @ 0.0040  14%  	0	99	1.4	23	27	-557	0.1	-60	3%		0/0		366,700
 ECOF   0.0185  -31%  	2	1	7.7	15	77	100	1.7	540	-31%		-42/-38		439,500
 EMLL   0.0003  0%  	4	2	6.1	606	606	0	0.2	-93	-50%		-57/-50		17,310,900
 ESYR   0.0009  -10%  	6	4	8.8	440	880	33	0.5	-44	-31%		-40/-44		9,776,900
 ETNL   0.0037  -7%  	1	18	3.8	188	375	285	0.4	696	-3%		0/-7		986,900
 EVRN   0.0015  -37%  	4	3	65.0	433	541	71	2.5	281	-53%		-68/-63		33,319,200
 GAZU   0.0201  0%  	0	5	2.2	6	8	-2	0.2	-57	-33%		-33/-37		99,600
 GFGU   0.0120  -29%  	3	1	20.2	31	40	80	0.5	977	-37%		-5/-8		1,469,100
 GRGR   0.0005  -50%  	6	7	0.0	0	0	100	0.0	1718	-50%		-50/-50		200
 HIDE   0.0203  -19%  	4	1	1.9	4	4	63	0.8	86	-30%		-38/35		82,900
 HLXW   0.0086  7%  	0	2	226.9	1,513	11,344	-28	2.0	13	-26%		-64/62		26,229,400
 JUNP @ 0.0004  33%  	0	99	0.2	165	165	-3.333E8	0.1	-97	0%		-20/-20		411,900
 MDIN @ 0.0004  33%  	0	99	0.3	29	29	-100	0.1	197	-33%		0/-20		825,500
 MMTE   0.0004  0%  	6	6	10.4	1,042	1,042	0	0.8	25	0%		0/0		23,166,600
 MSGI*  0.0300  0%  	1	3	13.4	31	103	0	0.8	-76	-25%		-33/-39		435,300
 MTRO   0.0170  -48%  	1	1	14.7	9	9	94	2.0	1348	-51%		-51/-51		586,400
 NWMT   0.0004  -20%  	8	7	86.7	4,333	86,660	60	2.6	229	-33%		-33/-43		216,649,100
 PCLI   0.0005  0%  	7	5	1.2	116	116	0	0.1	17	0%		-17/-17		2,100,000
 PWLK   0.0003  -25%  	3	1	0.8	768	768	63	0.2	71	-40%		-25/-25		2,560,000
 QEGY   0.0022  0%  	75	76	0.0	0	0	0	0.0	-100	0%		0/0		0
 REFG   0.0240  -8%  	7	2	3.8	19	19	34	2.5	-21	-23%		-40/-40		151,000
 RPPR   0.0050  -44%  	4	3	90.0	158	191	62	1.0	234	-72%		-78/-63		13,133,500
 SFOR @ 0.0055  67%  	0	99	0.6	3	3	-117	0.2	-94	57%		57/-21		144,600
 SLRW   0.0020  -33%  	2	1	78.3	522	783	100	13.0	3705	-33%		-43/-33		34,796,700
 SNEYD   0.0065  0%  	5	12	0.0	0	0	0	0.0	-100	-7%		-7/-59		0
 STWG   0.0110  -29%  	4	1	7.9	9	11	69	7.7	7280	-42%		-42/-38		553,500
 TFBN   0.0001  0%  	40	38	0.0	0	0	0	0.0	-100	0%		0/0		0
 TLAG   0.0030  -3%  	3	2	32.6	326	32,610	6	1.0	-39	-50%		-44/-17		10,870,100
 UNDT   0.0010  -9%  	1	1	31.8	1,591	31,830	24	0.7	-30	-38%		43/43		31,829,800
 VGPR @ 0.0110  10%  	0	99	0.3	275	275	-32	0.2	-96	-31%		-31/-31		25,000
 VRNI @ 0.0016  45%  	0	99	141.1	1,086	14,112	-58	6.0	5	78%		-77/-77		80,639,700
Death Drop v3.57 - 20100910 (>30% 3 Day Drop or 5 day drop > 50%) -
Google Ron Paul, our Last Hope
We are starting our OWN Company (LINA):
Message Board: http://investorshub.advfn.com/boards/board.aspx?board_id=14808
Website: http://www.LighthouseNova.com
Modifications: Finally aligned the columns! (Sort of)
Graduate Flag: If the symbol has an @ sign
next to it, it means that the stock has risen enough to leave the DD Zone.
Speed is the rate of change today, vs the total 3 day drop
i.e. it is the current "drop speed" of the stock. A negative speed
means the price is rising.
Power is vol today divided by 20 day avg volume. i.e. a power value of 2.6
would mean the volume was 2.6 times the 20 day avg volume.
Torque is the % change in volume today vs yesterday.
Pressure is the dollar amount (in thousands) traded.
Pressure had to be > 10 at one time to be listed.
G is the G-Spot, and is the number of days
in a row it has gone down/stayed even.
D is the Depth, and is the number of days
it has been in Death Drop mode. Will become more accurate atgb.
Volts represents Pressure divided by the Gap (high low range).
Watts represents Pressure divided by the Net (open close range).
 SYMB    Last   Chg     G       D     Pressure Volts  Watts   Speed    Power   Torque   3 Day Drop    (4/5 Day Drop)    Volume

 AAVG   0.0140  0%  	6	4	7.1	48	48	0	0.3	113	0%		-7/-26		538,500
 AMNG   0.0165  -4%  	6	3	35.7	71	714	19	0.1	-56	-21%		-38/-39		2,038,700
 APCX @ 0.0004  33%  	0	99	34.3	3,432	34,324	-3.333E8	1.0	169	0%		-20/-33		98,068,700
 AVEW @ 0.0045  12%  	0	99	1.0	7	49	-83	0.2	355	-15%		-25/36		239,800
 BGMO   0.0200  -5%  	1	1	21.7	43	217	15	2.3	-70	-31%		-38/-47		964,000
 BUGS   0.0033  -11%  	5	3	5.4	67	107	62	0.6	-63	-18%		-27/-40		1,575,800
 CLDR   0.0008  0%  	5	3	57.9	1,929	57,857	0	1.4	-32	-20%		-38/-43		77,142,300
 CMFV   0.0170  -15%  	6	2	0.0	24	24	41	0.0	-99	-37%		-58/-58		1,400
 CMGR   0.0241  -11%  	1	3	374.2	188	959	29	2.6	60	-37%		-68/-60		13,339,000
 CYNS   0.0011  -15%  	4	2	1.2	38	58	40	0.5	134	-39%		-62/83		1,001,600
 DGMA   0.0009  0%  	4	11	106.3	2,658	1.0631E5	0	1.6	-38	-67%		-67/-64		106,312,500
 DTRO   0.0035  3%  	0	9	3.1	77	308	-24	0.1	-63	-13%		-13/-17		905,700
 EGOC @ 0.0160  100%  	0	99	5.2	7	7	-500	0.9	-76	-20%		-9/-16		434,300
 EMLL   0.0003  -40%  	3	1	93.4	4,670	4,670	70	2.4	250	-57%		-50/-50		233,519,200
 ENSLR @ 0.0008  14%  	0	99	1.4	23	45	-19	1.5	-54	-73%		-47/-73		1,688,500
 ESYR   0.0010  0%  	5	3	19.3	482	19,288	0	0.9	89	-33%		-38/-63		17,534,400
 ETNL   0.0040  8%  	0	17	0.5	16	24	-100	0.0	-35	8%		0/0		124,000
 EVRN   0.0024  -11%  	3	2	20.6	294	686	23	0.7	-41	-49%		-40/-44		8,755,500
 GAZU   0.0200  -15%  	4	4	5.0	16	17	45	0.6	8	-33%		-38/-26		233,000
 GGII @ 0.0006  20%  	0	99	2.8	139	277	-140	0.3	-63	-14%		-33/-45		4,621,000
 GRGR   0.0010  0%  	5	6	0.0	0	0	0	0.0	-100	0%		0/0		0
 HHGI @ 0.0008  60%  	0	99	21.2	706	2,117	-420	1.6	204	14%		0/14		28,223,500
 HLXW   0.0080  -11%  	3	1	198.7	1,325	1,987	17	2.0	-31	-67%		51/43		23,239,600
 ITCJ @ 0.0033  175%  	0	99	188.6	943	993	-269	2.8	402	65%		10/38		78,573,200
 JUNP   0.0003  -25%  	9	1	5.9	294	589	63	3.1	53	-40%		-40/-40		14,720,000
 MDIN   0.0003  0%  	2	2	0.1	10	10	0	0.0	-99	-25%		-40/-40		278,000
 MMTE   0.0004  0%  	5	5	8.4	835	8,353	0	0.6	78	0%		0/-20		18,561,600
 MSGI*  0.0300  3%  	0	2	49.2	41	49,172	-10	3.1	-41	-33%		-39/-33		1,821,200
 NWMT   0.0005  0%  	7	6	32.9	1,646	3,291	0	0.9	-47	-17%		-29/-29		65,820,400
 PCLI   0.0005  0%  	6	4	0.9	895	895	0	0.1	-82	-17%		-17/-17		1,789,300
 PFMS @ 0.0008  14%  	0	99	3.8	192	384	-71	0.4	-63	-20%		-38/-33		4,798,300
 QEGY   0.0022  0%  	74	75	0.0	0	0	0	0.0	-100	0%		0/0		0
 REFG   0.0260  -10%  	6	1	5.4	11	14	30	3.6	1805	-35%		-35/-35		190,500
 RPPR   0.0090  -2%  	3	2	34.0	79	189	4	0.3	-72	-61%		-33/50		3,936,300
 RRPH @ 0.0030  150%  	0	99	0.6	4	4	-131	0.4	-61	114%		50/50		301,000
 SFOR   0.0033  6%  	0	2	11.9	30	594	-113	3.5	152	-6%		-53/22		2,351,100
 SNEYD   0.0065  -3%  	4	11	20.6	257	685	42	0.5	-31	-7%		-59/-58		3,212,900
 STHG @ 0.0037  28%  	0	99	153.9	1,399	1,924	-313	2.9	676	9%		-5/-7		44,616,000
 TFBN   0.0001  0%  	39	37	0.0	0	0	0	0.0	-100	0%		0/0		0
 TLAG   0.0031  -16%  	2	1	59.0	590	1,181	38	1.7	-23	-43%		-14/-23		17,893,800
 VGPR   0.0100  -17%  	10	5	6.1	50	50	44	5.5	590	-38%		-38/-38		571,000
 VRNI   0.0011  83%  	0	1	57.5	822	1,438	-99	8.2	76	-84%		-84/-84		76,691,200
Death Drop v3.57 - 20100909 (>30% 3 Day Drop or 5 day drop > 50%) -
Google Ron Paul, our Last Hope
We are starting our OWN Company (LINA):
Message Board: http://investorshub.advfn.com/boards/board.aspx?board_id=14808
Website: http://www.LighthouseNova.com
Modifications: Finally aligned the columns! (Sort of)
Graduate Flag: If the symbol has an @ sign
next to it, it means that the stock has risen enough to leave the DD Zone.
Speed is the rate of change today, vs the total 3 day drop
i.e. it is the current "drop speed" of the stock. A negative speed
means the price is rising.
Power is vol today divided by 20 day avg volume. i.e. a power value of 2.6
would mean the volume was 2.6 times the 20 day avg volume.
Torque is the % change in volume today vs yesterday.
Pressure is the dollar amount (in thousands) traded.
Pressure had to be > 10 at one time to be listed.
G is the G-Spot, and is the number of days
in a row it has gone down/stayed even.
D is the Depth, and is the number of days
it has been in Death Drop mode. Will become more accurate atgb.
Volts represents Pressure divided by the Gap (high low range).
Watts represents Pressure divided by the Net (open close range).
 SYMB    Last   Chg     G       D     Pressure Volts  Watts   Speed    Power   Torque   3 Day Drop    (4/5 Day Drop)    Volume

 AAVG   0.0140  0%  	5	3	3.1	7	8	0	0.1	-69	-7%		-26/-35		253,000
 ADAC @ 0.0091  52%  	0	99	9.1	28	29	-196	0.3	235	26%		14/14		1,193,700
 AMNG   0.0172  -3%  	5	2	76.3	263	2,545	10	0.3	-37	-35%		-36/-36		4,613,100
 APCX   0.0003  0%  	4	2	9.1	910	9,103	0	0.4	-78	-40%		-50/-40		36,411,900
 AVEW   0.0040  -23%  	3	1	0.2	3	3	69	0.1	-86	-33%		21/-9		52,700
 BGMO @ 0.0210  17%  	0	99	65.0	130	650	-48	8.4	149	-34%		-45/-40		3,169,900
 BUGS   0.0037  -3%  	4	2	14.7	210	1,472	15	1.6	147	-18%		-33/-27		4,266,800
 CLDR   0.0008  0%  	4	2	96.7	3,224	96,718	0	2.2	66	-38%		-43/-38		113,785,400
 CMFV   0.0200  0%  	5	1	5.0	20	5,036	0	3.9	107	-50%		-50/-50		268,600
 CMGR   0.0270  4%  	0	2	297.0	142	990	-6	1.8	-14	-64%		-55/938		8,355,300
 CYNS   0.0013  -13%  	3	1	0.6	556	556	24	0.2	-80	-55%		117/117		427,600
 DGMA   0.0009  -31%  	3	10	206.4	3,440	3,440	46	2.8	-4	-67%		-64/-61		172,020,800
 DTRO   0.0034  -13%  	10	8	8.9	112	446	85	0.4	147	-15%		-19/-19		2,479,300
 EGOC   0.0080  -20%  	2	2	16.5	83	103	37	3.8	-2	-54%		-58/-60		1,837,500
 ELRA @ 0.0220  22%  	0	99	2.2	6	11	-185	0.2	-93	-12%		-8/-12		111,300
 ENSLR   0.0007  -46%  	2	2	6.6	28	220	87	3.3	-24	-53%		-77/-30		3,674,000
 ESYR   0.0010  -23%  	4	2	11.1	279	371	62	0.5	-61	-38%		-63/150		9,285,400
 ETNL   0.0037  -3%  	1	16	0.7	25	74	35	0.1	-49	-7%		-7/-10		191,000
 EVRN   0.0027  -16%  	2	1	42.5	607	850	48	1.2	-81	-33%		-37/-40		14,907,600
 EXOU @ 0.0060  71%  	0	99	83.7	70	399	-143	5.1	398	50%		33/20		9,353,000
 GAZU   0.0235  -22%  	3	3	5.3	18	21	82	0.6	28	-27%		-13/-22		215,800
 GERSD @ 0.0006  20%  	0	99	4.3	215	215	-2E8	0.3	-75	0%		-25/-25		8,609,800
 GGII   0.0005  -29%  	7	3	8.1	270	405	64	0.9	-12	-44%		-55/-55		12,462,300
 GRGR   0.0010  0%  	4	5	0.0	0	0	0	0.0	-100	0%		0/100		0
 HHGI   0.0005  -29%  	3	1	5.6	278	278	76	0.6	-68	-38%		-29/-29		9,282,100
 HRRN @ 0.0007  17%  	0	99	2.0	200	200	-100	0.3	-84	17%		-13/-22		3,084,000
 IFRS @ 0.0060  40%  	0	99	5.9	27	59	-257	0.5	21	15%		9/3		963,900
 IHSN @ 0.0030  100%  	0	99	71.4	264	510	-200	6.3	203	50%		25/3		24,207,500
 ITCJ   0.0012  -20%  	3	3	21.9	365	438	33	0.7	-82	-60%		-50/-64		15,654,700
 KEPI @ 0.0150  100%  	0	99	0.8	1	1	-111	0.3	-70	90%		50/50		72,700
 MDIN   0.0003  -50%  	1	1	7.8	784	784	125	2.6	2589	-40%		-40/-40		22,413,100
 MMTE   0.0004  0%  	4	4	4.7	470	470	0	0.4	15	0%		-20/0		10,445,000
 MMUH @ 0.0008  167%  	0	99	47.4	948	1,185	-167	1.7	5072	100%		60/60		72,922,500
 MSGI*  0.0290  -27%  	3	1	96.4	57	321	67	6.1	394	-41%		-36/-19		3,061,200
 NWMT   0.0005  -17%  	6	5	61.9	3,093	61,860	58	1.8	59	-29%		-29/-44		123,720,300
 ORGC @ 0.0130  29%  	0	99	0.2	195	195	-46	0.1	-97	-62%		-48/-63		15,000
 PCLI   0.0005  0%  	5	3	5.1	255	5,095	0	0.5	-51	-17%		-17/-44		10,190,600
 PFMS   0.0007  -22%  	3	3	10.4	520	10,399	48	1.1	-56	-46%		-42/-53		12,998,700
 PPBL @ 0.0195  22%  	0	99	0.0	20	20	-875	0.0	-99	-3%		-22/22		1,000
 QEGY   0.0022  0%  	73	74	0.0	0	0	0	0.0	-100	0%		0/0		0
 RPPR   0.0092  -49%  	2	1	201.6	196	227	156	1.2	-10	-31%		53/156		14,051,700
 RRPH   0.0012  -14%  	14	12	1.0	32	48	36	0.9	6.9863E6	-40%		-40/-40		768,500
 SFOR   0.0031  -11%  	3	1	3.2	53	317	21	1.7	646	-56%		15/82		932,800
 SLMU   0.0300  -14%  	4	1	0.6	1	586	43	0.1	-29	-33%		-40/-29		21,300
 SNEYD   0.0067  -4%  	3	10	33.6	134	187	7	0.7	-75	-58%		-57/-55		4,634,600
 STHG   0.0029  4%  	0	2	16.4	328	1,638	-14	0.4	-78	-26%		-28/-28		5,745,900
 TFBN   0.0001  0%  	38	36	0.0	0	0	0	0.0	-100	0%		0/0		0
 VGPR   0.0120  -25%  	9	4	1.1	2	3	100	1.1	-27	-25%		-25/-85		82,800
Death Drop v3.57 - 20100908 (>30% 3 Day Drop or 5 day drop > 50%) -
Google Ron Paul, our Last Hope
We are starting our OWN Company (LINA):
Message Board: http://investorshub.advfn.com/boards/board.aspx?board_id=14808
Website: http://www.LighthouseNova.com
Modifications: Finally aligned the columns! (Sort of)
Graduate Flag: If the symbol has an @ sign
next to it, it means that the stock has risen enough to leave the DD Zone.
Speed is the rate of change today, vs the total 3 day drop
i.e. it is the current "drop speed" of the stock. A negative speed
means the price is rising.
Power is vol today divided by 20 day avg volume. i.e. a power value of 2.6
would mean the volume was 2.6 times the 20 day avg volume.
Torque is the % change in volume today vs yesterday.
Pressure is the dollar amount (in thousands) traded.
Pressure had to be > 10 at one time to be listed.
G is the G-Spot, and is the number of days
in a row it has gone down/stayed even.
D is the Depth, and is the number of days
it has been in Death Drop mode. Will become more accurate atgb.
Volts represents Pressure divided by the Gap (high low range).
Watts represents Pressure divided by the Net (open close range).
 SYMB    Last   Chg     G       D     Pressure Volts  Watts   Speed    Power   Torque   3 Day Drop    (4/5 Day Drop)    Volume

 AAVG   0.0140  0%  	4	2	11.4	28	11,374	0	0.4	-43	-26%		-35/-15		812,400
 ADAC   0.0060  0%  	6	4	2.3	8	47	0	0.1	-56	-25%		-25/-33		355,900
 AMNG   0.0178  -15%  	4	1	133.7	206	361	45	0.4	46	-34%		-34/-32		7,327,800
 APCX   0.0003  -25%  	3	1	66.3	3,314	6,628	50	1.7	328	-50%		-40/-50		165,708,700
 BGMO   0.0180  -38%  	3	1	26.1	52	65	72	5.8	1317	-53%		-49/-40		1,275,200
 BUGS   0.0038  -5%  	3	1	7.2	102	358	16	0.7	-55	-31%		-25/-16		1,726,100
 CLDR   0.0008  -20%  	3	1	58.4	1,168	2,921	47	1.5	28	-43%		-38/-47		68,730,100
 CMGR   0.0260  -32%  	2	1	302.7	168	303	56	2.4	-30	-57%		900/550		9,763,500
 CWRN @ 0.0008  33%  	0	99	30.0	999	2,996	-233	2.9	11	14%		0/-11		39,952,900
 DGMA   0.0013  -52%  	2	9	412.3	1,874	2,426	108	3.4	146	-48%		-43/-68		179,279,100
 DTRO   0.0039  -3%  	9	7	3.7	52	3,662	35	0.2	-63	-7%		-7/-13		1,003,200
 EGIL @ 0.0080  31%  	0	99	2.5	7	13	-280	0.5	40	-11%		-20/-11		420,000
 EGOC   0.0100  -50%  	1	1	20.6	103	1,031	106	4.8	64	-47%		-50/-67		1,875,000
 ELRA   0.0180  -22%  	2	9	33.5	48	112	87	2.4	2279	-25%		-28/-22		1,558,400
 ENSLR   0.0013  -57%  	1	1	6.1	40	202	100	5.6	396	-57%		30/-35		4,850,300
 ESYR   0.0013  -13%  	3	1	33.4	835	1,114	26	1.3	-3	-52%		225/160		23,865,800
 ETNL   0.0038  3%  	0	15	1.4	34	46	-54	0.1	-55	-5%		-7/-5		371,700
 EXOU   0.0035  0%  	4	2	6.4	80	6,385	0	1.2	-11	-22%		-30/-22		1,878,000
 GAZU   0.0300  0%  	2	2	5.4	14	5,411	0	0.4	30	11%		0/-33		169,100
 GERSD   0.0005  -17%  	9	3	17.3	863	1,727	44	1.3	-13	-38%		-38/-50		34,536,100
 GFGU @ 0.0190  51%  	0	99	51.0	113	150	-110	1.0	400	46%		27/-15		2,956,300
 GGII   0.0007  0%  	6	2	9.9	494	9,885	0	1.1	70	-36%		-36/-42		14,121,800
 GRGR   0.0010  0%  	3	4	0.0	0	0	0	0.0	-100	0%		100/-47		0
 HRRN   0.0006  0%  	9	3	12.6	418	12,554	0	1.9	11	-25%		-33/-33		19,313,700
 IFRS   0.0043  -2%  	6	4	3.1	28	306	10	0.4	89	-22%		-26/-60		795,600
 IHSN   0.0015  -17%  	9	3	13.6	339	1,358	44	3.0	-77	-37%		-48/-48		7,985,800
 ITCJ   0.0015  -25%  	2	2	170.2	1,548	17,023	67	3.8	405	-37%		-55/-82		87,296,700
 KEPI   0.0075  0%  	5	3	1.8	1,800	1,800	0	0.9	-48	-25%		-25/-58		240,000
 MMTE   0.0004  0%  	3	3	4.1	409	4,094	0	0.3	-13	-20%		0/-33		9,098,000
 MMUH   0.0003  -25%  	10	8	0.5	49	49	63	0.0	-56	-40%		-40/-40		1,410,000
 MNDP @ 0.0014  17%  	0	99	56.1	1,402	56,077	-56	1.1	-41	-30%		-39/-55		40,054,800
 NWMT   0.0006  0%  	5	4	42.8	4,280	42,801	0	1.2	4	-14%		-33/-45		77,819,700
 NXXI @ 0.0230  10%  	0	99	1.3	1,325	1,325	-57	0.1	57	17%		-8/-23		57,600
 ORGC   0.0101  -50%  	2	1	7.3	7	7	83	3.8	286	-60%		-71/-78		484,100
 PCLI   0.0005  -17%  	4	2	10.5	524	1,048	100	1.1	-38	-17%		-44/-38		20,957,300
 PFMS   0.0009  -10%  	2	2	28.2	565	941	40	2.7	90	-25%		-40/12		29,725,300
 PPBL   0.0160  -16%  	3	1	2.3	11	11	44	0.2	-43	-36%		0/-28		132,400
 QEGY   0.0022  0%  	72	73	0.0	0	0	0	0.0	-100	0%		0/0		0
 RICPD   0.0001  0%  	73	25	0.0	0	0	0	0.0	-100	0%		0/0		0
 RRPH   0.0014  0%  	13	11	0.0	0	0	0	0.0	-100	-30%		-30/-30		0
 SNEYD   0.0070  0%  	2	9	119.3	398	1,193	0	3.1	-72	-55%		-53/-53		18,355,300
 STHG   0.0028  -18%  	5	1	74.2	1,237	1,856	59	1.7	294	-30%		-30/-30		25,596,600
 SYPJ @ 0.0095  12%  	0	99	0.0	48	48	-100	0.0	45355	12%		12/17		5,000
 TFBN   0.0001  0%  	37	35	0.1	110	110	0	1.7	-4	0%		0/0		1,100,000
 VGPR   0.0160  0%  	8	3	1.9	13	1,913	0	1.6	-78	0%		-80/-84		114,200
Death Drop v3.57 - 20100907 (>30% 3 Day Drop or 5 day drop > 50%) -
Google Ron Paul, our Last Hope
We are starting our OWN Company (LINA):
Message Board: http://investorshub.advfn.com/boards/board.aspx?board_id=14808
Website: http://www.LighthouseNova.com
Modifications: Finally aligned the columns! (Sort of)
Graduate Flag: If the symbol has an @ sign
next to it, it means that the stock has risen enough to leave the DD Zone.
Speed is the rate of change today, vs the total 3 day drop
i.e. it is the current "drop speed" of the stock. A negative speed
means the price is rising.
Power is vol today divided by 20 day avg volume. i.e. a power value of 2.6
would mean the volume was 2.6 times the 20 day avg volume.
Torque is the % change in volume today vs yesterday.
Pressure is the dollar amount (in thousands) traded.
Pressure had to be > 10 at one time to be listed.
G is the G-Spot, and is the number of days
in a row it has gone down/stayed even.
D is the Depth, and is the number of days
it has been in Death Drop mode. Will become more accurate atgb.
Volts represents Pressure divided by the Gap (high low range).
Watts represents Pressure divided by the Net (open close range).
 SYMB    Last   Chg     G       D     Pressure Volts  Watts   Speed    Power   Torque   3 Day Drop    (4/5 Day Drop)    Volume

 AAVG   0.0140  -7%  	3	1	19.2	60	192	19	0.6	-38	-35%		-15/0		1,413,700
 ADAC   0.0060  -17%  	5	3	4.7	34	94	67	0.2	-29	-25%		-33/-48		810,800
 CNEX @ 0.0011  38%  	0	99	28.7	717	717	-375	0.7	68	10%		-8/10		31,850,700
 CTCC @ 0.0250  25%  	0	99	2.1	4	4	-100	0.7	-58	25%		25/-17		95,000
 CWRN   0.0006  -14%  	5	3	23.4	2,345	2,345	57	3.0	7	-25%		-33/-40		36,071,000
 DGMA   0.0027  0%  	1	8	185.9	1,430	3,719	0	1.7	224	17%		-33/-45		72,916,800
 DTRO   0.0040  0%  	8	6	11.6	193	193	0	0.4	19	-5%		-11/-20		2,698,700
 EGIL   0.0061  -31%  	3	3	2.2	8	56	79	0.4	214	-39%		-32/-53		300,100
 EGOC @ 0.0200  14%  	0	99	15.5	12	77	-1.429E8	3.8	638	0%		-33/25		1,144,600
 ELRA   0.0230  -8%  	1	8	1.7	4	6	100	0.1	-77	-8%		0/-4		65,500
 ESSE @ 0.0300  50%  	0	99	2.5	3	3	-100	2.5	9.2172E5	50%		50/20		101,400
 ETNL   0.0037  -7%  	3	14	3.1	61	153	77	0.3	1043	-10%		-7/-12		817,400
 EXOU   0.0035  -13%  	3	1	7.2	60	143	42	1.5	-36	-30%		-22/-30		2,108,800
 EXPU @ 0.0023  15%  	0	99	1.4	34	45	-330	0.3	-74	5%		-4/-8		646,000
 EXTO @ 0.0010  43%  	0	99	2.9	144	289	-104	0.2	-62	-41%		-29/-23		3,206,000
 GAZU   0.0300  -6%  	1	1	4.0	6	13	6.25E7	0.4	48	0%		-33/-57		130,100
 GERSD   0.0006  0%  	8	2	23.8	1,189	23,781	0	1.5	0	-25%		-40/-40		39,635,100
 GFGU   0.0126  -3%  	5	3	8.2	34	34	19	0.2	-61	-16%		-44/-45		591,400
 GGII   0.0007  -22%  	5	1	6.6	332	332	61	0.6	-53	-36%		-42/-46		8,288,100
 GRGR   0.0010  0%  	2	3	0.0	0	0	0	0.0	-100	100%		-47/-44		0
 HRRN   0.0006  0%  	8	2	9.6	320	9,610	0	1.9	-79	-33%		-33/-33		17,472,000
 IFRS   0.0044  -15%  	5	3	1.7	8	22	64	0.2	-5	-24%		-59/-81		420,300
 IHSN   0.0018  -10%  	8	2	56.3	703	2,814	26	15.5	904	-38%		-38/-38		35,171,000
 INCC @ 0.0022  22%  	0	99	0.6	6	10	-467	0.4	519	5%		-37/5		340,400
 ITCJ   0.0020  -33%  	1	1	40.6	313	406	85	0.9	411	-39%		-76/5		17,297,300
 KEPI   0.0075  -5%  	4	2	3.3	22	67	20	1.8	-84	-25%		-58/-50		461,200
 MMTE   0.0004  0%  	2	2	4.7	470	4,697	0	0.3	-87	0%		-33/-20		10,438,300
 MMUH   0.0004  0%  	9	7	1.3	1,290	1,290	0	0.1	-69	-20%		-20/-20		3,225,000
 MNDP   0.0012  -29%  	4	2	101.4	1,689	1,689	61	1.9	60	-48%		-61/-33		67,566,900
 NWMT   0.0006  -14%  	4	3	44.8	2,238	44,766	43	1.2	-50	-33%		-45/-40		74,609,600
 NXXI   0.0210  5%  	0	3	0.9	1	1	-31	0.0	69	-16%		-30/-40		36,800
 PCLI   0.0006  0%  	3	1	26.9	673	26,912	0	1.8	-51	-33%		-25/-25		33,640,100
 PFMS   0.0010  -23%  	1	1	18.8	314	470	69	1.7	54	-33%		25/11		15,678,700
 QEGY   0.0022  0%  	71	72	0.0	0	0	0	0.0	-100	0%		0/0		0
 QOIL @ 0.0053  33%  	0	99	5,883.9	42,028	5.8839E5	-42	12.6	74	77%		-34/-34		1,050,701,600
 RELM @ 0.0004  33%  	0	99	0.1	7	7	-3.333E8	0.0	-99	0%		0/-20		192,300
 RICP   0.0001  0%  	72	24	0.1	100	100	0	0.1	-29	0%		0/0		1,000,000
 RRPH   0.0014  -30%  	12	10	1.4	24	24	100	1.0	7.6699E6	-30%		-30/-30		843,700
 SLRW @ 0.0035  17%  	0	99	4.8	80	80	-133	1.2	40	-13%		-30/-36		1,504,100
 SNEYD   0.0070  -56%  	1	8	823.3	659	735	106	12.8	948	-53%		-53/-59		64,569,500
 SYPJ   0.0085  0%  	3	10	0.0	0	0	0	0.0	-100	0%		5/5		0
 TFBN   0.0001  0%  	36	34	0.1	114	114	0	1.9	1.0364E7	0%		0/0		1,140,000
 TLAG @ 0.0054  50%  	0	99	112.0	487	622	-250	3.5	201	20%		-24/-24		26,364,200
 UWRL @ 0.0010  11%  	0	99	76.8	2,559	7,676	-48	1.8	-42	-23%		-29/-23		80,801,200
 VGPR   0.0160  0%  	7	2	10.3	13	51	0	7.9	50	-80%		-84/-91		514,800
 VRED @ 0.0013  18%  	0	99	4.7	117	233	-136	0.5	-42	-13%		-28/-35		3,889,200
Death Drop v3.57 - 20100903 (>30% 3 Day Drop or 5 day drop > 50%) -
Google Ron Paul, our Last Hope
We are starting our OWN Company (LINA):
Message Board: http://investorshub.advfn.com/boards/board.aspx?board_id=14808
Website: http://www.LighthouseNova.com
Modifications: Finally aligned the columns! (Sort of)
Graduate Flag: If the symbol has an @ sign
next to it, it means that the stock has risen enough to leave the DD Zone.
Speed is the rate of change today, vs the total 3 day drop
i.e. it is the current "drop speed" of the stock. A negative speed
means the price is rising.
Power is vol today divided by 20 day avg volume. i.e. a power value of 2.6
would mean the volume was 2.6 times the 20 day avg volume.
Torque is the % change in volume today vs yesterday.
Pressure is the dollar amount (in thousands) traded.
Pressure had to be > 10 at one time to be listed.
G is the G-Spot, and is the number of days
in a row it has gone down/stayed even.
D is the Depth, and is the number of days
it has been in Death Drop mode. Will become more accurate atgb.
Volts represents Pressure divided by the Gap (high low range).
Watts represents Pressure divided by the Net (open close range).
 SYMB    Last   Chg     G       D     Pressure Volts  Watts   Speed    Power   Torque   3 Day Drop    (4/5 Day Drop)    Volume

 ADAC   0.0072  -10%  	4	2	8.6	86	430	50	0.3	48	-20%		-37/-17		1,146,000
 BEHL @ 0.0017  42%  	0	99	123.1	2,051	2,462	-313	1.5	104	13%		-6/-15		82,053,400
 BFHJ @ 0.0010  11%  	0	99	3.6	179	179	-122	0.4	-28	-9%		-9/-33		3,986,000
 BLLD @ 0.0120  21%  	0	99	8.9	26	45	-106	1.2	-63	20%		21/10		865,700
 BNYN @ 0.0008  33%  	0	99	0.9	16	47	-167	0.6	-84	-20%		-68/33		1,040,000
 BTDG @ 0.0040  25%  	0	99	1.5	15	30	-150	0.3	-48	-17%		-17/-31		435,000
 CNEX   0.0008  0%  	3	1	15.1	757	15,131	0	0.4	-73	-33%		-20/-33		18,914,200
 CTCC   0.0200  0%  	7	4	4.6	46	46	0	1.8	2.0599E6	0%		-33/-33		226,600
 CWRN   0.0007  0%  	4	2	21.9	2,185	21,851	0	3.1	115	-22%		-30/-13		33,616,800
 DGMA   0.0027  8%  	0	7	60.7	607	1,214	-25	0.6	-66	-33%		-45/-69		22,479,200
 DKGR @ 0.0009  50%  	0	99	1.6	41	41	-275	0.4	-53	-18%		-31/12		2,348,800
 DTRO   0.0040  -5%  	7	5	9.9	124	142	43	0.4	15	-11%		-20/-20		2,259,800
 EGIL   0.0088  -2%  	2	2	0.7	3	3	100	0.1	-82	-2%		-32/-12		95,700
 EGOC   0.0175  -8%  	3	1	2.8	28	28	19	0.6	400	-42%		9/-33		155,000
 ELRA   0.0250  4%  	0	7	6.8	34	68	-48	0.4	-10	9%		4/0		285,100
 EMXC @ 0.0016  14%  	0	99	4.8	96	481	-90	1.0	163	-16%		-20/-33		3,315,000
 ESSE   0.0200  0%  	7	4	0.0	0	0	0	0.0	-100	0%		-20/-20		0
 ETNL   0.0040  0%  	2	13	0.3	14	14	0	0.0	-78	0%		-5/-11		71,500
 EVXA @ 0.0012  9%  	0	99	19.0	633	1,899	-100	0.9	-29	9%		-29/-43		16,511,300
 EXPU   0.0020  -9%  	4	4	5.2	261	261	55	1.0	564	-17%		-20/-9		2,483,500
 EXTO   0.0007  -30%  	2	1	6.8	170	227	60	0.6	-46	-50%		-46/-46		8,499,400
 GELV @ 0.0008  14%  	0	99	28.8	2,883	2,883	-100	0.9	-23	14%		0/-11		38,439,300
 GERSD   0.0006  -25%  	7	1	27.7	1,385	2,770	63	1.0	-14	-40%		-40/-45		39,576,500
 GFGU   0.0130  0%  	4	2	20.0	50	143	0	0.5	-7	-42%		-43/-7		1,536,000
 GRGR   0.0010  0%  	1	2	0.0	0	0	0	0.0	-100	-47%		-44/-44		0
 HRRN   0.0006  -25%  	7	1	70.0	1,399	3,499	75	9.4	784	-33%		-33/-40		82,323,300
 HSCO @ 0.0080  11%  	0	99	5.0	26	4,994	-233	0.2	-54	-5%		14/-24		661,500
 IFRS   0.0052  -5%  	4	2	2.4	24	81	11	0.2	-75	-51%		-77/300		442,800
 IHSN   0.0020  -17%  	7	1	6.8	76	171	54	6.6	491	-31%		-31/-31		3,504,800
 INCC   0.0018  -14%  	3	1	0.1	5	5	29	0.1	-95	-49%		-14/-10		55,000
 ITCJ @ 0.0030  25%  	0	99	9.7	88	138	-39	0.2	-54	-65%		58/-14		3,386,300
 JLIC @ 0.0170  21%  	0	99	1.1	4	1,111	-100	0.2	79	21%		21/13		71,700
 KEPI   0.0079  -21%  	3	1	17.7	24	84	37	12.0	817	-56%		-47/-66		2,824,600
 LAXAF @ 0.0300  20%  	0	99	0.1	75	75	-2E8	0.0	-98	0%		-40/-25		2,500
 MILV @ 0.0055  37%  	0	99	2.4	12	48	-650	1.4	124	6%		-82/-82		403,300
 MMTE   0.0004  -20%  	1	1	37.5	3,746	3,746	60	2.7	-56	-33%		-20/-33		83,235,600
 MMUH   0.0004  -20%  	8	6	4.2	208	417	100	0.3	-59	-20%		-20/-33		10,425,000
 MNDP   0.0017  -15%  	3	1	73.8	2,460	3,690	33	1.3	78	-45%		-6/-6		42,170,900
 NWMT   0.0007  0%  	3	2	104.5	5,223	10,446	0	2.4	65	-36%		-30/-30		149,222,600
 NXTI @ 0.0061  11%  	0	99	0.1	122	122	-41	0.1	0	-27%		-25/-32		20,000
 NXXI   0.0200  2%  	0	2	0.4	436	436	-5	0.0	-93	-33%		-43/0		21,800
 PIHN @ 0.0004  33%  	0	99	28.4	2,838	28,376	-167	1.3	-64	-20%		-20/0		81,074,600
 PYBX @ 0.0004  33%  	0	99	6.6	656	656	-167	0.3	58	-20%		-20/-20		18,741,000
 QEGY   0.0022  0%  	70	71	0.0	0	0	0	0.0	-100	0%		0/0		0
 QOIL   0.0040  29%  	0	1	1,811.6	3,123	25,879	-58	19.5	14199	-50%		-50/-60		603,850,500
 RELM   0.0003  0%  	6	2	4.2	4,156	4,156	0	0.6	-40	-25%		-40/-40		13,854,300
 RICP   0.0001  0%  	71	23	0.1	140	140	0	0.1	1.2727E7	0%		0/0		1,400,000
 RPPR @ 0.0134  123%  	0	99	1,482.0	793	2,087	-36	10.5	134	347%		168/168		94,696,900
 RRPH   0.0020  0%  	11	9	0.0	0	0	0	0.0	-100	0%		0/0		0
 SLRW   0.0030  -25%  	4	1	3.6	59	59	63	0.8	74	-40%		-45/-29		1,077,700
 SNEYD   0.0159  3%  	0	7	108.4	226	10,840	-43	3.4	1	6%		-6/-12		6,159,200
 SRCP @ 0.0040  25%  	0	99	147.8	672	2,956	-118	4.2	284	21%		0/-11		33,592,000
 SYPJ   0.0085  0%  	2	9	0.0	0	0	0	0.0	-100	5%		5/13		0
 TFBN   0.0001  0%  	35	33	0.0	0	0	0	0.0	-100	0%		0/0		0
 TLAG   0.0036  -10%  	4	2	27.6	212	1,381	20	1.4	144	-49%		-49/57		8,767,300
 UDHC @ 0.0130  18%  	0	99	3.3	19	19	-218	0.3	-43	8%		-4/-2		268,400
 UWRL   0.0009  -10%  	3	1	118.1	3,938	11,814	28	3.3	56	-36%		-31/-31		138,984,600
 VGPR   0.0160  0%  	6	1	9.6	4	9,584	0	8.7	-2	-84%		-91/-91		342,300
 VRED   0.0011  -15%  	5	3	8.1	202	270	40	0.8	-34	-39%		-45/-54		6,740,100
 VTPID   0.0300  0%  	5	3	0.3	270	270	0	0.0	18	0%		-40/-40		9,000
Death Drop v3.57 - 20100902 (>30% 3 Day Drop or 5 day drop > 50%) -
Google Ron Paul, our Last Hope
We are starting our OWN Company (LINA):
Message Board: http://investorshub.advfn.com/boards/board.aspx?board_id=14808
Website: http://www.LighthouseNova.com
Modifications: Finally aligned the columns! (Sort of)
Graduate Flag: If the symbol has an @ sign
next to it, it means that the stock has risen enough to leave the DD Zone.
Speed is the rate of change today, vs the total 3 day drop
i.e. it is the current "drop speed" of the stock. A negative speed
means the price is rising.
Power is vol today divided by 20 day avg volume. i.e. a power value of 2.6
would mean the volume was 2.6 times the 20 day avg volume.
Torque is the % change in volume today vs yesterday.
Pressure is the dollar amount (in thousands) traded.
Pressure had to be > 10 at one time to be listed.
G is the G-Spot, and is the number of days
in a row it has gone down/stayed even.
D is the Depth, and is the number of days
it has been in Death Drop mode. Will become more accurate atgb.
Volts represents Pressure divided by the Gap (high low range).
Watts represents Pressure divided by the Net (open close range).
 SYMB    Last   Chg     G       D     Pressure Volts  Watts   Speed    Power   Torque   3 Day Drop    (4/5 Day Drop)    Volume

 ADAC   0.0080  0%  	3	1	6.6	22	132	0	0.2	-80	-30%		-8/-23		773,700
 APCX @ 0.0006  20%  	0	99	189.5	4,737	1.8949E5	-140	3.0	1240	-14%		-25/-40		270,694,600
 BEHL   0.0012  -8%  	15	13	54.3	1,810	1,810	23	0.8	-38	-33%		-40/-40		40,227,300
 BFHJ   0.0009  -10%  	5	2	5.2	174	523	55	0.5	-56	-18%		-40/-40		5,507,500
 BLLD   0.0099  4%  	0	7	23.8	68	113	-4.211E7	3.3	195	0%		-9/-1		2,318,400
 BNYN   0.0006  -14%  	3	1	3.9	195	389	19	3.7	107	-76%		0/100		6,484,000
 BTDG   0.0032  -26%  	5	3	3.4	20	20	77	0.6	-34	-33%		-45/-64		832,600
 CTCC   0.0200  0%  	6	3	0.0	0	0	0	0.0	-100	-33%		-33/-43		0
 CWRN   0.0007  -13%  	3	1	11.7	1,173	1,173	42	1.5	-37	-30%		-13/-13		15,644,900
 CYBL @ 0.0112  11%  	0	99	7.1	47	64	-599	0.1	8	2%		2/-14		658,300
 DGMA   0.0025  9%  	0	6	222.6	1,012	22,265	-18	1.7	-41	-49%		-71/-72		65,484,000
 DKGR   0.0006  -14%  	3	1	3.5	87	173	27	0.8	-77	-54%		-25/-33		4,946,200
 DTRO   0.0042  0%  	6	4	8.6	78	8,556	0	0.3	-36	-16%		-16/-18		1,967,000
 EFIR @ 0.0015  36%  	0	99	86.3	1,727	4,317	-3.636E8	2.7	-49	0%		-17/-32		63,952,400
 EGIL   0.0090  -10%  	1	1	4.2	21	84	33	0.7	-19	-31%		-10/-25		526,700
 ELRA   0.0240  -4%  	1	6	7.8	78	78	4E7	0.4	81	0%		-4/0		317,900
 EMXC   0.0014  -22%  	4	1	2.0	50	50	74	0.4	-76	-30%		-42/-33		1,259,900
 ESSE   0.0200  0%  	6	3	0.0	0	0	0	0.0	-100	-20%		-20/-33		0
 ESYR @ 0.0027  575%  	0	99	1,392.6	974	6,963	-164	11.0	1222	350%		286/200		177,402,200
 ETNL   0.0040  -2%  	1	12	1.3	32	64	51	0.1	-67	-5%		-11/-15		320,600
 EVXA   0.0011  -8%  	1	1	26.6	888	2,663	24	1.2	-71	-35%		-48/-42		23,157,800
 EXPU   0.0022  0%  	3	3	1.0	12	972	0	0.2	-93	-12%		0/-41		373,900
 GAZU   0.0270  -10%  	3	2	21.8	16	21	16	1.9	-86	-61%		-40/-40		679,200
 GELV   0.0007  0%  	8	3	37.3	3,731	3,731	0	1.1	76	-13%		-22/-36		49,740,200
 GFGU   0.0130  -13%  	3	1	20.7	42	104	31	0.6	-82	-43%		-7/271		1,649,800
 GRGR   0.0010  100%  	0	1	10.0	3	249	-225	3.9	512	-44%		-44/-44		642,100
 HSCO   0.0072  -15%  	1	3	10.8	108	135	535	0.5	76	3%		-31/-67		1,437,400
 IFRS   0.0055  -5%  	3	1	12.8	29	426	7	0.9	4	-76%		323/686		1,776,800
 ITCJ   0.0024  -27%  	2	2	21.9	122	199	104	0.4	-92	26%		-31/-73		7,301,800
 JLIC   0.0140  0%  	6	4	0.6	560	560	0	0.1	-78	0%		-7/-18		40,000
 LAXAF   0.0250  -4%  	3	2	3.9	8	3,872	8	0.9	-76	-50%		-37/-29		140,800
 MILV   0.0040  -13%  	4	1	0.7	4	11	15	0.7	-82	-87%		-87/-33		180,000
 MMTE @ 0.0005  25%  	0	99	104.3	3,477	10,431	-2.5E8	6.4	1663	0%		-17/0		189,663,600
 MMUH   0.0005  0%  	7	5	10.2	508	1,017	0	0.6	61	0%		-17/-17		25,422,100
 MSOA @ 0.0009  80%  	0	99	10.1	335	335	-280	0.3	1	29%		-25/-40		13,413,300
 NWMT   0.0007  -22%  	2	1	67.7	2,256	67,695	74	1.6	-58	-30%		-30/-36		90,259,700
 NWTT @ 0.0002  100%  	0	99	25.9	2,594	25,940	-300	2.1	249	-33%		-33/-33		172,932,000
 NXTI   0.0055  -34%  	2	11	0.1	1	1	105	0.1	1.8172E5	-32%		-39/-39		20,000
 NXXI   0.0197  -21%  	3	1	6.4	32	49	48	0.3	18	-44%		-2/9		318,500
 PIHN   0.0003  -25%  	3	1	91.2	4,562	4,562	63	3.3	-41	-40%		-25/-25		228,117,300
 PPBL @ 0.0250  56%  	0	99	7.6	8	8	-338	0.5	10	-17%		0/43		377,300
 PYBX   0.0003  -40%  	5	1	4.2	416	416	100	0.2	250	-40%		-40/-57		11,889,600
 QASP @ 0.0026  13%  	0	99	36.1	902	1,203	-126	0.4	-62	-10%		-26/-33		15,034,000
 QEGY   0.0022  0%  	69	70	0.0	1	1	0	0.2	2627	0%		0/-27		300
 QMIN @ 0.0007  17%  	0	99	0.9	93	93	-133	0.1	-92	-13%		-30/-30		1,239,100
 RELM   0.0003  -25%  	5	1	8.1	806	806	63	1.1	-68	-40%		-40/-40		23,016,200
 RICP   0.0001  0%  	70	22	0.0	0	0	0	0.0	-100	0%		0/0		0
 RPPR   0.0060  67%  	0	1	214.6	383	894	-333	9.5	139	20%		20/-65		40,488,400
 RRPH   0.0020  0%  	10	8	0.3	300	300	0	0.2	-57	0%		0/0		150,000
 SECI @ 0.0195  13%  	0	99	3.8	9	17	-535	1.4	-50	-3%		-3/-3		222,800
 SNEYD   0.0155  5%  	0	6	94.6	473	1,892	-54	4.0	-29	-9%		-14/-33		6,101,700
 SRCP   0.0032  7%  	0	2	24.9	356	830	-33	1.4	261	-20%		-29/7		8,738,400
 SYPJ   0.0085  0%  	1	8	0.0	0	0	0	0.0	-100	5%		13/6		0
 TFBN   0.0001  0%  	34	32	0.3	260	260	0	4.8	3367	0%		0/0		2,600,000
 TLAG   0.0040  -11%  	3	1	14.3	72	143	25	0.6	-40	-44%		74/264		3,587,200
 TTDZ @ 0.0002  100%  	0	99	0.8	83	83	-100	0.6	5E7	100%		100/100		5,500,000
 UDHC   0.0110  -4%  	3	5	5.0	50	4,981	23	0.5	98	-19%		-17/-29		474,400
 VIVK @ 0.0090  29%  	0	99	3.4	34	34	-100	1.4	3974	29%		-10/-10		399,300
 VRED   0.0013  -13%  	4	2	14.3	239	358	38	1.3	1260	-35%		-46/-35		10,236,300
 VTPID   0.0300  0%  	4	2	0.2	228	228	0	0.0	-82	-40%		-40/2.99E4		7,600
 WTGI @ 0.0070  536%  	0	99	0.0	14	14	-100	20.0	18082	536%		536/536		2,000
Death Drop v3.57 - 20100901 (>30% 3 Day Drop or 5 day drop > 50%) -
Google Ron Paul, our Last Hope
We are starting our OWN Company (LINA):
Message Board: http://investorshub.advfn.com/boards/board.aspx?board_id=14808
Website: http://www.LighthouseNova.com
Modifications: Finally aligned the columns! (Sort of)
Graduate Flag: If the symbol has an @ sign
next to it, it means that the stock has risen enough to leave the DD Zone.
Speed is the rate of change today, vs the total 3 day drop
i.e. it is the current "drop speed" of the stock. A negative speed
means the price is rising.
Power is vol today divided by 20 day avg volume. i.e. a power value of 2.6
would mean the volume was 2.6 times the 20 day avg volume.
Torque is the % change in volume today vs yesterday.
Pressure is the dollar amount (in thousands) traded.
Pressure had to be > 10 at one time to be listed.
G is the G-Spot, and is the number of days
in a row it has gone down/stayed even.
D is the Depth, and is the number of days
it has been in Death Drop mode. Will become more accurate atgb.
Volts represents Pressure divided by the Gap (high low range).
Watts represents Pressure divided by the Net (open close range).
 SYMB    Last   Chg     G       D     Pressure Volts  Watts   Speed    Power   Torque   3 Day Drop    (4/5 Day Drop)    Volume

 APCX   0.0005  -17%  	8	6	11.1	1,111	1,111	44	0.3	-63	-38%		-50/-50		20,194,200
 APRM @ 0.0200  29%  	0	99	0.4	400	400	-100	0.2	1.8172E5	29%		33/33		20,000
 BEHL   0.0013  -13%  	14	12	91.0	2,276	4,552	38	1.3	2	-35%		-35/-35		65,024,400
 BFHJ   0.0010  -9%  	4	1	14.3	477	716	27	1.2	6	-33%		-33/-23		12,444,600
 BLLD   0.0095  -5%  	1	6	6.7	22	133	39	1.3	211	-13%		-5/-5		784,700
 BTDG   0.0043  -10%  	4	2	5.6	56	188	40	0.9	275	-26%		-52/-10		1,253,600
 CMGR   0.0026  -35%  	8	8	2.2	12	16	52	1.4	-33	-68%		-68/-74		638,000
 CTCC   0.0200  0%  	5	2	3.1	3,150	3,150	0	1.3	-39	-33%		-43/-43		157,500
 CYBL   0.0101  1%  	0	5	6.6	44	74	-12	0.1	-70	-8%		-22/-47		611,700
 DGMA   0.0023  -43%  	6	5	343.1	1,225	1,560	58	3.1	-38	-73%		-74/-75		110,686,500
 DTRO   0.0042  -7%  	5	3	12.2	61	407	42	0.5	-59	-16%		-18/-48		3,054,000
 EFIR   0.0011  -15%  	4	2	186.7	2,333	9,333	40	5.9	388	-39%		-50/-8		124,434,800
 ELRA   0.0250  9%  	0	5	4.8	10	10	-8.696E7	0.2	37	0%		4/-29		175,700
 ESSE   0.0200  0%  	5	2	0.0	4	4	0	0.0	-100	-20%		-33/-33		200
 ESYR   0.0004  -20%  	8	6	6.7	335	335	47	1.8	-35	-43%		-56/-64		13,417,900
 ETNL   0.0041  3%  	0	11	4.0	201	201	-28	0.3	-56	-9%		-13/-18		959,000
 EVXA @ 0.0012  9%  	0	99	90.8	1,817	9,085	-21	4.4	-24	-43%		-37/-33		78,996,900
 EXOU @ 0.0050  11%  	0	99	1.0	1,025	1,025	-67	0.1	-72	-17%		-23/-17		205,000
 EXPU   0.0022  -8%  	2	2	12.4	178	621	8.333E7	2.1	33	0%		-41/-29		5,071,500
 EXRG @ 0.0060  20%  	0	99	2.3	46	77	-66	0.4	-53	30%		50/62		399,600
 GAZU   0.0300  -33%  	2	1	270.1	40	90	100	14.6	7924	-33%		-33/-57		4,814,300
 GELV   0.0007  0%  	7	2	21.2	2,120	21,203	0	0.7	-51	-22%		-36/-36		28,270,000
 HNSS @ 0.0065  86%  	0	99	5.4	27	36	-193	0.5	-26	44%		18/-2		982,000
 HSCO   0.0085  1%  	0	2	6.5	33	130	-6	0.3	-85	-19%		-61/55		814,800
 IFMX @ 0.0080  70%  	0	99	0.4	1	1	-117	0.1	5800	60%		23/7		59,000
 ITCJ   0.0033  -61%  	1	1	409.8	911	1,108	1071	5.0	75	-6%		-63/-63		86,280,100
 JLIC   0.0140  0%  	5	3	2.5	51	2,526	0	0.3	1101	-7%		-18/-30		183,700
 KSQR @ 0.0085  143%  	0	99	40.5	30	116	-364	4.7	134	-39%		-43/-43		3,971,800
 LAXAF   0.0260  -13%  	2	1	18.9	13	47	38	3.9	-38	-35%		-26/-42		581,100
 MDIN @ 0.0005  67%  	0	99	1.3	65	130	-400	0.3	-86	-17%		-17/-38		2,595,000
 MMTE   0.0004  -33%  	1	1	5.4	269	538	100	0.5	40	-33%		-20/-20		10,757,900
 MMUH   0.0005  0%  	6	4	7.1	711	711	0	0.4	-15	-17%		-17/-44		15,790,000
 MSOA   0.0005  -17%  	4	4	7.3	730	730	29	0.3	-58	-58%		-67/-58		13,276,100
 MTRO   0.0300  0%  	3	3	0.3	300	300	0	0.0	-50	-14%		-9/-42		10,000
 NWTT   0.0001  -50%  	14	12	7.4	743	743	75	0.7	-82	-67%		-67/-67		49,553,500
 NXTI   0.0083  0%  	1	10	0.0	0	0	0	0.0	-100	-8%		-8/-8		0
 PCLI @ 0.0009  12%  	0	99	1.7	1,708	1,708	-100	0.1	-80	12%		12/-10		1,898,000
 PPBL   0.0160  -28%  	2	1	6.3	12	13	77	0.4	-83	-36%		-9/-52		341,800
 PSGI @ 0.0038  27%  	0	99	11.1	85	101	-142	3.1	102	19%		9/9		3,306,500
 QASP   0.0023  -18%  	4	1	100.6	1,117	1,676	52	1.1	131	-34%		-41/-18		39,439,400
 QEGY   0.0022  0%  	68	69	0.0	0	0	0	0.0	-100	0%		-27/-27		0
 QMIN   0.0006  -14%  	4	2	11.0	552	1,104	36	1.2	3	-40%		-40/-25		15,768,700
 RICP   0.0001  0%  	69	21	0.2	205	205	0	0.1	10	0%		0/0		2,045,000
 RPPR @ 0.0036  20%  	0	99	56.7	298	810	-71	7.6	-38	-28%		-79/-79		16,925,000
 RRPH   0.0020  0%  	9	7	0.7	701	701	0	0.4	1635	0%		0/0		350,500
 SECI   0.0172  1%  	0	6	8.6	18	108	-4	2.9	2905	-14%		-14/-14		441,800
 SHAR @ 0.0008  33%  	0	99	3.7	122	183	-167	0.9	-9	-20%		-20/-43		5,617,500
 SNEYD   0.0148  -1%  	5	5	135.8	617	1,358	7	7.0	739	-18%		-36/-42		8,542,500
 SNWT @ 0.0110  10%  	0	99	9.5	95	190	-128	1.4	-28	8%		-2/-21		824,100
 SRCP   0.0030  -9%  	3	1	6.8	169	677	27	0.4	-65	-33%		0/3		2,417,900
 SYPJ   0.0085  5%  	0	7	0.0	10	10	-37	0.0	10809	13%		6/6		1,200
 TFBN   0.0001  0%  	33	31	0.0	8	8	0	0.2	-79	0%		0/0		75,000
 TTDZ   0.0001  0%  	25	16	0.0	0	0	0	0.0	-100	0%		0/0		0
 UDHC   0.0115  -4%  	2	4	2.9	29	29	32	0.3	264	-13%		-26/-28		240,000
 UNGS @ 0.0270  59%  	0	99	60.2	75	86	-588	3.7	-17	-10%		-4/-33		2,506,800
 UTRM @ 0.0045  29%  	0	99	8.1	90	162	-286	3.2	-32	-10%		-10/-18		1,997,800
 VIVK   0.0070  0%  	5	3	0.1	1	73	0	0.0	-86	-30%		-30/-42		9,800
 VPER @ 0.0017  21%  	0	99	2.9	71	95	-42	0.8	-84	-51%		-43/-29		1,903,300
 VRED   0.0015  -17%  	3	1	1.2	41	41	44	0.1	-95	-37%		-25/-25		752,500
 VTPID   0.0300  0%  	3	1	1.3	1	1	0	0.0	-19	-40%		2.99E4/2.99E4		41,500
 XYNH @ 0.0013  44%  	0	99	13.2	220	329	-4.444E8	0.7	48	0%		-13/0		10,980,800
Death Drop v3.57 - 20100831 (>30% 3 Day Drop or 5 day drop > 50%) -
Google Ron Paul, our Last Hope
We are starting our OWN Company (LINA):
Message Board: http://investorshub.advfn.com/boards/board.aspx?board_id=14808
Website: http://www.LighthouseNova.com
Modifications: Finally aligned the columns! (Sort of)
Graduate Flag: If the symbol has an @ sign
next to it, it means that the stock has risen enough to leave the DD Zone.
Speed is the rate of change today, vs the total 3 day drop
i.e. it is the current "drop speed" of the stock. A negative speed
means the price is rising.
Power is vol today divided by 20 day avg volume. i.e. a power value of 2.6
would mean the volume was 2.6 times the 20 day avg volume.
Torque is the % change in volume today vs yesterday.
Pressure is the dollar amount (in thousands) traded.
Pressure had to be > 10 at one time to be listed.
G is the G-Spot, and is the number of days
in a row it has gone down/stayed even.
D is the Depth, and is the number of days
it has been in Death Drop mode. Will become more accurate atgb.
Volts represents Pressure divided by the Gap (high low range).
Watts represents Pressure divided by the Net (open close range).
 SYMB    Last   Chg     G       D     Pressure Volts  Watts   Speed    Power   Torque   3 Day Drop    (4/5 Day Drop)    Volume

 APCX   0.0006  -14%  	7	5	32.5	1,623	3,246	36	0.7	-8	-40%		-40/-54		54,096,100
 APRM   0.0155  0%  	2	3	0.0	0	0	0	0.0	-100	3%		3/-68		0
 BEHL   0.0015  -17%  	13	11	105.5	2,110	2,637	67	1.4	0	-25%		-25/-25		63,927,400
 BLLD   0.0100  1%  	0	5	2.1	6	2,081	-1.01E7	0.4	-70	0%		0/0		252,300
 BTDG   0.0048  0%  	3	1	1.6	52	52	0	0.3	-73	-46%		0/-26		334,500
 CLDR @ 0.0015  50%  	0	99	35.3	504	706	-700	1.5	759	7%		25/0		30,678,500
 CMGR   0.0040  -50%  	7	7	5.7	14	14	100	2.2	41	-50%		-60/-60		950,200
 CNEX @ 0.0012  20%  	0	99	101.1	3,371	1.0114E5	-2E8	2.0	118	0%		-8/-14		87,948,000
 CTCC   0.0200  -33%  	4	1	6.5	6	6	78	2.3	-68	-43%		-43/-34		258,000
 CYBL   0.0100  -9%  	5	4	22.9	91	1,143	39	0.3	-10	-23%		-47/-50		2,031,200
 DGMA   0.0040  -18%  	5	4	1,147.1	2,012	6,373	33	5.9	389	-56%		-57/-76		177,838,300
 DTRO   0.0045  -10%  	4	2	35.4	236	354	85	1.2	-81	-12%		-44/0		7,450,000
 EFIR   0.0013  -13%  	3	1	36.9	739	923	33	1.7	-10	-41%		8/-28		25,473,100
 ELRA   0.0230  -4%  	2	4	3.3	6	33	100	0.1	-87	-4%		-34/-18		128,600
 ESSE   0.0200  -20%  	4	1	7.5	10	10	60	8.1	802	-33%		-33/-29		315,600
 ESYR   0.0005  -17%  	7	5	10.3	516	1,032	37	3.0	46	-44%		-55/-55		20,639,600
 ETNL   0.0040  -5%  	6	10	9.6	121	965	32	0.6	23	-15%		-20/-20		2,192,800
 EVXA   0.0011  -35%  	2	1	160.5	1,783	2,675	84	7.2	662	-42%		-39/-35		103,536,300
 EXOU   0.0045  -10%  	3	8	3.9	26	26	33	0.5	0	-31%		-25/-25		741,100
 EXPU   0.0024  -4%  	1	1	8.8	220	879	11	1.7	7540	-35%		-23/9		3,820,000
 EXRG   0.0050  0%  	1	3	4.4	40	4,404	0	0.9	176	25%		35/-29		855,200
 GELV   0.0007  -13%  	6	1	43.0	4,299	42,992	34	1.4	0	-36%		-36/-36		57,322,800
 HCKI @ 0.0010  25%  	0	99	0.1	2	2	-88	0.0	-96	-29%		-60/-44		83,500
 HNSS   0.0035  -36%  	1	1	6.7	21	34	100	0.7	12	-36%		-47/-42		1,322,800
 HSCO   0.0084  20%  	0	1	40.4	212	448	-32	1.9	14	-62%		53/342		5,346,100
 IFMX   0.0047  4%  	0	9	0.0	5	5	-16	0.0	-99	-28%		-37/-53		1,000
 IFXY @ 0.0036  16%  	0	99	5.9	85	197	-161	1.5	-62	-10%		-22/-14		1,767,100
 ILVC @ 0.0200  21%  	0	99	4.4	11	11	-2.121E8	0.5	-73	0%		-18/3		243,700
 JLIC   0.0140  0%  	4	2	0.2	214	214	0	0.0	-97	-18%		-30/-10		15,300
 KSQR   0.0035  -59%  	6	4	8.7	26	44	77	2.6	-32	-77%		-77/-78		1,694,700
 MDIN   0.0003  -25%  	5	3	6.7	668	668	50	2.4	-19	-50%		-63/-67		19,080,300
 MMUH   0.0005  0%  	5	3	8.4	838	838	0	0.4	-87	-17%		-44/-50		18,631,000
 MSOA   0.0006  -14%  	3	3	25.2	631	631	24	0.7	-6	-60%		-50/-76		31,541,800
 MTRO   0.0300  0%  	2	2	0.6	600	600	0	0.1	-86	-9%		-42/-40		20,000
 NWTT   0.0002  -33%  	13	11	54.6	2,732	5,464	100	3.5	162	-33%		-33/-33		273,222,600
 NXTI   0.0083  2%  	0	9	1.4	8	1,373	-32	0.8	200	-8%		-8/-8		150,000
 PCLI   0.0008  0%  	10	9	8.0	266	7,969	0	0.6	-29	0%		-20/-27		9,375,200
 PSGI   0.0030  0%  	7	5	4.8	161	4,821	0	1.7	60	-14%		-14/-35		1,634,400
 PSRU @ 0.0037  23%  	0	99	13.5	135	193	-311	1.1	47	-7%		-26/-39		3,867,700
 QEGY   0.0022  0%  	67	68	0.0	0	0	0	0.0	-100	-27%		-27/-27		0
 QMIN   0.0007  -13%  	3	1	11.5	1,147	1,147	42	1.2	72	-30%		-13/40		15,292,400
 RICP   0.0001  0%  	68	20	0.3	28	279	0	0.1	-57	0%		0/0		1,860,000
 RPPR   0.0030  -40%  	52	1	82.2	206	822	49	19.7	1.0532E5	-82%		-82/-82		27,408,600
 RRPH   0.0020  0%  	8	6	0.0	40	40	0	0.0	-42	0%		0/0		20,200
 SECI   0.0171  -14%  	5	5	0.3	1	273	100	0.1	-91	-14%		-14/-32		14,700
 SHAR   0.0006  -14%  	7	6	4.3	215	215	36	1.0	-85	-40%		-57/-63		6,140,900
 SNEYD   0.0150  -12%  	4	4	14.8	49	148	34	1.3	-82	-35%		-41/-29		1,018,000
 SNWT   0.0100  0%  	10	5	12.2	82	82	0	2.0	317	-11%		-29/-33		1,137,400
 SSWC @ 0.0006  20%  	0	99	89.6	4,478	89,553	-80	2.0	2	-25%		-25/-33		149,254,900
 SYPJ   0.0081  0%  	1	6	0.0	0	0	0	0.0	-100	1%		1/1		0
 TFBN   0.0001  0%  	32	30	0.0	35	35	0	0.9	3.1817E6	0%		0/0		350,000
 TTDZ   0.0001  0%  	24	15	0.0	0	0	0	0.0	-100	0%		0/0		0
 UDHC   0.0120  -11%  	1	3	0.8	5	5	49	0.1	-82	-23%		-25/-38		66,000
 UNDT @ 0.0008  33%  	0	99	1.1	56	56	-233	0.4	-40	14%		0/-11		1,603,000
 UNGS   0.0170  -43%  	2	1	65.1	50	59	110	5.5	459	-39%		-58/-58		3,028,500
 UTRM   0.0035  -22%  	10	1	11.1	222	222	74	5.2	1511	-30%		-36/-36		2,956,200
 VIVK   0.0070  0%  	4	2	0.6	3	568	0	0.2	-32	-30%		-42/-39		71,000
 VPER   0.0014  -7%  	2	2	17.7	161	295	13	5.4	10	-53%		-42/-59		12,206,100
 XYNH   0.0009  0%  	3	4	6.0	298	595	0	0.5	22	-40%		-31/-40		7,439,200
I bet he's lucky if he is...
sweet, i think zardi(the mod) is in that.
One on the list - just reduced their A/S from 5Billion to 250Million. HBWO.
Just gotta weed thru the POS from the possible bounceback plays. GL
Thanks. Really interesting breakdown. I hold a few of those on the list and data seems useful and as importantly, accurate.
Death Drop v3.57 - 20100830 (>30% 3 Day Drop or 5 day drop > 50%) -
Google Ron Paul, our Last Hope
We are starting our OWN Company (LINA):
Message Board: http://investorshub.advfn.com/boards/board.aspx?board_id=14808
Website: http://www.LighthouseNova.com
Modifications: Finally aligned the columns! (Sort of)
Graduate Flag: If the symbol has an @ sign
next to it, it means that the stock has risen enough to leave the DD Zone.
Speed is the rate of change today, vs the total 3 day drop
i.e. it is the current "drop speed" of the stock. A negative speed
means the price is rising.
Power is vol today divided by 20 day avg volume. i.e. a power value of 2.6
would mean the volume was 2.6 times the 20 day avg volume.
Torque is the % change in volume today vs yesterday.
Pressure is the dollar amount (in thousands) traded.
Pressure had to be > 10 at one time to be listed.
G is the G-Spot, and is the number of days
in a row it has gone down/stayed even.
D is the Depth, and is the number of days
it has been in Death Drop mode. Will become more accurate atgb.
Volts represents Pressure divided by the Gap (high low range).
Watts represents Pressure divided by the Net (open close range).
 SYMB    Last   Chg     G       D     Pressure Volts  Watts   Speed    Power   Torque   3 Day Drop    (4/5 Day Drop)    Volume

 APCX   0.0007  -13%  	6	4	44.1	1,469	2,203	42	0.8	-53	-30%		-46/-59		58,746,200
 APRM   0.0155  0%  	1	2	0.0	0	0	0	0.0	-100	3%		-68/-65		0
 BEHL   0.0018  -10%  	12	10	118.2	2,365	5,912	100	1.5	132	-10%		-10/-22		63,913,700
 BLLD   0.0099  -9%  	1	4	8.6	12	41	917	1.2	-47	-1%		-1/-17		843,500
 BYSD @ 0.0009  12%  	0	99	9.8	9,797	9,797	-1.25E8	2.5	642	0%		0/0		10,885,200
 CITC @ 0.0009  12%  	0	99	1.8	58	58	-1.25E8	0.6	26	0%		0/-25		2,336,700
 CLDR   0.0010  0%  	2	2	3.9	196	196	0	0.2	-59	-17%		-33/-44		3,572,300
 CMGR   0.0080  0%  	6	6	5.0	17	50	0	1.7	305	-20%		-20/-33		671,800
 CNEX   0.0010  -17%  	5	3	48.3	1,208	4,832	72	1.0	153	-23%		-29/-44		40,266,500
 CYBL   0.0110  0%  	4	3	28.4	58	28,428	0	0.3	-66	-42%		-45/-44		2,265,200
 DGMA   0.0049  -43%  	4	3	283.9	444	557	92	1.7	21	-47%		-71/-64		36,396,200
 DNDT @ 0.0180  122%  	0	99	1.8	2	2	-100	1.3	1.1617E6	122%		122/125		127,800
 DTRO   0.0050  0%  	3	1	245.5	701	1,228	0	6.3	205	-38%		11/138		39,283,300
 ELRA   0.0240  -4%  	1	3	28.5	36	95	13	1.0	1344	-31%		-14/-37		1,016,400
 ESYR   0.0006  -14%  	6	4	7.8	778	7,778	31	2.4	84	-45%		-45/-45		14,142,100
 ETNL   0.0042  -7%  	5	9	8.0	134	201	42	0.5	-49	-16%		-16/-19		1,783,900
 EXOU   0.0050  -17%  	2	7	3.3	33	3,343	100	0.5	-59	-17%		-17/-17		742,900
 EXRG   0.0050  9%  	0	2	1.6	1,550	1,550	-25	0.3	-66	35%		-29/0		310,000
 FEEL @ 0.0090  14%  	0	99	0.5	4	4	-1.392E8	0.2	-41	0%		-10/-10		56,100
 HBWO @ 0.0260  67%  	0	99	2.3	2	5	-367	0.1	-33	18%		37/8		99,200
 HCKI   0.0008  -27%  	3	2	1.9	19	47	40	0.5	-78	-68%		-56/-53		2,072,900
 HNSS @ 0.0055  22%  	0	99	5.3	27	38	-133	0.7	-66	-17%		-8/-52		1,183,600
 IFMX   0.0045  -10%  	7	8	0.7	5	15	25	0.4	136	-40%		-55/-62		176,000
 IFXY   0.0031  -23%  	3	1	14.5	208	364	69	3.9	833	-33%		-26/-38		4,619,000
 ILVC   0.0165  -17%  	3	1	18.8	22	22	54	1.8	4381	-32%		-15/3		905,100
 JLIC   0.0140  -7%  	3	1	6.4	64	212	25	0.8	223	-30%		-10/-15		461,500
 KSQR   0.0085  -39%  	5	3	28.6	41	44	91	4.4	560	-43%		-47/-65		2,490,700
 MDIN   0.0004  -33%  	4	2	11.8	294	392	67	3.4	83	-50%		-56/-43		23,528,400
 MMUH   0.0005  -17%  	4	2	73.8	3,692	7,383	37	3.4	75	-44%		-50/-29		147,669,800
 MSOA   0.0007  -42%  	2	2	31.9	639	1,064	100	0.7	139	-42%		-72/-13		33,607,900
 MTRO   0.0300  -14%  	1	1	4.5	2	4	34	0.6	-81	-42%		-40/-43		144,700
 NSMSF @ 0.0060  200%  	0	99	0.5	5	461	-200	0.4	7.6172E5	100%		28/-26		83,800
 NWTT   0.0003  0%  	12	10	31.3	1,563	31,260	0	1.5	705	0%		0/0		104,200,900
 NXTI   0.0081  -10%  	4	8	0.5	1	2	100	0.3	4.5445E5	-10%		-10/-6		50,000
 OPTZ @ 0.0090  10%  	0	99	1.5	19	19	-9.756E7	0.4	-28	0%		6/-12		176,000
 PCLI   0.0008  0%  	9	8	11.3	376	1,129	0	0.9	-79	-20%		-27/-27		13,280,300
 PSGI   0.0030  -6%  	6	4	3.4	26	34	44	1.0	142	-14%		-35/-37		1,018,500
 PSRU   0.0030  -23%  	6	5	8.4	60	93	58	0.8	-54	-40%		-51/-73		2,624,700
 QEGY   0.0022  0%  	66	67	0.0	0	0	0	0.0	-100	-27%		-27/-27		0
 RICP   0.0001  0%  	67	19	0.4	430	430	0	0.2	187	0%		0/0		4,300,000
 RRPH   0.0020  0%  	7	5	0.1	69	69	0	0.0	3.1445E5	0%		0/-9		34,600
 SECI   0.0200  0%  	4	4	3.2	319	3,188	0	0.9	78	0%		-20/-17		159,800
 SHAR   0.0007  -30%  	6	5	29.7	595	991	60	6.4	948	-50%		-56/-72		39,646,800
 SMPP @ 0.0002  100%  	0	99	2.0	203	203	-300	0.1	-64	-33%		-33/-33		13,539,900
 SNEYD   0.0170  -6%  	3	3	85.3	142	853	17	7.5	32	-33%		-19/-89		5,684,200
 SNWT   0.0100  -2%  	9	4	2.9	20	20	7	0.5	-83	-29%		-33/-41		272,500
 SSWC   0.0005  -29%  	10	1	95.5	3,182	3,182	76	2.0	526	-38%		-44/-44		146,854,200
 SYPJ   0.0081  8%  	0	5	0.3	5	5	-640	0.1	2233	1%		1/-19		35,000
 TFBN   0.0001  0%  	31	29	0.0	0	0	0	0.0	-100	0%		0/0		0
 TITL @ 0.0100  11%  	0	99	5.2	10	64	-48	0.4	-69	-23%		-29/-33		606,600
 TTDZ   0.0001  0%  	23	14	0.5	500	500	0	0.6	400	0%		0/0		5,000,000
 UDHC   0.0135  2%  	0	2	5.3	36	107	-15	0.4	-48	-16%		-30/-16		374,400
 UNDT   0.0006  0%  	5	3	1.7	58	174	0	0.6	-79	-25%		-33/-45		2,672,100
 VCTY @ 0.0072  11%  	0	99	29.7	297	1,484	-377	0.7	27	3%		3/-17		4,241,200
 VIVK   0.0070  -30%  	3	1	0.9	3	4	72	0.4	-34	-42%		-39/-46		104,000
 VPER   0.0015  -57%  	1	1	26.1	154	174	152	5.9	1595	-37%		-56/-56		11,105,300
 XYNH   0.0009  -31%  	2	3	7.0	140	140	100	0.4	48	-31%		-40/-59		6,095,800
Death Drop v3.57 - 20100827 (>30% 3 Day Drop or 5 day drop > 50%) -
Google Ron Paul, our Last Hope
We are starting our OWN Company (LINA):
Message Board: http://investorshub.advfn.com/boards/board.aspx?board_id=14808
Website: http://www.LighthouseNova.com
Modifications: Finally aligned the columns! (Sort of)
Graduate Flag: If the symbol has an @ sign
next to it, it means that the stock has risen enough to leave the DD Zone.
Speed is the rate of change today, vs the total 3 day drop
i.e. it is the current "drop speed" of the stock. A negative speed
means the price is rising.
Power is vol today divided by 20 day avg volume. i.e. a power value of 2.6
would mean the volume was 2.6 times the 20 day avg volume.
Torque is the % change in volume today vs yesterday.
Pressure is the dollar amount (in thousands) traded.
Pressure had to be > 10 at one time to be listed.
G is the G-Spot, and is the number of days
in a row it has gone down/stayed even.
D is the Depth, and is the number of days
it has been in Death Drop mode. Will become more accurate atgb.
Volts represents Pressure divided by the Gap (high low range).
Watts represents Pressure divided by the Net (open close range).
 SYMB    Last   Chg     G       D     Pressure Volts  Watts   Speed    Power   Torque   3 Day Drop    (4/5 Day Drop)    Volume

 AMNG @ 0.0299  13%  	0	99	345.9	346	887	-78	0.5	-17	-16%		-28/-16		12,812,900
 APCX   0.0008  -20%  	5	3	119.4	2,388	5,969	52	1.8	0	-38%		-53/-79		125,666,300
 APRM   0.0155  3%  	0	1	10.0	125	199	-5	5.0	67	-68%		-65/-69		647,500
 AVTI @ 0.0007  17%  	0	99	8.0	401	802	-1.667E8	0.3	-24	0%		0/0		11,457,200
 BEHL   0.0020  0%  	11	9	52.3	2,616	52,326	0	0.7	2	0%		-13/-23		27,539,800
 BLLD   0.0109  9%  	0	3	17.3	44	91	-100	2.3	586	9%		-9/-32		1,576,800
 BYSD   0.0008  -11%  	7	5	1.3	66	66	100	0.4	-73	-11%		-11/-27		1,466,900
 CITC   0.0008  0%  	5	2	1.6	157	157	0	0.4	-35	-11%		-33/-33		1,851,300
 CLDR   0.0010  -29%  	1	1	11.4	191	286	86	0.5	-59	-33%		-44/-17		8,793,700
 CMGR   0.0080  0%  	5	5	1.4	14	14	0	0.4	-66	-20%		-33/-38		166,000
 CNEX   0.0012  0%  	4	2	19.1	954	19,077	0	0.4	8	-14%		-33/0		15,897,700
 CYBL   0.0110  -15%  	3	2	81.3	214	271	34	0.9	66	-45%		-44/-37		6,723,100
 DGMA   0.0086  -4%  	3	2	306.4	464	3,405	9	1.5	288	-49%		-37/-4		30,040,300
 DKAM @ 0.0046  15%  	0	99	2.7	54	68	-62	0.1	-70	24%		15/12		570,000
 DNDT   0.0081  0%  	3	9	0.0	0	0	0	0.0	-100	0%		1/1		0
 ECOF @ 0.0240  20%  	0	99	0.2	228	228	-220	0.0	-97	9%		-17/-23		9,500
 EFLN @ 0.0004  33%  	0	99	7.2	723	723	-167	1.6	0	-20%		-20/-20		20,662,900
 ELRA   0.0250  4%  	0	2	1.7	17	17	-39	0.1	-89	-11%		-34/-38		70,400
 EMLL @ 0.0005  25%  	0	99	26.8	1,341	2,682	-150	0.7	-76	-17%		-38/-38		53,634,800
 ESYR   0.0007  -22%  	5	3	6.2	154	205	61	1.4	172	-36%		-36/-59		7,699,200
 ETAR @ 0.0180  64%  	0	99	2.8	3	4	-636	0.6	-41	-10%		-28/100		201,000
 ETNL   0.0045  -4%  	4	8	16.1	803	803	43	1.0	197	-10%		-13/-10		3,490,400
 EXOU   0.0060  -8%  	1	6	9.6	40	192	7.692E7	1.3	14	0%		0/-2		1,808,900
 EXRG   0.0046  15%  	0	1	4.2	52	104	-44	1.0	-38	-34%		-8/-8		903,700
 FDMF @ 0.0025  25%  	0	99	3.2	64	64	-150	1.0	-1	-17%		-17/-38		1,422,000
 FEEL   0.0079  -1%  	5	3	0.8	76	755	6	0.3	-1	-21%		-21/-39		95,000
 GDSM @ 0.0006  20%  	0	99	1.2	116	116	-80	0.6	-95	-25%		-33/-33		2,105,000
 HBWO   0.0156  0%  	2	2	4.0	2	6	0	0.2	-71	-18%		-35/-35		148,800
 HCKI   0.0011  -21%  	2	1	8.6	107	430	55	2.5	-76	-39%		-35/-35		9,550,100
 HNSS   0.0045  -18%  	2	2	18.0	138	359	73	2.0	411	-25%		-61/-61		3,486,500
 ICNB @ 0.0090  27%  	0	99	0.5	3	3	-42	0.2	-97	-64%		-90/-91		60,300
 IFMX   0.0050  -23%  	6	7	0.3	1	268	46	0.2	63	-50%		-58/-58		74,500
 IFRS @ 0.0013  86%  	0	99	1.4	18	140	-197	2.5	-82	-43%		-84/-84		878,000
 KSQR   0.0140  -7%  	4	2	4.9	12	49	53	0.9	1	-13%		-42/-18		377,300
 MDIND   0.0006  0%  	3	1	9.6	321	9,630	0	2.2	477	-33%		-14/-33		12,840,500
 MLXO @ 0.0012  20%  	0	99	0.3	8	8	-100	0.1	-96	-20%		-43/-33		300,000
 MMUH   0.0006  0%  	3	1	46.5	1,550	4,649	0	2.4	-73	-40%		-14/20		84,520,200
 MSOA   0.0012  -20%  	1	1	17.6	351	586	38	0.3	-70	-52%		50/71		14,057,200
 NSMSF   0.0020  0%  	5	3	0.0	0	0	0	0.0	-100	-57%		-75/-80		0
 NWTT   0.0003  0%  	11	9	3.9	3,885	3,885	0	0.2	-53	0%		0/0		12,950,600
 NXTI   0.0090  0%  	3	7	0.0	0	0	0	0.0	-100	0%		5/5		0
 OPTZ   0.0082  -9%  	2	5	2.2	16	24	252	0.6	-10	-4%		-20/-41		245,000
 OWVI @ 0.0011  22%  	0	99	20.0	666	666	-100	1.5	-41	22%		0/0		21,037,300
 PCLI   0.0008  0%  	8	7	69.4	1,156	2,313	0	4.4	2977	-27%		-27/-50		63,078,500
 PPBL @ 0.0250  43%  	0	99	6.3	8	13	-358	0.5	-71	-12%		-7/0		298,700
 PSGI   0.0032  -9%  	5	3	1.4	35	46	28	0.4	8302	-30%		-33/-46		420,100
 PSRU   0.0039  -3%  	5	4	17.8	99	105	7	1.8	-76	-36%		-65/-65		5,732,300
 QEGY   0.0022  -27%  	65	66	0.0	0	0	100	4.1	57173	-27%		-27/-56		6,300
 RICP   0.0001  0%  	66	18	0.1	150	150	0	0.1	-83	0%		0/0		1,500,000
 RRPH   0.0020  0%  	6	4	0.0	0	0	0	0.0	-100	0%		-9/-49		0
 SECI   0.0200  0%  	3	3	1.7	9	12	0	0.6	64	-20%		-17/-33		90,000
 SHAR   0.0010  0%  	5	4	4.0	79	132	0	0.9	-67	-38%		-60/-71		3,783,700
 SMPP   0.0001  -50%  	9	7	5.7	568	5,684	75	0.3	-92	-67%		-67/-67		37,891,300
 SNEYD   0.0180  -22%  	2	2	75.4	69	151	152	8.9	634	-14%		-88/-88		4,307,400
 SNWT   0.0102  -9%  	8	3	17.3	87	216	28	3.0	-7	-32%		-40/-49		1,573,600
 SPNGQ @ 0.0010  900%  	0	99	0.5	1	500	-9E9	0.1	-82	0%		-80/-75		166,600
 SYPJ   0.0075  -6%  	6	4	0.0	11	11	100	0.0	13536	-6%		-25/-50		1,500
 TAON @ 0.0184  14%  	0	99	6.2	16	45	-115	0.6	-77	-12%		-12/-8		366,800
 TFBN   0.0001  0%  	30	28	0.1	100	100	0	2.2	9.0908E6	0%		0/0		1,000,000
 TITL   0.0090  -32%  	1	1	21.6	54	180	91	1.1	847	-36%		-40/-40		1,960,100
 TLAG @ 0.0023  109%  	0	99	27.7	173	231	-393	5.4	440	28%		-23/-23		18,495,100
 TTDZ   0.0001  0%  	22	13	0.1	100	100	0	0.1	0	0%		0/0		1,000,000
 UDHC   0.0132  -15%  	3	1	10.1	25	56	47	0.8	-25	-32%		-18/-18		721,100
 UNDT   0.0006  -14%  	4	2	8.3	833	8,334	43	3.1	87	-33%		-45/-33		12,821,200
 VCTY   0.0065  -7%  	4	10	22.6	150	226	100	0.5	-21	-7%		-25/-20		3,343,700
 XYNH   0.0013  -13%  	1	2	4.7	158	475	100	0.3	-25	-13%		-41/8		4,130,400
Death Drop v3.57 - 20100826 (>30% 3 Day Drop or 5 day drop > 50%) -
Google Ron Paul, our Last Hope
We are starting our OWN Company (LINA):
Message Board: http://investorshub.advfn.com/boards/board.aspx?board_id=14808
Website: http://www.LighthouseNova.com
Modifications: Finally aligned the columns! (Sort of)
Graduate Flag: If the symbol has an @ sign
next to it, it means that the stock has risen enough to leave the DD Zone.
Speed is the rate of change today, vs the total 3 day drop
i.e. it is the current "drop speed" of the stock. A negative speed
means the price is rising.
Power is vol today divided by 20 day avg volume. i.e. a power value of 2.6
would mean the volume was 2.6 times the 20 day avg volume.
Torque is the % change in volume today vs yesterday.
Pressure is the dollar amount (in thousands) traded.
Pressure had to be > 10 at one time to be listed.
G is the G-Spot, and is the number of days
in a row it has gone down/stayed even.
D is the Depth, and is the number of days
it has been in Death Drop mode. Will become more accurate atgb.
Volts represents Pressure divided by the Gap (high low range).
Watts represents Pressure divided by the Net (open close range).
 SYMB    Last   Chg     G       D     Pressure Volts  Watts   Speed    Power   Torque   3 Day Drop    (4/5 Day Drop)    Volume

 AMNG   0.0265  -20%  	3	1	441.2	639	1,103	54	0.6	30	-36%		-26/-12		15,453,400
 APCX   0.0010  0%  	4	2	145.0	2,072	1.4502E5	0	2.0	20	-41%		-74/-23		126,100,600
 AVLS @ 0.0120  71%  	0	99	0.7	1	1	-100	0.5	9.2354E5	71%		71/33		101,600
 AVTI   0.0006  -14%  	6	4	9.0	452	9,031	100	0.3	132	-14%		-14/-25		15,051,200
 BEHL   0.0020  0%  	10	8	53.7	1,344	5,375	0	0.6	-56	-13%		-23/-29		26,874,800
 BLLD   0.0100  0%  	4	2	1.9	5	5	0	0.4	-51	-17%		-38/25		230,000
 BTDG @ 0.0089  85%  	0	99	34.2	98	142	-70	6.4	97	123%		-11/-11		4,141,300
 BYSD   0.0009  0%  	6	4	5.1	171	5,128	0	1.2	242	0%		-18/-31		5,398,000
 CITC   0.0008  -11%  	4	1	2.2	72	215	33	0.7	-37	-33%		-33/-27		2,867,500
 CMGR   0.0080  -20%  	4	4	4.4	22	22	60	1.3	-11	-33%		-38/-32		493,500
 CNEX   0.0012  -8%  	3	1	17.7	887	1,774	23	0.4	-86	-33%		0/0		14,784,100
 CYBL   0.0130  -32%  	2	1	64.7	108	108	95	0.4	444	-33%		-26/8		4,042,900
 DGMA   0.0090  -2%  	2	1	87.1	116	871	6	0.4	-9	-34%		0/233		7,745,500
 DKAM   0.0040  8%  	0	3	8.2	63	8,214	-8.108E7	0.5	-15	0%		-2/-27		1,888,200
 DNDT   0.0081  0%  	2	8	0.0	0	0	0	0.0	-100	1%		1/-19		0
 ECOF   0.0200  -17%  	1	1	6.0	5	15	54	1.2	-35	-31%		-35/-37		331,000
 ECPL @ 0.0003  50%  	0	99	4.9	488	4,877	-5E8	0.2	92	0%		0/0		19,509,400
 EFIR @ 0.0022  83%  	0	99	222.7	1,237	3,182	-833	8.3	160	10%		16/5		92,804,400
 EFLN   0.0003  -40%  	8	1	8.3	415	415	100	1.7	141	-40%		-40/-40		20,743,900
 ELRA   0.0240  -31%  	1	1	18.1	13	16	85	0.7	126	-37%		-40/-40		646,000
 EMLL   0.0004  -43%  	1	1	121.0	2,420	4,034	86	2.8	551	-50%		-50/-50		220,012,600
 ESYR   0.0009  -18%  	4	2	2.7	269	269	100	0.5	21	-18%		-47/-10		2,827,000
 ETAR   0.0110  -45%  	3	1	5.3	6	8	80	1.0	55	-56%		22/47		343,300
 ETNL   0.0047  -6%  	3	7	5.7	190	5,709	62	0.4	-63	-10%		-6/-10		1,177,200
 EVPH @ 0.0225  61%  	0	99	4.7	8	8	-243	1.0	-21	25%		-20/-38		236,500
 EXOU   0.0065  8%  	0	5	9.5	95	191	-100	1.2	361	8%		7/-19		1,590,200
 FDMF   0.0020  -23%  	4	2	3.2	64	64	69	1.0	-57	-33%		-50/-33		1,432,200
 FEEL   0.0080  -11%  	4	2	0.8	8	8	56	0.3	-78	-20%		-38/-33		96,000
 FTER   0.0228  -40%  	10	1	4.7	2	4	92	4.1	253	-43%		-49/-49		243,700
 GCLT   0.0125  -48%  	4	1	14.9	14	14	96	10.8	1101	-50%		-50/-38		841,000
 GDSM   0.0005  -17%  	9	1	18.4	307	1,844	37	14.4	1823	-44%		-44/-55		46,099,600
 HBWO   0.0156  -29%  	1	1	9.6	14	15	83	0.8	2394	-35%		-35/-29		521,200
 HNSS   0.0055  -17%  	1	1	4.1	38	4,129	32	0.4	-62	-52%		-52/-45		682,500
 ICNB   0.0071  -53%  	5	2	24.0	24	24	58	6.1	-18	-92%		-93/-93		2,002,100
 IFMX   0.0065  -13%  	5	6	0.3	2	263	29	0.1	-85	-45%		-46/-50		45,800
 IFRS   0.0007  -65%  	9	1	5.5	69	69	71	16.1	697	-91%		-91/-95		4,998,300
 KSQR   0.0150  0%  	3	1	6.0	30	5,950	0	0.9	-87	-38%		-12/-25		371,900
 MASP @ 0.0059  11%  	0	99	2.1	31	36	-156	0.5	304	7%		2/2		379,800
 MLXO   0.0010  -17%  	3	1	8.6	171	286	32	2.3	458	-52%		-44/-60		8,157,500
 NSMSF   0.0020  -33%  	4	2	0.4	2	4	44	0.9	36	-75%		-80/-60		177,000
 NWTT   0.0003  0%  	10	8	7.0	696	6,955	0	0.4	-69	0%		0/-25		27,820,200
 NXTI   0.0090  0%  	2	6	0.7	706	706	0	0.4	-71	5%		5/-5		78,500
 OPTZ   0.0090  0%  	1	4	2.6	26	26	0	0.6	241	-12%		-36/-36		273,000
 OWVI   0.0009  0%  	6	8	32.0	1,599	31,973	0	2.6	234	-18%		-18/-18		35,525,200
 PCLI   0.0008  -20%  	7	6	2.0	51	2,050	73	0.2	-70	-27%		-50/-64		2,049,800
 PPBL   0.0175  -48%  	1	1	27.1	15	17	137	1.7	41	-35%		-30/-56		1,023,800
 PSGI   0.0035  0%  	4	2	0.0	18	18	0	0.0	-89	-27%		-41/-20		5,000
 PSRU   0.0040  -20%  	4	3	90.7	378	907	31	7.9	151	-64%		-64/-62		23,867,500
 PWLK @ 0.0004  33%  	0	99	2.2	217	217	-56	0.5	-43	-60%		-33/-43		6,187,600
 QASP @ 0.0039  39%  	0	99	118.9	849	1,321	-805	1.2	-72	-5%		-17/-13		37,163,700
 QEGY   0.0030  0%  	64	65	0.0	0	0	0	0.0	-100	0%		-40/-40		0
 RELM @ 0.0005  25%  	0	99	9.7	483	483	-100	1.1	28	25%		25/25		24,172,700
 RICP   0.0001  0%  	65	17	0.9	900	900	0	0.4	205	0%		0/0		9,000,000
 RRPH   0.0020  0%  	5	3	0.1	100	100	0	0.1	-18	-9%		-49/-71		50,000
 SECI   0.0200  0%  	2	2	1.0	4	9	0	0.3	-81	-17%		-33/-33		55,000
 SHAR   0.0010  -29%  	4	3	7.0	70	695	48	2.9	127	-60%		-71/-60		11,586,800
 SMPP   0.0002  -33%  	8	6	97.8	4,892	9,784	100	4.1	1143	-33%		-33/-33		489,215,000
 SMVI @ 0.0027  50%  	0	99	37.3	311	415	-1400	2.0	93	-4%		-27/-34		16,974,700
 SNEYD   0.0230  -10%  	1	1	14.1	70	70	12	2.1	-64	-85%		-84/-85		586,700
 SNWT   0.0112  -20%  	7	2	22.2	59	79	59	3.7	202	-34%		-44/-44		1,697,100
 SPNGQ   0.0001  0%  	3	2	2.4	5	5	0	0.6	-66	-98%		-98/-98		946,700
 SYPJ   0.0080  0%  	5	3	0.0	0	0	0	0.0	-100	-20%		-47/-67		0
 TAON   0.0161  -15%  	3	7	30.2	62	144	65	2.5	414	-23%		-20/-27		1,625,500
 TDGI @ 0.0295  11%  	0	99	27.6	71	71	-1125	0.5	-55	-1%		-2/-2		1,001,000
 TFBN   0.0001  0%  	29	27	0.0	0	0	0	0.0	-100	0%		0/0		0
 TLAG   0.0011  -8%  	4	3	4.1	206	206	13	1.3	-60	-63%		-63/-61		3,425,000
 TTDZ   0.0001  0%  	21	12	0.1	100	100	0	0.1	-90	0%		0/0		1,004,600
 UNDT   0.0007  -13%  	3	1	4.8	240	480	34	1.9	-19	-36%		-22/-36		6,863,900
 VCTY   0.0070  0%  	3	9	32.4	191	216	0	0.7	-45	-20%		-14/-22		4,241,500
 VLCO   0.0280  0%  	6	2	2.3	1	1	0	0.5	-77	-38%		-42/-60		60,200
 XYNH   0.0015  15%  	0	1	7.1	179	714	-48	0.4	-81	-32%		25/36		5,493,000
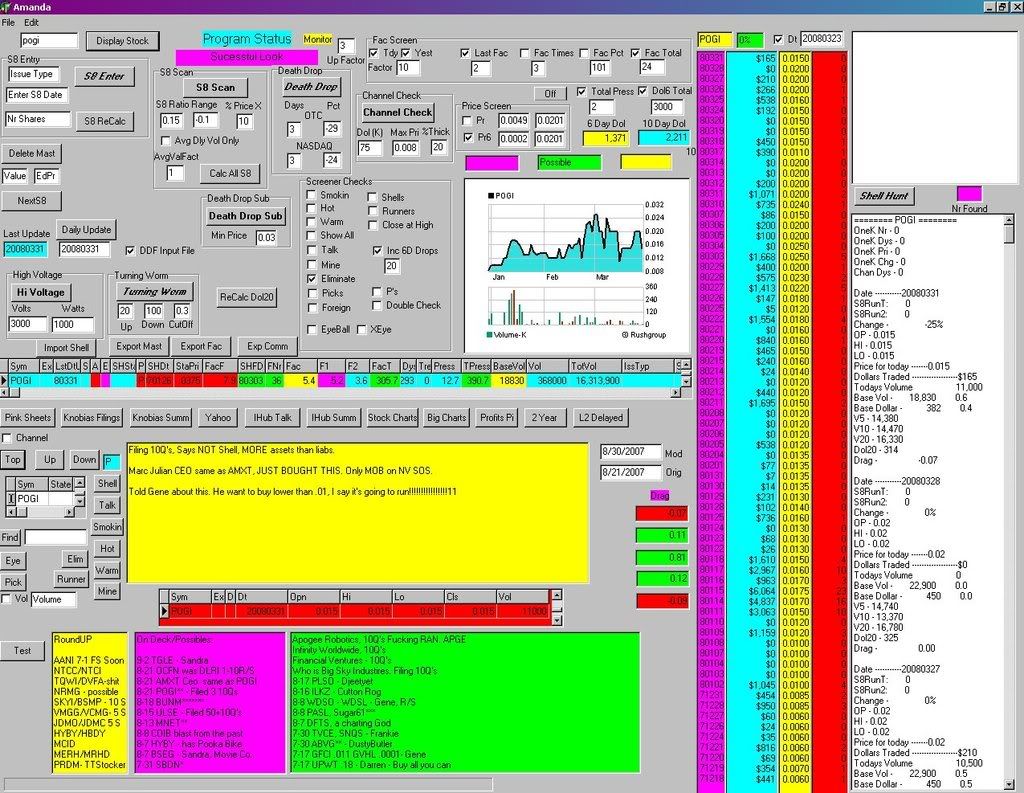
It's the original desk top program..... Got part of it online: http://DDAmanda.com ..........z
Death Drop v3.57 - 20100825 (>30% 3 Day Drop or 5 day drop > 50%) -
Google Ron Paul, our Last Hope
We are starting our OWN Company (LINA):
Message Board: http://investorshub.advfn.com/boards/board.aspx?board_id=14808
Website: http://www.LighthouseNova.com
Modifications: Finally aligned the columns! (Sort of)
Graduate Flag: If the symbol has an @ sign
next to it, it means that the stock has risen enough to leave the DD Zone.
Speed is the rate of change today, vs the total 3 day drop
i.e. it is the current "drop speed" of the stock. A negative speed
means the price is rising.
Power is vol today divided by 20 day avg volume. i.e. a power value of 2.6
would mean the volume was 2.6 times the 20 day avg volume.
Torque is the % change in volume today vs yesterday.
Pressure is the dollar amount (in thousands) traded.
Pressure had to be > 10 at one time to be listed.
G is the G-Spot, and is the number of days
in a row it has gone down/stayed even.
D is the Depth, and is the number of days
it has been in Death Drop mode. Will become more accurate atgb.
Volts represents Pressure divided by the Gap (high low range).
Watts represents Pressure divided by the Net (open close range).
 SYMB    Last   Chg     G       D     Pressure Volts  Watts   Speed    Power   Torque   3 Day Drop    (4/5 Day Drop)    Volume

 AFPW @ 0.0117  17%  	0	99	1.5	9	73	-680	0.1	-41	-2%		2/-20		134,900
 APCX   0.0010  -23%  	3	1	115.9	1,932	3,864	31	1.8	-29	-74%		-23/43		105,378,700
 AVLS   0.0070  0%  	9	8	0.0	0	0	0	0.0	-100	0%		-22/-36		0
 AVTI   0.0007  0%  	5	3	4.2	423	423	0	0.1	49	0%		-13/-30		6,500,700
 BEHL   0.0020  0%  	9	7	127.1	2,118	3,177	0	1.4	17	-23%		-29/-38		60,516,500
 BLLD   0.0100  0%  	3	1	3.8	10	19	0	0.8	222	-38%		25/43		470,200
 BTDG   0.0048  -26%  	1	1	12.6	42	47	50	4.6	16700	-52%		-52/-52		2,100,000
 BYSD   0.0009  0%  	5	3	1.7	55	1,657	0	0.3	2	-18%		-31/-36		1,578,500
 CMGR   0.0100  0%  	3	3	5.8	58	58	0	1.5	-29	-22%		-15/-11		553,600
 CTYXD @ 0.0065  6400%  	0	99	1.3	1	1	-100	0.0	8.9808E5	6400%		6400/6400		98,800
 DKAM   0.0037  0%  	5	2	8.8	126	8,815	0	0.5	-42	-10%		-33/-33		2,231,600
 DNDT   0.0081  0%  	1	7	0.0	0	0	0	0.0	-100	1%		-19/-19		0
 ECOF @ 0.0240  9%  	0	99	11.4	23	114	-40	2.0	29	-23%		-24/-25		505,800
 ECPL   0.0002  -33%  	8	5	2.5	255	255	100	0.1	-69	-33%		-33/-78		10,185,500
 EFIR   0.0012  -33%  	2	1	50.0	625	1,000	90	5.1	186	-37%		-43/-48		35,731,100
 EMLL @ 0.0007  17%  	0	99	20.3	1,014	2,028	-133	0.5	-68	-13%		-13/-13		33,800,400
 ESYR   0.0011  0%  	3	1	2.6	129	258	0	0.5	-41	-35%		10/0		2,342,900
 ETNL   0.0050  0%  	2	6	15.5	516	15,482	0	0.9	146	0%		-4/0		3,192,200
 EVPH   0.0140  8%  	0	4	4.7	14	47	-15	1.3	4	-50%		-61/-64		300,300
 EXOU   0.0060  0%  	6	4	1.9	19	19	0	0.3	2	-2%		-25/-26		345,000
 FDMF   0.0026  -13%  	3	1	9.1	183	229	38	2.3	1257	-35%		-13/4		3,326,900
 FEEL   0.0090  -10%  	3	1	3.7	31	184	33	1.2	17	-31%		-25/-31		427,600
 GGII @ 0.0014  40%  	0	99	3.9	98	197	-4E8	0.3	-66	0%		0/-30		3,283,300
 HNSS @ 0.0066  10%  	0	99	11.2	45	224	-24	1.2	-65	-42%		-34/-21		1,792,700
 HSCO @ 0.0055  189%  	0	99	12.3	38	49	-1.895E9	2.0	14	0%		12/-35		2,788,400
 HWFG @ 0.0180  44%  	0	99	1.3	2	13	-50	1.5	-54	-88%		-88/-88		86,800
 ICNB   0.0151  -40%  	4	1	55.2	37	37	47	10.7	86	-84%		-84/-81		2,452,800
 IFMX   0.0075  -25%  	4	5	2.1	4	11	67	0.7	-4	-38%		-42/-25		300,500
 MASP   0.0053  -4%  	5	21	0.5	25	25	42	0.1	-25	-9%		-9/-9		93,900
 MNDP @ 0.0020  11%  	0	99	30.4	1,520	1,520	-43	0.7	-29	-26%		-35/-41		16,000,500
 NSMSF   0.0030  -36%  	3	1	0.7	2	662	52	0.7	507	-70%		-40/-85		129,900
 NWMT @ 0.0009  50%  	0	99	16.7	418	557	-175	0.7	-51	29%		29/12		20,893,900
 NWTT   0.0003  0%  	9	7	22.7	2,267	22,670	0	1.3	25	0%		-25/-25		90,681,400
 NXTI   0.0090  0%  	1	5	2.3	47	59	0	1.5	62	5%		-5/-17		267,500
 OPTZ   0.0090  6%  	0	3	0.7	36	36	-16	0.2	-81	-36%		-36/-47		80,000
 OWVI   0.0009  0%  	5	7	10.6	531	531	0	0.8	-59	-18%		-18/-31		10,625,400
 PCLI   0.0010  -9%  	6	5	5.8	192	5,760	24	0.6	-45	-38%		-55/-70		6,777,000
 PSGI   0.0035  -24%  	3	1	0.2	2	2	59	0.0	-99	-41%		-20/9		43,500
 PSRU   0.0050  -18%  	3	2	57.0	143	285	33	5.1	342	-55%		-52/-58		9,505,100
 PWLK   0.0003  -25%  	2	2	3.8	380	380	50	0.9	-60	-50%		-57/-25		10,846,600
 QASP   0.0028  -36%  	1	3	364.9	3,318	18,246	90	4.5	582	-40%		-38/-53		132,700,700
 QEGY   0.0030  0%  	63	64	0.0	0	0	0	0.0	-100	-40%		-40/-40		0
 RELM   0.0004  0%  	9	7	6.6	663	663	0	0.7	253	0%		0/0		18,949,900
 RICP   0.0001  0%  	64	16	0.3	295	295	0	0.1	-2	0%		0/0		2,950,000
 RRPH   0.0020  0%  	4	2	0.1	122	122	0	0.1	-69	-49%		-71/-20		61,000
 SECI   0.0200  -20%  	1	1	5.3	14	264	60	1.3	205	-33%		-33/-33		288,200
 SHAR   0.0014  -13%  	3	2	6.9	138	345	21	1.5	-59	-60%		-44/-42		5,108,300
 SMPP   0.0003  0%  	7	5	9.8	984	984	0	0.4	26	0%		0/0		39,356,600
 SMVI   0.0018  -10%  	4	6	16.3	542	813	19	1.2	-60	-51%		-56/-55		8,792,000
 SNDY @ 0.0007  40%  	0	99	36.3	906	1,813	-96	8.0	18	-42%		-42/-42		51,785,900
 SNEYD @ 0.0255  21%  	0	99	44.1	69	883	-26	6.6	237	-82%		-83/-85		1,647,300
 SNWT   0.0140  -6%  	6	1	8.1	81	163	20	1.4	-61	-30%		-30/-33		561,400
 SPNGQ   0.0001  -90%  	2	1	7.2	15	51	92	1.8	346	-98%		-98/-98		2,813,000
 SYPJ   0.0080  0%  	4	2	0.0	0	0	0	0.0	-100	-47%		-67/-6		0
 TAON   0.0190  -10%  	2	6	6.1	122	122	190	0.6	-30	-5%		-14/-21		316,500
 TDGI   0.0265  -11%  	1	7	61.0	124	179	97	1.1	5	-12%		-12/-12		2,220,800
 TFBN   0.0001  0%  	28	26	0.0	0	0	0	0.0	-100	0%		0/0		0
 TLAG   0.0012  -33%  	3	2	12.4	177	207	56	3.3	-6	-60%		-57/-52		8,552,500
 TTDZ   0.0001  0%  	20	11	1.1	1,050	1,050	0	1.3	67	0%		0/0		10,500,000
 VCTY   0.0070  0%  	2	8	60.7	264	3,036	0	1.3	-15	-14%		-22/-16		7,735,700
 VLCO   0.0280  -38%  	5	1	9.0	8	43	89	2.1	565	-42%		-60/-60		265,900
What is that cool screen shot in the ibox of? Its like an L2 on steroids! I want that.
Death Drop v3.57 - 20100824 (>30% 3 Day Drop or 5 day drop > 50%) -
Google Ron Paul, our Last Hope
We are starting our OWN Company (LINA):
Message Board: http://investorshub.advfn.com/boards/board.aspx?board_id=14808
Website: http://www.LighthouseNova.com
Modifications: Finally aligned the columns! (Sort of)
Graduate Flag: If the symbol has an @ sign
next to it, it means that the stock has risen enough to leave the DD Zone.
Speed is the rate of change today, vs the total 3 day drop
i.e. it is the current "drop speed" of the stock. A negative speed
means the price is rising.
Power is vol today divided by 20 day avg volume. i.e. a power value of 2.6
would mean the volume was 2.6 times the 20 day avg volume.
Torque is the % change in volume today vs yesterday.
Pressure is the dollar amount (in thousands) traded.
Pressure had to be > 10 at one time to be listed.
G is the G-Spot, and is the number of days
in a row it has gone down/stayed even.
D is the Depth, and is the number of days
it has been in Death Drop mode. Will become more accurate atgb.
Volts represents Pressure divided by the Gap (high low range).
Watts represents Pressure divided by the Net (open close range).
 SYMB    Last   Chg     G       D     Pressure Volts  Watts   Speed    Power   Torque   3 Day Drop    (4/5 Day Drop)    Volume

 ADAC @ 0.0103  348%  	0	99	296.3	212	559	-932	12.5	547	37%		20/-6		24,693,000
 AFPW   0.0100  -17%  	2	10	2.5	12	12	128	0.1	-91	-13%		-32/-28		227,200
 AVLS   0.0070  0%  	8	7	0.0	0	0	0	0.0	-100	-22%		-36/-36		0
 AVTI   0.0007  0%  	4	2	2.8	283	283	0	0.1	-78	-13%		-30/-22		4,357,200
 BEHL   0.0020  -13%  	8	6	121.4	1,734	4,046	46	1.3	-40	-29%		-38/-41		51,645,200
 BYSD   0.0009  0%  	4	2	1.5	77	77	0	0.3	-80	-31%		-36/-31		1,543,800
 CGAQ @ 0.0300  11%  	0	99	25.2	34	63	-31	1.3	-54	-35%		-44/-29		846,800
 CMGR   0.0100  -17%  	2	2	11.5	12	77	115	2.4	112	-15%		-11/-50		780,300
 CTYXD   0.0001  0%  	8	7	0.0	0	0	0	0.0	-100	0%		0/-50		0
 DKAM   0.0037  -7%  	4	1	14.9	498	747	23	0.9	-50	-33%		-33/-26		3,878,500
 DNDT   0.0081  1%  	0	6	0.1	12	12	-7	0.2	1.3626E5	-19%		-19/-19		15,000
 ECOF   0.0220  -24%  	16	1	10.0	14	14	80	1.7	692	-30%		-31/-39		391,100
 ECPL   0.0003  0%  	7	4	10.0	9,968	9,968	0	0.3	12	0%		-67/-70		33,225,900
 ELRA   0.0280  -26%  	4	1	41.3	41	59	87	1.5	83	-30%		-42/-38		1,375,500
 EMLL   0.0006  -25%  	5	5	69.0	2,299	3,448	100	1.6	-53	-25%		-25/-54		106,091,600
 ETNL   0.0050  -4%  	1	5	6.3	210	6,299	100	0.4	-16	-4%		0/-9		1,298,700
 EVPH   0.0130  -28%  	5	3	4.4	5	6	43	1.3	-39	-64%		-67/-70		287,400
 EXOU   0.0060  0%  	5	3	1.9	19	1,854	0	0.2	-80	-25%		-26/-50		337,000
 GGII   0.0010  0%  	4	2	10.2	341	511	0	0.9	-35	-29%		-50/-47		9,739,100
 HNSS   0.0060  -48%  	1	1	42.6	65	142	120	3.6	51	-40%		-29/-19		5,158,100
 HSCO   0.0019  -57%  	2	2	7.7	31	31	93	1.9	7	-61%		-78/-79		2,444,300
 HWFG   0.0125  -18%  	11	2	3.0	4	4	19	3.3	-73	-92%		-92/-92		188,800
 IFMX   0.0100  -16%  	3	4	2.9	8	29	69	0.8	20	-23%		0/0		312,000
 MASP   0.0055  0%  	4	20	0.7	685	685	0	0.1	-63	-5%		-5/-2		124,500
 MDIND @ 0.0009  29%  	0	99	2.2	74	111	-286	0.5	-92	-10%		-10/-10		2,622,900
 MNDP   0.0018  -10%  	6	4	43.0	717	1,433	24	1.0	-48	-42%		-47/-56		22,631,200
 NWMT   0.0006  -14%  	9	9	30.0	1,500	3,000	100	1.6	-20	-14%		-25/-40		42,857,000
 NWTT   0.0003  0%  	8	6	21.8	1,088	2,176	0	1.1	-45	-25%		-25/-25		72,528,100
 NXPN @ 0.0040  11%  	0	99	0.0	40	40	-100	0.0	90809	11%		11/11		10,000
 NXTI   0.0090  5%  	0	4	1.5	1,485	1,485	-88	0.9	360	-5%		-17/-75		165,000
 OPTZ   0.0085  -17%  	5	2	3.8	18	22	42	1.0	-73	-39%		-50/-53		417,700
 OWVI   0.0009  -18%  	4	6	25.8	1,289	2,577	100	2.0	115	-18%		-31/-25		25,774,100
 PCLI   0.0011  0%  	5	4	14.2	285	1,424	0	1.0	-69	-50%		-67/-76		12,386,400
 PPBL   0.0284  6%  	0	3	14.9	28	41	-19	1.1	-3	-29%		-38/-64		580,300
 PRPM @ 0.0008  33%  	0	99	7.7	385	385	-300	4.4	1	-11%		-20/-20		10,994,700
 PSRU   0.0061  -45%  	2	1	17.8	32	36	106	1.5	4	-42%		-49/-50		2,152,300
 PWLK   0.0004  -60%  	1	1	17.8	356	891	140	2.4	-50	-43%		0/0		27,416,500
 QASP   0.0044  7%  	0	2	77.9	779	3,893	-329	0.8	60	-2%		-25/-32		19,463,200
 QEGY   0.0030  0%  	62	63	0.0	0	0	0	0.0	-100	-40%		-40/-40		0
 RELM   0.0004  0%  	8	6	1.9	188	188	0	0.2	1244	0%		0/0		5,374,100
 RICP   0.0001  0%  	63	15	0.3	300	300	0	0.1	200	0%		0/0		3,000,000
 RNNM   0.0300  -25%  	3	1	12.0	12	12	83	5.3	21	-30%		-25/-39		342,100
 RRPH   0.0020  -9%  	3	1	0.4	14	14	13	0.2	69	-71%		-20/-20		196,000
 SHAR   0.0016  -36%  	2	1	33.9	136	847	100	3.8	-27	-36%		-33/-41		12,323,700
 SMPP   0.0003  0%  	6	4	7.8	782	7,816	0	0.3	16	0%		0/-40		31,264,300
 SMVI   0.0020  -29%  	3	5	50.0	416	555	56	3.1	127	-51%		-50/-61		21,730,400
 SNDY   0.0005  -38%  	7	2	28.5	950	950	64	10.8	149	-58%		-58/-58		43,848,600
 SNEYD   0.0210  -86%  	1	1	11.2	8	22	101	2.8	135	-86%		-88/-86		488,500
 SWRS @ 0.0002  100%  	0	99	0.3	31	31	-100	0.1	-51	100%		100/100		2,098,700
 SYPJ   0.0080  -20%  	3	1	4.4	15	44	30	1.4	-84	-67%		-6/-6		523,000
 TAON   0.0210  0%  	1	5	9.7	32	97	0	0.8	-30	-5%		-12/-9		453,400
 TDGI   0.0299  0%  	0	6	58.1	116	242	-101	1.1	190	0%		0/0		2,112,800
 TFBN   0.0001  0%  	27	25	0.0	0	0	0	0.0	-100	0%		0/0		0
 TLAG   0.0018  -40%  	2	1	14.5	363	14,505	112	4.3	584	-36%		-28/20		9,065,400
 TTDZ   0.0001  0%  	19	10	0.9	95	945	0	0.8	1475	0%		0/0		6,300,900
 UWRL @ 0.0016  33%  	0	99	69.1	1,151	2,302	-233	1.7	-15	14%		0/-11		49,323,600
 VCTY   0.0070  -20%  	1	7	67.6	845	845	88	1.7	380	-22%		-16/-26		9,134,000
Congrats. Lots of winners come from here.........et z
Yup, excellent bounce plays from z's scans
ADAC death drop winner ...
i knew i'd find it on yer yesterdays list lol great scan
Death Drop v3.57 - 20100823 (>30% 3 Day Drop or 5 day drop > 50%) -
Google Ron Paul, our Last Hope
We are starting our OWN Company (LINA):
Message Board: http://investorshub.advfn.com/boards/board.aspx?board_id=14808
Website: http://www.LighthouseNova.com
Modifications: Finally aligned the columns! (Sort of)
Graduate Flag: If the symbol has an @ sign
next to it, it means that the stock has risen enough to leave the DD Zone.
Speed is the rate of change today, vs the total 3 day drop
i.e. it is the current "drop speed" of the stock. A negative speed
means the price is rising.
Power is vol today divided by 20 day avg volume. i.e. a power value of 2.6
would mean the volume was 2.6 times the 20 day avg volume.
Torque is the % change in volume today vs yesterday.
Pressure is the dollar amount (in thousands) traded.
Pressure had to be > 10 at one time to be listed.
G is the G-Spot, and is the number of days
in a row it has gone down/stayed even.
D is the Depth, and is the number of days
it has been in Death Drop mode. Will become more accurate atgb.
Volts represents Pressure divided by the Gap (high low range).
Watts represents Pressure divided by the Net (open close range).
 SYMB    Last   Chg     G       D     Pressure Volts  Watts   Speed    Power   Torque   3 Day Drop    (4/5 Day Drop)    Volume

 ADAC   0.0023  -47%  	11	2	9.9	124	9,915	63	5.1	-29	-73%		-79/-79		3,813,600
 AFPW   0.0120  0%  	1	9	24.1	33	172	0	1.6	468	-18%		-13/-17		2,485,000
 ALKN @ 0.0230  15%  	0	99	21.9	22	109	-71	1.7	329	21%		21/15		912,000
 AVLS   0.0070  0%  	7	6	0.1	70	70	0	0.1	-92	-36%		-36/-56		10,000
 AVTI   0.0007  0%  	3	1	13.8	688	13,768	0	0.3	42	-30%		-22/-36		19,668,600
 BEHL   0.0023  -12%  	7	5	214.9	3,581	4,297	41	2.2	78	-28%		-32/-36		85,942,900
 BYSD   0.0009  -18%  	3	1	7.9	393	787	51	1.5	156	-36%		-31/-10		7,865,500
 CGAQ   0.0270  -27%  	3	1	64.7	38	64	55	2.8	16	-50%		-36/-27		1,822,400
 CMGR   0.0120  -6%  	1	1	5.0	10	100	88	1.2	-56	7%		-40/-60		368,900
 CNEX @ 0.0018  50%  	0	99	124.1	1,772	2,481	-250	3.0	217	20%		20/6		85,562,900
 CTYXD   0.0001  0%  	7	6	0.0	0	0	0	0.0	-100	0%		-50/-50		0
 DNDT   0.0080  0%  	8	5	0.0	0	0	0	0.0	-100	-20%		-20/-43		0
 ECPL   0.0003  0%  	6	3	7.4	739	7,386	0	0.3	-59	-67%		-70/-73		29,544,900
 EMLL   0.0008  0%  	4	4	214.8	4,295	2.1477E5	0	3.8	602	0%		-38/-27		226,068,700
 ENTI @ 0.0004  33%  	0	99	13.6	1,363	13,632	-100	0.3	78	33%		-20/-20		38,949,000
 ETNL   0.0052  4%  	0	4	8.0	266	400	-100	0.5	-82	4%		-5/-21		1,552,300
 EVPH   0.0180  -36%  	4	2	9.6	5	10	66	2.3	53	-54%		-58/-54		470,700
 EXOU   0.0060  -2%  	4	2	10.8	45	72	6	1.2	-6	-26%		-50/-27		1,712,600
 GGII   0.0010  -29%  	3	1	15.7	224	391	57	1.4	25	-50%		-47/-38		14,913,200
 GTLL @ 0.0003  50%  	0	99	0.6	57	57	-100	0.1	1710	50%		50/0		2,262,800
 HSCO   0.0044  -20%  	1	1	11.6	83	83	41	1.9	-17	-48%		-51/-51		2,282,900
 HWFG   0.0152  -90%  	10	1	57.9	4	4	100	14.6	2298	-90%		-90/-90		693,000
 IARO @ 0.0004  100%  	0	99	5.3	267	535	-300	1.0	967	33%		0/0		17,820,800
 IFMX   0.0119  -1%  	2	3	2.9	4	9	4	0.7	-81	19%		19/-55		260,300
 KSQR @ 0.0240  41%  	0	99	28.0	30	35	-239	6.1	208	-17%		-19/-19		1,377,900
 LGTT @ 0.0100  25%  	0	99	1.9	4	1,865	-50	1.2	-61	-50%		-71/-71		149,200
 MASP   0.0055  -5%  	3	19	1.9	38	48	100	0.2	-51	-5%		-2/0		333,800
 MDIND   0.0007  -22%  	4	1	26.5	1,323	1,323	74	6.6	3604	-30%		-30/-22		33,086,200
 MEXP @ 0.0005  25%  	0	99	5.8	193	579	-88	3.5	4	-29%		-17/-29		12,862,500
 MNDP   0.0020  -26%  	5	3	104.1	1,302	1,488	63	2.0	343	-41%		-51/-64		43,392,100
 NVSR   0.0271  -24%  	2	1	4.5	4	4	73	1.6	69	-32%		-30/-23		135,600
 NWMT   0.0007  0%  	8	8	43.1	2,155	2,155	0	2.1	310	-13%		-30/-36		53,864,500
 NWTT   0.0003  0%  	7	5	39.3	1,965	3,931	0	2.1	32	-25%		-25/-40		131,020,600
 NXPN   0.0036  0%  	12	10	0.0	0	0	0	0.0	-100	0%		0/0		0
 NXTI   0.0086  0%  	4	3	0.3	8	8	0	0.2	-62	-21%		-76/-76		35,900
 OPMG @ 0.0174  45%  	0	99	71.6	102	163	-100	6.3	1173	45%		36/39		4,340,400
 OPTZ   0.0102  -27%  	4	1	18.7	49	49	68	3.8	662	-40%		-43/-22		1,542,000
 OWVI   0.0011  0%  	3	5	13.2	659	1,318	0	1.0	6	-15%		-8/-31		11,978,500
 PCLI   0.0011  -31%  	4	3	53.9	1,077	1,077	47	3.2	6	-67%		-76/-69		39,898,100
 PPBL   0.0269  8%  	0	2	14.8	23	78	-19	1.2	-75	-41%		-66/-65		598,200
 PRPM   0.0006  -25%  	4	1	6.0	119	298	63	5.6	348	-40%		-40/-25		10,845,700
 QASP   0.0041  -13%  	1	1	54.6	546	910	42	0.5	-15	-31%		-37/-2		12,131,800
 QEGY   0.0030  -40%  	61	62	0.1	0	0	100	10.6	1.8172E5	-40%		-40/-40		20,000
 RELM   0.0004  0%  	7	5	0.2	160	160	0	0.0	-94	0%		0/0		400,000
 RICP   0.0001  0%  	62	14	0.1	100	100	0	0.0	-67	0%		0/0		1,000,000
 SLRW @ 0.0080  54%  	0	99	3.7	12	14	-162	0.1	-33	33%		0/3		562,000
 SMPP   0.0003  0%  	5	3	6.7	675	6,748	0	0.3	-64	0%		-40/-50		26,990,900
 SMVI   0.0028  -24%  	2	4	31.5	315	451	81	1.6	-67	-30%		-45/-57		9,557,000
 SNDY   0.0008  -33%  	6	1	16.7	335	419	100	9.4	1813	-33%		-33/-33		17,630,500
 SSPT @ 0.0002  100%  	0	99	1.9	185	185	-100	0.2	-75	100%		100/100		12,350,000
 SWRS   0.0001  0%  	14	11	0.6	64	639	0	0.2	-77	0%		0/0		4,261,100
 TAON   0.0210  5%  	0	4	13.9	46	69	-40	1.1	-32	-12%		-9/-46		645,800
 TDGI   0.0298  -1%  	7	5	21.5	43	98	100	0.4	58	-1%		-1/-7		729,100
 TFBN   0.0001  0%  	26	24	0.0	0	0	0	0.0	-100	0%		0/0		0
 TTDZ   0.0001  0%  	18	9	0.0	40	40	0	0.1	-93	0%		0/0		400,000
 UWRL   0.0012  -8%  	6	3	72.7	2,422	3,634	31	1.8	103	-25%		-33/-40		58,137,200
 VCTY   0.0087  7%  	0	6	15.4	128	257	-154	0.4	-31	5%		-8/-13		1,902,300
 ZLUS @ 0.0010  11%  	0	99	26.9	897	2,690	-122	2.4	23	-9%		-17/-38		28,314,700
Death Drop v3.57 - 20100820 (>30% 3 Day Drop or 5 day drop > 50%) -
Google Ron Paul, our Last Hope
We are starting our OWN Company (LINA):
Message Board: http://investorshub.advfn.com/boards/board.aspx?board_id=14808
Website: http://www.LighthouseNova.com
Modifications: Finally aligned the columns! (Sort of)
Graduate Flag: If the symbol has an @ sign
next to it, it means that the stock has risen enough to leave the DD Zone.
Speed is the rate of change today, vs the total 3 day drop
i.e. it is the current "drop speed" of the stock. A negative speed
means the price is rising.
Power is vol today divided by 20 day avg volume. i.e. a power value of 2.6
would mean the volume was 2.6 times the 20 day avg volume.
Torque is the % change in volume today vs yesterday.
Pressure is the dollar amount (in thousands) traded.
Pressure had to be > 10 at one time to be listed.
G is the G-Spot, and is the number of days
in a row it has gone down/stayed even.
D is the Depth, and is the number of days
it has been in Death Drop mode. Will become more accurate atgb.
Volts represents Pressure divided by the Gap (high low range).
Watts represents Pressure divided by the Net (open close range).
 SYMB    Last   Chg     G       D     Pressure Volts  Watts   Speed    Power   Torque   3 Day Drop    (4/5 Day Drop)    Volume

 ADAC   0.0043  -43%  	10	1	24.3	84	203	70	9.7	2351	-61%		-61/-61		5,342,300
 AFPW   0.0120  4%  	0	8	5.3	26	53	-33	0.3	-41	-13%		-17/-25		437,600
 ALKN   0.0200  5%  	0	4	4.1	41	41	-100	0.4	-50	5%		0/-9		212,400
 AVLS   0.0070  -22%  	6	5	1.0	5	5	61	0.7	261	-36%		-56/-73		126,400
 BEHL   0.0026  -7%  	6	4	127.9	4,264	6,396	30	1.4	53	-24%		-28/-43		48,269,300
 BLLB @ 0.0004  33%  	0	99	17.1	854	1,708	-100	2.4	171	33%		-20/-33		42,711,500
 CMGR @ 0.0128  9%  	0	99	10.1	53	67	-26	3.0	106	-36%		-57/-33		842,100
 CNEX   0.0012  0%  	5	9	31.0	1,035	3,105	0	1.1	-14	-20%		-29/-33		26,997,200
 CTYXD   0.0001  0%  	6	5	8.5	849	849	0	0.7	-1	-50%		-50/-67		56,590,900
 DGMA @ 0.0090  233%  	0	99	277.5	462	462	-29	3.0	37	800%		309/260		46,244,600
 DNDT   0.0080  -20%  	7	4	0.3	1	1	100	0.4	3.1808E5	-20%		-43/-45		35,000
 ECPL   0.0003  0%  	5	2	17.8	1,780	17,798	0	0.7	-62	-70%		-73/-73		71,192,700
 EMLL   0.0008  0%  	3	3	24.2	2,416	24,163	0	0.7	-78	-38%		-27/-64		32,216,800
 ENTI   0.0003  -25%  	1	1	7.7	766	7,657	63	0.1	-83	-40%		-40/-40		21,878,000
 ESYR @ 0.0017  70%  	0	99	15.2	190	217	-168	2.4	120	42%		42/42		11,678,100
 ETNL   0.0050  -4%  	1	3	41.2	2,058	41,167	42	2.5	40	-9%		-24/-38		8,401,500
 EVPH   0.0280  -22%  	3	1	9.5	8	11	64	1.7	-72	-35%		-29/-22		306,700
 EXOU   0.0061  -24%  	3	1	13.7	47	47	48	1.3	324	-49%		-26/-24		1,815,700
 EXPU @ 0.0020  11%  	0	99	7.6	379	7,571	-56	1.9	84	-20%		-31/-39		3,605,300
 GTLL   0.0002  0%  	15	14	0.0	25	25	0	0.0	-99	0%		-33/-33		125,000
 HSCO @ 0.0055  12%  	0	99	15.2	152	758	-31	2.5	-61	-39%		-39/-61		2,755,100
 IAGI @ 0.0140  15%  	0	99	1.7	17	17	-192	0.1	-85	8%		-19/-20		127,200
 IARO   0.0002  -33%  	5	3	0.4	42	42	67	0.1	-86	-50%		-50/-60		1,669,900
 IFMX   0.0120  -8%  	1	2	21.5	31	107	38	3.8	57	20%		-55/100		1,384,100
 INIX @ 0.0017  31%  	0	99	0.3	10	10	-144	0.1	-97	21%		-15/6		192,000
 KSQR   0.0170  -15%  	5	1	6.5	9	65	35	2.8	-18	-42%		-42/-43		447,000
 LGTT   0.0080  -11%  	4	1	3.8	4	19	15	3.3	437	-76%		-76/-68		381,600
 MASP   0.0058  0%  	2	18	3.9	79	197	0	0.1	211	4%		5/5		684,900
 MEXP   0.0004  0%  	2	1	6.8	136	680	0	4.1	7	-33%		-43/-20		12,362,600
 MNDP   0.0027  -13%  	4	2	28.9	413	482	38	0.5	-70	-34%		-51/8		9,797,900
 NGHI @ 0.0280  24%  	0	99	1.7	2	2	-2.444E8	0.3	-54	0%		-20/-14		69,600
 NSMSF @ 0.0100  100%  	0	99	5.8	23	23	-118	3.7	-73	-85%		-85/-85		660,000
 NWMT   0.0007  0%  	7	7	10.5	526	1,052	0	0.5	-79	-30%		-36/-42		13,145,200
 NWTT   0.0003  -25%  	6	4	29.8	1,489	2,979	100	1.7	80	-25%		-40/-50		99,283,900
 NXPN   0.0036  0%  	11	9	0.0	0	0	0	0.0	-100	0%		0/-3		0
 NXTI   0.0086  -9%  	3	2	0.8	8	85	12	0.5	-78	-76%		-76/-76		94,300
 OOGI @ 0.0200  43%  	0	99	4.6	10	16	-119	1.0	19	36%		18/11		235,400
 OPMG   0.0120  -8%  	1	3	4.3	31	43	123	0.7	63	-6%		-4/-33		340,900
 OWVI   0.0011  0%  	2	4	13.0	1,302	1,302	0	0.9	-37	-8%		-31/-31		11,324,500
 PCLI   0.0016  -27%  	3	2	67.8	678	968	42	3.5	2	-64%		-56/-47		37,652,400
 PPBL   0.0250  -37%  	3	1	62.1	52	96	55	5.4	386	-68%		-68/-67		2,435,600
 QEGY   0.0050  0%  	60	61	0.0	0	0	0	0.0	-100	0%		0/0		0
 QMIN @ 0.0006  20%  	0	99	0.3	284	284	-2E8	0.1	-76	0%		0/-25		473,600
 RELM   0.0004  0%  	6	4	2.2	215	2,154	0	0.2	-79	0%		0/0		6,154,400
 RICP   0.0001  0%  	61	13	0.3	300	300	0	0.1	50	0%		0/0		3,000,000
 SLRW   0.0052  4%  	0	2	4.3	107	214	-11	0.2	-74	-35%		-33/-28		840,000
 SMPP   0.0003  0%  	4	2	18.6	1,862	18,622	0	0.8	-63	-40%		-50/-25		74,489,700
 SMVI   0.0037  -10%  	1	3	122.2	815	1,018	36	5.2	141	-27%		-43/-41		28,755,600
 SSPT   0.0001  0%  	20	18	4.9	4,888	4,888	0	0.6	14	0%		0/0		48,880,400
 SWRS   0.0001  0%  	13	10	2.8	278	278	0	0.9	1563	0%		0/0		18,556,500
 SYNW @ 0.0120  20%  	0	99	1.3	7	7	-220	0.9	367	9%		-4/-4		121,400
 TAON   0.0200  -9%  	2	3	20.9	52	52	70	1.6	-31	-13%		-49/-58		951,300
 TDGI   0.0300  0%  	6	4	14.4	27	1,437	0	0.2	-4	0%		-6/-25		461,200
 TFBN   0.0001  0%  	25	23	0.0	0	0	0	0.0	-100	0%		0/0		0
 TGGI @ 0.0004  33%  	0	99	18.2	1,815	1,815	-78	0.4	-71	-43%		-33/-50		51,864,800
 TTDZ   0.0001  0%  	17	8	0.6	600	600	0	0.8	5.4545E7	0%		0/0		6,000,000
 UWRL   0.0013  -7%  	5	2	37.2	1,860	3,720	26	0.9	-43	-28%		-35/-38		28,616,600
 VCTY   0.0081  -10%  	1	5	22.8	152	254	68	0.5	-65	-15%		-19/-35		2,766,100
 WTCT @ 0.0020  82%  	0	99	0.0	0	0	-245	0.0	-100	33%		33/33		5,200
 ZLUS   0.0009  -18%  	4	2	19.5	651	1,952	73	2.2	257	-25%		-44/-36		22,962,700
Thx Z. Always hate to see one of my stocks on the list
Death Drop v3.57 - 20100819 (>30% 3 Day Drop or 5 day drop > 50%) -
Google Ron Paul, our Last Hope
We are starting our OWN Company (LINA):
Message Board: http://investorshub.advfn.com/boards/board.aspx?board_id=14808
Website: http://www.LighthouseNova.com
Modifications: Finally aligned the columns! (Sort of)
Graduate Flag: If the symbol has an @ sign
next to it, it means that the stock has risen enough to leave the DD Zone.
Speed is the rate of change today, vs the total 3 day drop
i.e. it is the current "drop speed" of the stock. A negative speed
means the price is rising.
Power is vol today divided by 20 day avg volume. i.e. a power value of 2.6
would mean the volume was 2.6 times the 20 day avg volume.
Torque is the % change in volume today vs yesterday.
Pressure is the dollar amount (in thousands) traded.
Pressure had to be > 10 at one time to be listed.
G is the G-Spot, and is the number of days
in a row it has gone down/stayed even.
D is the Depth, and is the number of days
it has been in Death Drop mode. Will become more accurate atgb.
Volts represents Pressure divided by the Gap (high low range).
Watts represents Pressure divided by the Net (open close range).
 SYMB    Last   Chg     G       D     Pressure Volts  Watts   Speed    Power   Torque   3 Day Drop    (4/5 Day Drop)    Volume

 AFPW   0.0115  -21%  	1	7	9.7	24	28	103	0.5	-80	-21%		-28/-24		747,900
 ALKN   0.0190  0%  	5	3	8.8	20	8,796	0	0.8	90	-5%		-14/-32		423,900
 APTD @ 0.0044  16%  	0	99	310.0	3,444	6,199	-189	0.6	-41	-8%		-28/-19		78,472,400
 AVLS   0.0090  -18%  	5	4	0.3	2	2	42	0.2	-51	-44%		-65/-69		35,000
 BEHL   0.0028  -13%  	5	3	91.4	1,523	4,569	56	1.0	93	-22%		-39/-43		31,507,700
 BLLB   0.0003  0%  	5	3	5.5	552	552	0	1.0	202	-40%		-50/-63		15,766,300
 BSOM @ 0.0060  20%  	0	99	1.7	12	12	-2E8	1.3	691	0%		-14/-14		257,100
 CMGR   0.0117  4%  	0	2	5.8	10	11	-7	1.7	-50	-61%		-38/-49		408,200
 CNEX   0.0012  -20%  	4	8	42.3	1,410	1,410	68	1.3	19	-29%		-33/-29		31,335,300
 CTYX   0.0001  0%  	5	4	8.6	857	8,570	0	0.7	198	-50%		-67/-83		57,136,400
 CYBLD @ 0.0120  18%  	0	99	20.7	28	34	-71	0.1	-21	-25%		-27/-50		1,409,700
 CYGX   0.0275  -17%  	1	1	4.4	8	18	53	0.7	218	-31%		-31/-31		146,100
 DGMA   0.0027  42%  	0	1	72.5	426	906	-185	2.6	-27	23%		8/-87		33,720,300
 DLCR @ 0.0100  100%  	0	99	0.4	1	1	-1E9	0.3	-62	0%		0/0		50,000
 DNDT   0.0100  0%  	6	3	0.0	0	0	0	0.0	-100	-29%		-31/-47		0
 ECPL   0.0003  -67%  	4	1	113.7	1,896	2,275	92	2.0	624	-73%		-73/-70		189,572,100
 EDWY @ 0.0026  13%  	0	99	8.0	266	799	-98	0.5	-83	-13%		-10/-32		3,133,100
 EMLL   0.0008  0%  	2	2	123.6	4,121	12,364	0	3.1	5	-27%		-64/-11		145,457,300
 ENTI @ 0.0004  33%  	0	99	39.4	1,972	3,944	-167	0.9	-59	-20%		-20/-20		131,459,400
 ESYR   0.0010  -9%  	8	6	5.3	266	532	55	1.2	2870	-17%		-17/-23		5,319,900
 ETNL   0.0052  4%  	0	2	29.8	595	1,488	-19	2.0	217	-21%		-35/-25		6,011,900
 EXPU   0.0018  -28%  	4	1	4.0	57	67	74	1.2	-36	-38%		-45/-44		1,956,500
 FDMF @ 0.0030  20%  	0	99	3.0	59	59	-2E8	0.7	-76	0%		0/-6		1,077,000
 GTLL   0.0002  0%  	14	13	3.2	3,191	3,191	0	0.8	1362	-33%		-33/-33		15,953,300
 HSCO   0.0049  -42%  	5	4	52.8	75	147	93	6.9	324	-46%		-65/-70		7,039,900
 HYBE @ 0.0002  100%  	0	99	4.3	435	435	-100	0.4	120	100%		100/100		28,997,500
 IAGI   0.0122  -19%  	1	1	12.0	36	36	63	0.8	-22	-29%		-30/-28		863,400
 IARO   0.0003  0%  	4	2	3.0	295	2,953	0	0.7	-78	-25%		-40/-25		11,810,700
 IFMX   0.0130  30%  	0	1	9.7	16	54	-59	2.7	217	-51%		117/225		879,500
 INIX   0.0013  -7%  	3	1	8.0	133	199	20	1.6	2374	-35%		-19/-19		5,690,700
 IXOG @ 0.0160  60%  	0	99	2.9	3	3	-100	1.1	1.2726E6	60%		60/60		140,000
 MASP   0.0058  0%  	1	17	1.3	65	65	0	0.0	-36	5%		5/5		220,000
 MNDP   0.0031  -9%  	3	1	111.4	1,392	1,591	20	1.7	-1	-44%		24/41		32,755,000
 NGHI   0.0225  -17%  	3	1	4.0	5	16	47	0.6	-89	-36%		-31/-38		151,400
 NPER @ 0.0120  20%  	0	99	2.1	15	15	-60	0.5	-53	33%		0/-8		165,000
 NSMSF   0.0050  -75%  	6	1	27.2	15	18	81	17.0	2110	-92%		-92/-92		2,475,700
 NWMT   0.0007  -13%  	6	6	53.5	1,785	2,677	34	2.6	166	-36%		-42/-50		62,984,400
 NWTT   0.0004  0%  	5	3	19.3	1,934	19,343	0	0.9	46	-20%		-33/-33		55,266,400
 NXPN   0.0036  0%  	10	8	0.0	0	0	0	0.0	-100	0%		-3/-3		0
 NXTI   0.0095  -13%  	2	1	4.4	13	18	17	2.4	-80	-74%		-74/-72		425,100
 OOGI   0.0140  -2%  	4	8	2.9	26	96	12	0.8	69	-18%		-22/-20		198,300
 OPMG   0.0130  8%  	0	2	2.6	26	26	-208	0.4	-64	4%		-28/-24		209,000
 OWVI   0.0011  -15%  	1	3	22.4	746	2,239	49	1.5	7	-31%		-31/-35		17,908,500
 PCLI   0.0022  -33%  	2	1	96.1	800	961	86	4.0	243	-39%		-27/-19		36,945,200
 PYBX @ 0.0005  67%  	0	99	8.4	422	422	-267	0.4	9	25%		-29/0		21,087,700
 QEGY   0.0050  0%  	59	60	0.0	0	0	0	0.0	-100	0%		0/0		0
 QMIN   0.0005  0%  	9	2	1.0	980	980	0	0.4	-60	-17%		-38/-38		1,960,000
 RELM   0.0004  0%  	5	3	10.1	1,007	10,069	0	1.1	310	0%		0/-33		28,769,300
 RICP   0.0001  0%  	60	12	0.2	200	200	0	0.1	-66	0%		0/0		2,000,000
 SLRW   0.0050  -17%  	2	1	15.8	25	158	46	0.6	2394	-36%		-31/-47		3,281,700
 SMPP   0.0003  0%  	3	1	50.5	5,048	50,480	0	2.4	-12	-50%		-25/-25		201,920,600
 SMVI   0.0041  3%  	0	2	52.5	437	874	-7	2.9	106	-37%		-35/-13		11,921,300
 SSPT   0.0001  0%  	19	17	4.3	4,273	4,273	0	0.5	475	0%		0/0		42,725,100
 SWRS   0.0001  0%  	12	9	0.2	17	17	0	0.1	152	0%		0/-50		1,116,100
 SYNW   0.0100  0%  	14	5	0.3	260	260	0	0.2	-67	-20%		-20/-20		26,000
 TAON   0.0220  -8%  	1	2	34.4	46	53	19	2.6	110	-44%		-54/-27		1,388,000
 TDGI   0.0300  0%  	5	3	14.4	36	110	0	0.2	-51	-6%		-25/-32		478,400
 TFBN   0.0001  0%  	24	22	0.0	0	0	0	0.0	-100	0%		0/0		0
 TGGI   0.0003  -25%  	2	2	53.7	2,684	5,368	50	1.2	-38	-50%		-63/-50		178,932,200
 TTDZ   0.0001  0%  	16	7	0.0	0	0	0	0.0	-100	0%		0/0		0
 UWRL   0.0014  -13%  	4	1	75.7	1,894	3,787	42	1.6	31	-30%		-33/-18		50,494,300
 VCTY   0.0090  8%  	0	4	64.5	379	64,475	-84	1.5	25	-10%		-28/-40		7,911,000
 WNCG @ 0.0019  73%  	0	99	21.1	192	422	-204	8.2	486	36%		27/19		11,415,000
 WTCT   0.0011  -31%  	1	8	2.1	19	35	117	1.1	-72	-27%		-27/-21		1,258,900
 WWEI @ 0.0110  22%  	0	99	4.9	12	25	-267	0.4	-67	-8%		-15/-15		445,700
 XYNH @ 0.0011  83%  	0	99	18.9	473	473	-146	5.3	2000	57%		10/-8		21,003,400
 ZLUS   0.0011  0%  	3	1	6.1	203	610	0	0.7	-57	-31%		-21/22		6,425,900
Death Drop v3.57 - 20100818 (>30% 3 Day Drop or 5 day drop > 50%) -
Google Ron Paul, our Last Hope
We are starting our OWN Company (LINA):
Message Board: http://investorshub.advfn.com/boards/board.aspx?board_id=14808
Website: http://www.LighthouseNova.com
Modifications: Finally aligned the columns! (Sort of)
Graduate Flag: If the symbol has an @ sign
next to it, it means that the stock has risen enough to leave the DD Zone.
Speed is the rate of change today, vs the total 3 day drop
i.e. it is the current "drop speed" of the stock. A negative speed
means the price is rising.
Power is vol today divided by 20 day avg volume. i.e. a power value of 2.6
would mean the volume was 2.6 times the 20 day avg volume.
Torque is the % change in volume today vs yesterday.
Pressure is the dollar amount (in thousands) traded.
Pressure had to be > 10 at one time to be listed.
G is the G-Spot, and is the number of days
in a row it has gone down/stayed even.
D is the Depth, and is the number of days
it has been in Death Drop mode. Will become more accurate atgb.
Volts represents Pressure divided by the Gap (high low range).
Watts represents Pressure divided by the Net (open close range).
 SYMB    Last   Chg     G       D     Pressure Volts  Watts   Speed    Power   Torque   3 Day Drop    (4/5 Day Drop)    Volume

 AAVG @ 0.0144  20%  	0	99	0.8	3	41	-83	0.0	-96	-24%		-24/-20		62,000
 AFPW   0.0146  6%  	0	6	47.8	133	797	-66	2.6	220	-9%		-4/-9		3,738,200
 ALKN   0.0190  0%  	4	2	4.5	22	22	0	0.4	7	-14%		-32/-24		223,500
 APCX @ 0.0007  75%  	0	99	15.8	394	788	-450	1.2	241	17%		75/0		26,274,300
 APTD   0.0038  -3%  	3	4	530.2	8,836	10,604	7	1.0	-9	-38%		-30/-55		132,545,400
 ATIG @ 0.0050  67%  	0	99	0.0	13	13	-190	0.0	-100	35%		0/11		2,500
 AVLS   0.0110  0%  	4	3	0.8	8	816	0	0.4	-75	-58%		-62/-58		71,000
 BEHL   0.0032  -6%  	4	2	53.1	759	1,329	19	0.5	18	-30%		-35/39		16,352,600
 BLLB   0.0003  0%  	4	2	1.8	183	1,826	0	0.4	-41	-50%		-63/-40		5,217,500
 BSOM   0.0050  -2%  	5	31	0.2	4	4	7	0.2	-88	-29%		-29/-38		32,500
 CMGR   0.0112  -44%  	2	1	11.9	17	18	107	3.7	378	-41%		-51/-44		818,800
 CNEX   0.0015  0%  	3	7	34.4	573	3,436	0	1.1	-25	-17%		-12/-6		26,434,500
 CTYX   0.0001  -50%  	4	3	2.9	288	2,879	75	0.2	-43	-67%		-83/-80		19,195,900
 CYBLD   0.0102  -27%  	4	5	23.2	40	40	71	0.1	-47	-38%		-58/-51		1,773,700
 DGMA @ 0.0019  90%  	0	99	80.3	423	893	-375	4.0	44	-24%		-91/-91		45,906,200
 DLCR   0.0050  0%  	5	2	0.8	4	796	0	0.8	-89	-50%		-50/-50		132,700
 DNDT   0.0100  0%  	5	2	0.1	60	60	0	0.1	-99	-31%		-47/-47		6,000
 EDWY   0.0023  -23%  	2	4	48.4	538	691	113	3.4	134	-21%		-39/-26		18,977,800
 EMLL   0.0008  -38%  	1	1	151.9	2,531	2,531	60	3.5	262	-64%		-11/-33		138,064,300
 ENTI   0.0003  -40%  	6	1	128.5	6,424	6,424	100	2.1	682	-40%		-40/-50		321,193,700
 ESYR   0.0011  -8%  	7	5	0.2	21	21	100	0.0	124	-8%		-15/-35		179,100
 ETLT   0.0280  0%  	1	4	1.7	2	1,675	0	0.8	0	12%		-40/-42		50,000
 ETNL   0.0050  -9%  	3	1	10.4	104	1,044	24	0.7	-32	-38%		-28/-29		1,898,200
 FDMF   0.0025  -17%  	6	4	12.4	248	248	100	2.8	395	-17%		-22/-38		4,503,900
 GTLL   0.0002  0%  	13	12	0.3	27	27	0	0.1	-90	-33%		-33/-33		1,091,200
 HSCO   0.0085  -6%  	4	3	16.4	39	47	14	2.3	-9	-39%		-48/-39		1,660,500
 HYBE   0.0001  0%  	17	17	1.3	1,320	1,320	0	0.2	-13	0%		0/-50		13,197,400
 IARO   0.0003  -25%  	3	1	13.4	1,338	13,384	63	2.9	602	-40%		-25/50		53,536,600
 IXOG   0.0100  0%  	6	4	0.0	0	0	0	0.0	-100	0%		0/-23		0
 MASP   0.0058  4%  	0	16	2.0	49	66	-65	0.1	114	5%		5/5		346,100
 NPER   0.0100  5%  	0	3	4.1	12	4,103	-32	0.7	1904	-17%		-23/-25		350,700
 NSMG @ 0.0040  14%  	0	99	1.6	11	16	-1.429E8	0.7	-18	0%		-27/-33		433,800
 NWMT   0.0008  -20%  	5	5	22.5	751	1,126	60	1.1	-56	-33%		-43/-50		23,714,000
 NWTT   0.0004  0%  	4	2	13.2	1,323	1,323	0	0.6	-88	-33%		-33/0		37,801,800
 NXPN   0.0036  0%  	9	7	0.5	522	522	0	0.4	21	-3%		-3/-12		145,000
 OOGI   0.0143  -3%  	3	7	1.9	5	5	13	0.5	-25	-21%		-18/-17		117,100
 OPMG   0.0120  -6%  	1	1	6.7	33	111	19	1.1	264	-33%		-29/-29		576,000
 OTOW @ 0.0020  11%  	0	99	5.5	111	5,527	-1.111E8	0.2	437	0%		-26/-31		2,987,500
 OWVI   0.0013  8%  	0	2	21.7	542	1,084	-44	1.5	-29	-19%		-24/-24		16,671,300
 PYBX   0.0003  -40%  	1	1	7.8	389	389	70	0.4	-74	-57%		-40/-25		19,430,200
 QEGY   0.0050  0%  	58	59	0.0	0	0	0	0.0	-100	0%		0/0		0
 QMIN   0.0005  -17%  	8	1	2.7	269	269	44	1.0	-66	-38%		-38/-38		4,889,900
 RELM   0.0004  0%  	4	2	2.5	245	245	0	0.3	-26	0%		-33/-20		7,009,300
 RICP   0.0001  0%  	59	11	0.9	87	871	0	0.2	-97	0%		0/0		5,805,000
 SMVI   0.0040  -22%  	2	1	24.5	144	223	59	1.6	-65	-37%		-15/-22		5,774,700
 SPNGQ @ 0.0050  150%  	0	99	2.9	6	10	-1.5E9	0.7	-35	0%		400/0		1,131,000
 SSPT   0.0001  0%  	18	16	0.7	743	743	0	0.1	-94	0%		0/0		7,425,800
 STHG @ 0.0050  22%  	0	99	129.2	923	1,615	-159	0.9	4	-14%		-14/-14		26,910,900
 SWRS   0.0001  0%  	11	8	0.0	44	44	0	0.0	-95	0%		-50/-67		443,000
 SYNW   0.0100  -9%  	13	4	1.0	2	5	45	0.6	2553	-20%		-20/-33		79,600
 TAON   0.0240  4%  	0	1	17.6	35	88	-9	1.3	-65	-50%		-20/4		662,500
 TDGI   0.0300  0%  	4	2	27.8	52	348	0	0.5	-84	-25%		-32/-17		966,700
 TFBN   0.0001  0%  	23	21	0.0	0	0	0	0.0	-100	0%		0/0		0
 TGGI   0.0004  -43%  	1	1	159.3	3,187	5,311	86	2.0	671	-50%		-33/-50		289,682,500
 TTDZ   0.0001  0%  	15	6	0.0	0	0	0	0.0	-100	0%		0/0		0
 VCTY   0.0083  -13%  	5	3	57.1	300	336	38	1.3	45	-34%		-45/-53		6,308,800
 WNCG   0.0011  0%  	4	2	2.2	224	224	0	1.9	-53	-27%		-31/-27		1,948,000
 WTCT   0.0016  7%  	0	7	8.9	111	886	-100	4.0	4.026E7	7%		14/7		4,428,600
 WWEI   0.0090  -25%  	4	1	14.3	48	48	81	1.1	132	-31%		-31/-25		1,361,100
 XYNH   0.0006  -14%  	4	2	0.6	600	600	36	0.3	-86	-40%		-50/-25		1,000,300
SEWC fighting back
The Dust cloud is thinning, RM rumor on the buzz
Smitter SMTT
Yea, I'm not paying more than .0001 and I'm treating it like a lotto play. You never know when the next RS or AS increase occurs.
Good ol SEWC...that's a Golden Oldie...lol....Looks like there's some rumors/momo goin on........z
Oh wow, thanks. Let me know if there's anything u need help with.
PS: Me and some of the guys are thinking about playing SEWC tomorrow. Not going to pay any more than .0001. Strictly short-term. The SS is very nice for a .0001 stock
I'll get more details on our board.
No prob...I made you a God....er Mod....btw.......et z
Nice opportunities here z. NWTT dropped to .0002 today. Thanks for the hard work
Death Drop v3.57 - 20100817 (>30% 3 Day Drop or 5 day drop > 50%) -
Google Ron Paul, our Last Hope
We are starting our OWN Company (LINA):
Message Board: http://investorshub.advfn.com/boards/board.aspx?board_id=14808
Website: http://www.LighthouseNova.com
Modifications: Finally aligned the columns! (Sort of)
Graduate Flag: If the symbol has an @ sign
next to it, it means that the stock has risen enough to leave the DD Zone.
Speed is the rate of change today, vs the total 3 day drop
i.e. it is the current "drop speed" of the stock. A negative speed
means the price is rising.
Power is vol today divided by 20 day avg volume. i.e. a power value of 2.6
would mean the volume was 2.6 times the 20 day avg volume.
Torque is the % change in volume today vs yesterday.
Pressure is the dollar amount (in thousands) traded.
Pressure had to be > 10 at one time to be listed.
G is the G-Spot, and is the number of days
in a row it has gone down/stayed even.
D is the Depth, and is the number of days
it has been in Death Drop mode. Will become more accurate atgb.
Volts represents Pressure divided by the Gap (high low range).
Watts represents Pressure divided by the Net (open close range).
 SYMB    Last   Chg     G       D     Pressure Volts  Watts   Speed    Power   Torque   3 Day Drop    (4/5 Day Drop)    Volume

 AAVG   0.0120  -20%  	3	4	18.4	38	61	54	0.4	234	-37%		-33/-41		1,467,200
 AFPW   0.0138  -5%  	2	5	15.4	57	220	52	0.9	-62	-9%		-14/-19		1,169,800
 AGHD @ 0.0004  33%  	0	99	10.6	1,056	1,056	-3.333E8	1.6	-57	0%		0/-33		30,179,200
 ALKN   0.0190  -5%  	3	1	4.4	11	22	16	0.3	-64	-32%		-24/-27		209,300
 AMNG @ 0.0299  13%  	0	99	86.6	108	361	-160	0.2	-68	-8%		-29/-42		3,329,600
 APCX   0.0004  -20%  	2	2	3.5	347	347	2E8	0.4	-41	0%		-43/-50		7,710,700
 APTD   0.0039  -19%  	2	3	631.9	4,861	7,021	67	1.1	56	-28%		-54/-62		145,261,500
 ATIG   0.0030  -50%  	1	1	5.3	18	5,313	125	1.3	-42	-40%		-33/-33		1,180,700
 AVLS   0.0110  -31%  	3	2	3.8	6	8	50	1.5	20	-62%		-58/-58		289,000
 BEHL   0.0034  -6%  	3	1	45.6	759	2,278	18	0.4	-37	-31%		48/36		13,808,500
 BLLB   0.0003  -40%  	3	1	3.1	312	312	64	0.6	-69	-63%		-40/-50		8,910,000
 BSOM   0.0051  -15%  	4	30	1.4	8	15	55	1.3	255	-27%		-36/-34		266,300
 CNEX   0.0015  -12%  	2	6	56.1	1,403	2,806	100	1.5	326	-12%		-6/0		35,077,500
 CTYX   0.0002  0%  	3	2	5.1	509	5,086	0	0.4	-72	-67%		-60/-50		33,907,000
 CYBLD   0.0140  -13%  	3	4	51.8	104	259	30	0.2	-30	-42%		-33/-48		3,340,600
 DGMA   0.0010  -55%  	43	1	38.2	636	1,908	57	3.5	-19	-95%		-95/-95		31,804,900
 DKAM @ 0.0050  25%  	0	99	12.3	103	123	-442	0.7	-74	-6%		-6/-9		2,801,200
 DLCR   0.0050  -50%  	4	1	6.6	60	60	100	7.2	373	-50%		-50/-17		1,191,800
 DNDT   0.0100  -29%  	4	1	6.2	15	15	62	5.2	5628	-47%		-47/-33		515,500
 EDWY   0.0030  0%  	1	3	25.5	196	25,502	0	1.7	-23	-21%		-3/-6		8,095,900
 EMLL @ 0.0013  18%  	0	99	40.0	800	4,002	-41	1.2	-84	44%		8/-54		38,117,200
 ESYR   0.0012  0%  	6	4	0.1	96	96	0	0.0	-96	-8%		-29/-29		80,000
 ETLT   0.0280  8%  	0	3	1.7	2	1,668	-19	0.8	-16	-40%		-42/-44		49,800
 EXOU @ 0.0120  46%  	0	99	1.2	4	1,186	-139	0.1	-96	33%		9/-17		104,000
 FDMF   0.0030  0%  	5	3	3.4	14	68	0	0.6	131	-6%		-25/-32		910,500
 FEEL @ 0.0173  49%  	0	99	12.0	11	19	-230	2.7	6	-21%		-14/-14		1,032,400
 FRGY @ 0.0006  20%  	0	99	15.5	516	774	-2E8	9.2	109	0%		-25/-25		28,134,500
 GERSD @ 0.0009  29%  	0	99	96.9	1,385	4,847	-80	0.9	153	-36%		-47/-36		102,050,600
 GTLL   0.0002  -33%  	12	11	2.7	266	266	100	0.5	824	-33%		-33/-33		10,628,300
 HSCO   0.0090  0%  	3	2	20.0	33	200	0	2.9	51	-45%		-36/-42		1,818,500
 HYBE   0.0001  0%  	16	16	1.5	1,520	1,520	0	0.2	63	0%		-50/-50		15,200,000
 IXOG   0.0100  0%  	5	3	0.1	100	100	0	0.1	-97	0%		-23/-50		10,000
 MASP   0.0056  2%  	0	15	0.9	23	92	-100	0.0	-46	2%		2/0		162,000
 MINE @ 0.0100  11%  	0	99	6.2	62	62	-54	0.4	99	20%		23/12		652,100
 MRES @ 0.0270  35%  	0	99	17.4	25	25	-438	5.2	-1	8%		-13/-21		740,000
 NPER   0.0095  6%  	0	2	0.2	166	166	-21	0.0	-97	-27%		-29/-29		17,500
 NSMG   0.0035  -13%  	4	2	1.9	19	37	34	0.9	-7	-36%		-42/-38		530,300
 NWMT   0.0010  -9%  	4	4	65.4	1,634	3,268	32	2.4	99	-29%		-38/-29		54,466,200
 NWTT   0.0004  -20%  	3	1	106.1	3,538	10,613	60	4.8	418	-33%		0/-20		303,241,600
 NXPN   0.0036  0%  	8	6	0.4	432	432	0	0.3	58	-3%		-12/-40		120,000
 OHBIQ   0.0200  -5%  	4	2	2.3	1	2,252	6	2.8	-69	-80%		-85/-82		57,000
 OOGI   0.0147  -14%  	2	6	2.5	11	11	85	0.7	-58	-16%		-15/-14		155,500
 OTOW   0.0018  6%  	0	2	1.1	22	108	-18	0.0	-85	-33%		-38/-33		555,900
 OWVI   0.0012  -25%  	6	1	32.8	820	820	85	2.2	250	-29%		-29/-29		23,438,400
 PASO @ 0.0120  20%  	0	99	37.5	188	188	-100	2.6	22	20%		-20/-24		3,409,700
 PSGI @ 0.0048  33%  	0	99	3.8	21	32	-167	1.1	-63	-20%		-36/-30		972,000
 QEGY   0.0050  0%  	57	58	0.0	0	0	0	0.0	-100	0%		0/0		0
 RELM   0.0004  0%  	3	1	3.3	330	330	0	0.4	-91	-33%		-20/-20		9,437,500
 RICP   0.0001  0%  	58	10	28.7	2,868	28,681	0	8.0	1.7382E9	0%		0/0		191,205,500
 SPNGQ   0.0020  100%  	0	1	5.2	13	52	-100	1.2	1406	100%		-60/-60		1,729,000
 SSPT   0.0001  0%  	17	15	17.3	1,733	17,325	0	1.4	1416	0%		0/0		115,502,300
 STHG   0.0041  -16%  	7	1	112.7	867	1,879	56	0.8	-4	-29%		-29/-34		25,918,500
 SWRS   0.0001  0%  	10	7	1.3	133	1,327	0	0.4	22	-50%		-67/-67		8,848,100
 SYNW   0.0110  -12%  	12	3	0.0	33	33	100	0.0	-92	-12%		-27/-42		3,000
 TDCP @ 0.0033  10%  	0	99	2.0	1,980	1,980	-340	0.2	-86	-3%		-27/-18		600,000
 TDGI   0.0300  -6%  	3	1	169.9	140	850	20	3.0	106	-32%		-17/-13		5,869,800
 TFBN   0.0001  0%  	22	20	0.1	150	150	0	0.2	1.3636E7	0%		0/0		1,500,000
 TLAG @ 0.0015  15%  	0	99	0.1	150	150	-48	0.1	-95	-32%		-21/-42		100,000
 TTDZ   0.0001  0%  	14	5	0.2	190	190	0	0.3	-67	0%		0/-67		1,900,000
 VCTY   0.0095  -5%  	4	2	49.6	118	1,653	14	0.9	-45	-37%		-46/-34		4,349,500
 WNCG   0.0011  -21%  	3	1	5.2	172	172	69	4.2	351	-31%		-27/-35		4,125,000
 WTCT   0.0015  0%  	2	6	0.0	0	0	0	0.0	-100	7%		0/-17		0
 XYNH   0.0007  0%  	3	1	4.6	462	462	0	2.5	386	-42%		-13/-13		7,112,800
Death Drop v3.57 - 20100816 (>30% 3 Day Drop or 5 day drop > 50%) -
Google Ron Paul, our Last Hope
We are starting our OWN Company (LINA):
Message Board: http://investorshub.advfn.com/boards/board.aspx?board_id=14808
Website: http://www.LighthouseNova.com
Modifications: Finally aligned the columns! (Sort of)
Graduate Flag: If the symbol has an @ sign
next to it, it means that the stock has risen enough to leave the DD Zone.
Speed is the rate of change today, vs the total 3 day drop
i.e. it is the current "drop speed" of the stock. A negative speed
means the price is rising.
Power is vol today divided by 20 day avg volume. i.e. a power value of 2.6
would mean the volume was 2.6 times the 20 day avg volume.
Torque is the % change in volume today vs yesterday.
Pressure is the dollar amount (in thousands) traded.
Pressure had to be > 10 at one time to be listed.
G is the G-Spot, and is the number of days
in a row it has gone down/stayed even.
D is the Depth, and is the number of days
it has been in Death Drop mode. Will become more accurate atgb.
Volts represents Pressure divided by the Gap (high low range).
Watts represents Pressure divided by the Net (open close range).
 SYMB    Last   Chg     G       D     Pressure Volts  Watts   Speed    Power   Torque   3 Day Drop    (4/5 Day Drop)    Volume

 AAVG   0.0150  -21%  	2	3	8.1	12	16	126	0.1	-58	-17%		-26/-61		439,000
 AFPW   0.0145  -9%  	1	4	45.7	114	183	100	2.5	-55	-9%		-15/-20		3,049,900
 AGHD   0.0003  -25%  	6	4	20.9	1,046	2,092	100	4.0	34	-25%		-50/-50		69,732,900
 AMNG   0.0265  -22%  	1	1	283.8	218	378	60	0.7	38	-37%		-49/-48		10,320,300
 APCX   0.0005  -17%  	1	1	7.2	721	7,211	58	0.7	-60	-29%		-38/-71		13,110,900
 APTD   0.0048  -21%  	1	2	506.5	2,666	3,618	49	0.8	-16	-44%		-53/-14		92,935,800
 ATIG @ 0.0060  62%  	0	99	9.1	30	61	-186	2.4	-45	33%		33/-22		2,028,100
 AVLS   0.0160  -38%  	2	1	5.4	4	4	100	1.4	-84	-38%		-38/-36		240,100
 BSOM   0.0060  -14%  	3	29	0.5	3	3	57	0.4	319	-25%		-22/-33		75,000
 CNEX   0.0017  -6%  	1	5	14.4	1,440	1,440	89	0.4	-40	6%		13/0		8,228,600
 CTYX   0.0002  -33%  	2	1	24.4	1,221	24,430	56	1.5	-39	-60%		-50/-60		122,149,400
 CYBLD   0.0160  -3%  	2	3	83.6	279	1,673	13	0.3	-34	-24%		-41/-53		4,778,800
 DKAM   0.0040  -17%  	12	9	42.1	351	843	68	2.9	24	-25%		-27/-31		10,804,700
 EDWY   0.0030  3%  	0	2	40.9	205	215	-107	2.3	187	-3%		-6/-14		10,488,600
 ELCR @ 0.0005  25%  	0	99	44.4	4,440	4,440	-2.5E8	0.9	7	0%		-17/25		98,662,600
 EMLL   0.0011  -50%  	1	1	469.5	1,956	4,268	600	7.8	125	-8%		-61/-100		234,732,700
 ESYR   0.0012  0%  	5	3	2.1	212	212	0	0.4	39	-29%		-29/-60		1,843,600
 ETLT   0.0260  4%  	0	2	1.8	2	1,812	-9	1.0	-81	-46%		-48/-48		59,400
 EXOU   0.0082  3%  	0	4	24.5	123	306	-10	2.4	83	-25%		-43/-49		2,882,700
 EXTO @ 0.0005  25%  	0	99	6.7	669	669	-100	0.8	124	25%		0/-29		14,865,000
 FDMF   0.0030  0%  	4	2	1.2	1,185	1,185	0	0.3	-70	-25%		-32/-25		395,000
 FEEL   0.0116  -28%  	2	1	16.0	15	15	65	2.6	266	-42%		-42/-47		970,000
 FRGY   0.0005  -17%  	8	1	6.7	337	6,744	44	8.1	206	-38%		-38/-38		13,489,000
 GERSD   0.0007  -30%  	3	1	30.3	606	3,029	51	0.4	18	-59%		-50/600		40,385,600
 GTLL   0.0003  0%  	11	10	0.3	345	345	0	0.1	51	0%		0/0		1,150,000
 HSCO   0.0090  -36%  	2	1	14.4	24	29	100	2.2	231	-36%		-42/-44		1,201,800
 HYBE   0.0001  0%  	15	15	1.4	140	140	0	0.1	-63	-50%		-50/-50		9,332,700
 IXOG   0.0100  0%  	4	2	3.4	5	24	0	2.5	1341	-23%		-50/-9		288,100
 MASP   0.0055  0%  	4	14	1.7	42	1,695	0	0.0	56	0%		-2/4		297,300
 MINE   0.0090  0%  	1	4	3.0	61	3,033	0	0.2	-49	11%		1/0		327,900
 MRES   0.0200  6%  	0	2	15.4	17	77	-18	6.8	126	-35%		-41/-33		750,500
 NPER   0.0090  -25%  	5	1	6.5	22	22	77	1.3	210	-32%		-33/-35		620,500
 NSMG   0.0040  0%  	3	1	3.4	6	37	0	1.0	-18	-33%		-29/-33		571,000
 NWMT   0.0011  -8%  	3	3	35.6	891	1,782	27	1.3	82	-31%		-21/-45		27,407,700
 NXPN   0.0036  -3%  	7	5	0.4	1	4	22	0.2	6.9081E5	-12%		-40/-40		76,000
 OHBIQ   0.0210  -65%  	3	1	10.9	1	1	78	9.9	642	-84%		-81/-81		181,900
 OOGI   0.0170  -6%  	1	5	6.8	10	68	320	1.6	1264	-2%		0/0		368,400
 OTOW   0.0017  -15%  	3	1	7.6	95	127	36	0.3	2	-41%		-37/-26		3,619,800
 PASO   0.0100  0%  	6	3	29.2	292	29,229	0	2.4	13	-33%		-37/-37		2,783,700
 PSGI   0.0036  6%  	0	2	10.0	251	251	-11	3.0	107	-52%		-48/-10		2,641,900
 QASP @ 0.0042  68%  	0	99	194.9	886	1,147	-110	2.9	110	62%		8/8		54,150,600
 QEGY   0.0050  0%  	56	57	0.0	0	0	0	0.0	-100	0%		0/0		0
 RICP   0.0001  0%  	57	9	0.0	0	0	0	0.0	-100	0%		0/0		0
 RIGH @ 0.0008  33%  	0	99	9.2	460	920	-3.333E8	0.2	-47	0%		-20/-20		13,145,600
 SMPP @ 0.0006  50%  	0	99	54.4	1,815	2,722	-250	2.4	56	20%		-14/20		120,989,200
 SSPT   0.0001  0%  	16	14	0.8	762	762	0	0.1	73	0%		0/-50		7,620,000
 SWRS   0.0001  0%  	9	6	1.1	108	108	0	0.3	-97	-67%		-67/-67		7,233,200
 SYNW   0.0125  0%  	11	2	0.5	473	473	0	0.2	-48	-17%		-34/-34		37,800
 TDCP   0.0030  -6%  	3	1	15.5	155	155	19	1.4	-38	-33%		-25/-25		4,424,100
 TFBN   0.0001  0%  	21	19	0.0	0	0	0	0.0	-100	0%		0/0		0
 TLAG   0.0013  -28%  	2	2	4.0	29	29	88	1.0	-18	-32%		-50/-57		2,000,900
 TTDZ   0.0001  0%  	13	4	0.6	577	577	0	0.8	-27	0%		-67/-83		5,767,700
 VCTY   0.0100  -20%  	3	1	90.3	226	258	46	1.7	-30	-44%		-31/-1		7,855,900
 WSTM   0.0300  -69%  	12	1	325.6	50	54	98	18.7	30508	-70%		-70/-73		5,662,500
 WTCT   0.0015  0%  	1	5	0.1	150	150	0	0.1	-92	0%		-17/-25		100,000
Best Stock on the OTC: JBII
This is the Death Drop Board. Death Drop Scans will be posted here.
Meatloaf fixed the columnts!!!.......Thank you!!!!
Death Drop (DD) stocks are ones that have had a SERIOUS drop in price in the last 3-5 days.They need to drop 30% in 3 days, or 50% in 5 days to make the list.
When they go back up, they are removed from the DD List.
The idea is that these have a semi good chance of bouncing.
Could have called it 'Phoenix Rising Possibilities' I suppose, but Death Drop has such a nice ring doesn't it?
This all started when I decided it would be better to try to get in at the bottoms of runs, instead of trying to get into the MOMO runs before they topped out.
So I started looking at the day's biggest losers, looking for a good place to get in.
Then I found a place to download end of day data for free (www.eoddata.com
Please post any errors, ideas for improvement, and whatever else you want about anything..............z
How to post charts:Meatloaf has recently updated the post process, so now it's much easier to add a chart or image.
Basics: Once you have an image displayed in your browser(right click, view image), you copy/paste the address out of your location bar and get rid of the http://www part. Enclose that image address link between (chart) ......link.......(/chart):
Change ( to [, and ) to ]. Change MRKL/RYQG to your symbol. See below.
1 Year
(chart)stockcharts.com/c-sc/sc?s=MRKL&p=D&yr=1&mn=0&dy=0&i=t81435580136&r=6989(/chart)
2 Year
(chart)stockcharts.com/c-sc/sc?s=MRKL&p=D&yr=2&mn=0&dy=0&i=t78793191896&r=7283(/chart)
3 Month
(chart)stockcharts.com/c-sc/sc?s=RYQG&p=D&yr=0&mn=3&dy=0&i=t67730622517&r=3095(/chart)
Yahoo Emoticons:
You can add these to your posts by putting the following line where you want them to appear:
[cha*rt]yimg.com/us.yimg.com/i/mesg/emoticons6/61.gif[/cha*rt]
BUT FIRST, you have to take out the 2 asterisks.
Each one has a number, so change the 61 in 61.gif above to the number of the one you want.
Here's a few to get you started. BTW, I have a text file on my desktop that has stuff in it that I use a lot, so you can put that line in there so you can quickly copy/paste it.....
1
2
3
4[cha*rt]l.yimg.com/us.yimg.com/i/mesg/emoticons7/4.gif[/cha*rt]
5
67
[cha*rt]l.yimg.com/us.yimg.com/i/mesg/emoticons7/107.gif[/cha*rt]
14
15
16
19
24
29
3136
3748
61
64
69[cha*rt]us.i1.yimg.com/us.yimg.com/i/mesg/emoticons6/69.gif[/cha*rt]
54
59[cha*rt]l.yimg.com/us.yimg.com/i/mesg/emoticons7/59.gif[/cha*rt]
65
You can find them here: (right click on the emoticon and pick 'save image as' to see what the number is. It'll be in the file name, and you can just kill that window):
http://messenger.yahoo.com/features/emoticons/
and the 'hidden' ones here:
http://messenger.yahoo.com/features/hiddenemoticons/
Z's Off The Wall Stocks
All the DD (Due Diligence) Links You Need (in order):
Chart:
Stockcharts.com
Skuttlebutt:
http://www.investorshub.com/boards/msgsearch.asp?txt2find=jbii (if this doesn't work...Pay IHub you cheap bastard..lol!)
Profile w/News:
Knobias killed their free profile... So, now you can use Yahoo.com to check the basic profile with regard to news, etc.
http://www.knobias.com/individual/public/index.htm (Scroll to the bottom to put in Symbol)
Filings:
http://www.pinksheets.com/quote/filings.jsp?symbol=jbii
That's right 4!...That's all you need. (For deeper DD, use your good friend Google).
Bonus Links:
BigCharts (For stocks StockCharts.com doesn't have) - http://bigcharts.marketwatch.com/intchart/frames/frames.asp?symb=anwm&time=6&freq=1
Market Pulse - http://www.otcbbtrader.com/portal/goto.dll?cat=200
OTCBB 'Daily List' - http://www.otcbb.com/DailyList/
Detailed Trading History - http://stockcharts.com/webcgi/wb.exe?Data.web+PSUY
Revision History:
v. 6.70. Changed price cutoff from .0008 to .0005.
v. 6.65 - Added Watts. This is the dollars traded (Pressure)
divided by the hi/lo range and normalized. High Watts means a lot
of ducats were traded with not much movement up or down.....
Also put decimal back on Pressure (this makes it easier to read if you remember that Pressure and Power have a decimal).
NASDAQ stocks that go up >5% get dropped.
v. 6.50 - Changed program so that if a stock has become a DD,
it will remain on the scan list until it has increased in
price by at least 10%. Let me know what you all think about this.
v. 6.20 - Gave back the decimal to Power..it needs it..
v. 6.15 - Increased Volts factor.
v. 6.10 - Added Voltage (Volts), got rid of decimals.
v. 5.31 - Changed Gorgeous to the G-Spot..he he
v. 5.30 - Added Gorgeous. This is the number of days in a row that it's been going down/staying even.
ok, I'm tired of putting all these revisions in here...maybe makingbacon can take over...let's see if he reads this..lol...
READ THIS:
Ok might as well put one of these in here also. Basically I will only address 3 issues:
#1 If you go by what we say here and buy some stock and lose your kids college fund, DO NOT come crying to us. We are all big boys and girls here and hopefully take FULL RESPONSIBILITY for our actions. Make your OWN decisions and take responsibility for them!.
#2 I myself am sick to death of all the political 'correctness' pervading our country. SO if you are easily offended by lack of such PC, this board is not for you..go elsewhere. And if I ever find the sonofabitch that changed Junior High School to 'Middle School', I'm gonna shoot 'em...lol.. z
#3 I follow a true 'laissez faire' policy in both my life and on this board. In the old days this was also called 'Different strokes for different folks'. I am NOT in this world to judge others, SO, except for stock spamming, pretty much anything goes.
ScreenShot of Program:
Google Ron Paul!!!
Lighthouse Nova Inc.
Patterns:
1. When a stock graduates, and the pressure is over 10 or so, there's a good chance the bounce will continue. I've added a second line
to the streamer list at the bottom that shows these.
If you come up with a pattern, post it, and I'll add it to the IBox
z
| Volume | |
| Day Range: | |
| Bid Price | |
| Ask Price | |
| Last Trade Time: |