 News
News  Market Data
  Discover
Support: 888-992-3836
Copyright © 2023 InvestorsHub Inc.


Register for free to join our community of investors and share your ideas. You will also get access to streaming quotes, interactive charts, trades, portfolio, live options flow and more tools.
#DDAmanda Chart on: $TPII (#DDAmanda Pick) :
You can find these before they run.

What the Fact (Factor) Column is:
The Factor is a proprietary indicator used for scanning in #DDAmanda.
It's defined as Today's $Traded divided by the average daily $Traded (20 day avg).
SO, if a stock has say a 10 Factor that day, it means she traded 10 Times the $ she normally trades.
That's significant, and many times indicates that a run in the stock is coming.

#DDAmanda Chart on: $ETEK :
You can scan for these before they run.

What the Fact (Factor) Column is:
The Factor is a proprietary indicator used for scanning in #DDAmanda.
It's defined as Today's $Traded divided by the average daily $Traded (20 day avg).
SO, if a stock has say a 10 Factor that day, it means she traded 10 Times the $ she normally trades.
That's significant, and many times indicates that a run in the stock is coming.
#DDAmanda Chart on: $PTE up 83% since Alert:
You can scan for these before they run.

What the Fact (Factor) Column is:
The Factor is a proprietary indicator used for scanning in #DDAmanda.
It's defined as Today's $Traded divided by the average daily $Traded (20 day avg).
SO, if a stock has say a 10 Factor that day, it means she traded 10 Times the $ she normally trades.
That's significant, and many times indicates that a run in the stock is coming.
#DDAmanda Chart on: $VIZC up 88% since Alert :
You can scan for these before they run.

What the Fact (Factor) Column is:
The Factor is a proprietary indicator used for scanning in #DDAmanda.
It's defined as Today's $Traded divided by the average daily $Traded (20 day avg).
SO, if a stock has say a 10 Factor that day, it means she traded 10 Times the $ she normally trades.
That's significant, and many times indicates that a run in the stock is coming.
#DDAmanda Chart on: $NUGN Up 30% Since Alert :
You can scan for these before they run.

What the Fact (Factor) Column is:
The Factor is a proprietary indicator used for scanning in #DDAmanda.
It's defined as Today's $Traded divided by the average daily $Traded (20 day avg).
SO, if a stock has say a 10 Factor that day, it means she traded 10 Times the $ she normally trades.
That's significant, and many times indicates that a run in the stock is coming.
Good to know that !
Thank you very much Bro !
#DDAmanda Chart on: $KGKG Up 428% since Alert :
You can scan for these before they run.

What the Fact (Factor) Column is:
The Factor is a proprietary indicator used for scanning in #DDAmanda.
It's defined as Today's $Traded divided by the average daily $Traded (20 day avg).
SO, if a stock has say a 10 Factor that day, it means she traded 10 Times the $ she normally trades.
That's significant, and many times indicates that a run in the stock is coming.
Pretty sure $TPII is gonna make you a happy camper!
z
Yes , i will buy some this week !
GLTU ! GLTA !
Get some $TPII.....gonna blow up soon......don't miss that one.....
z
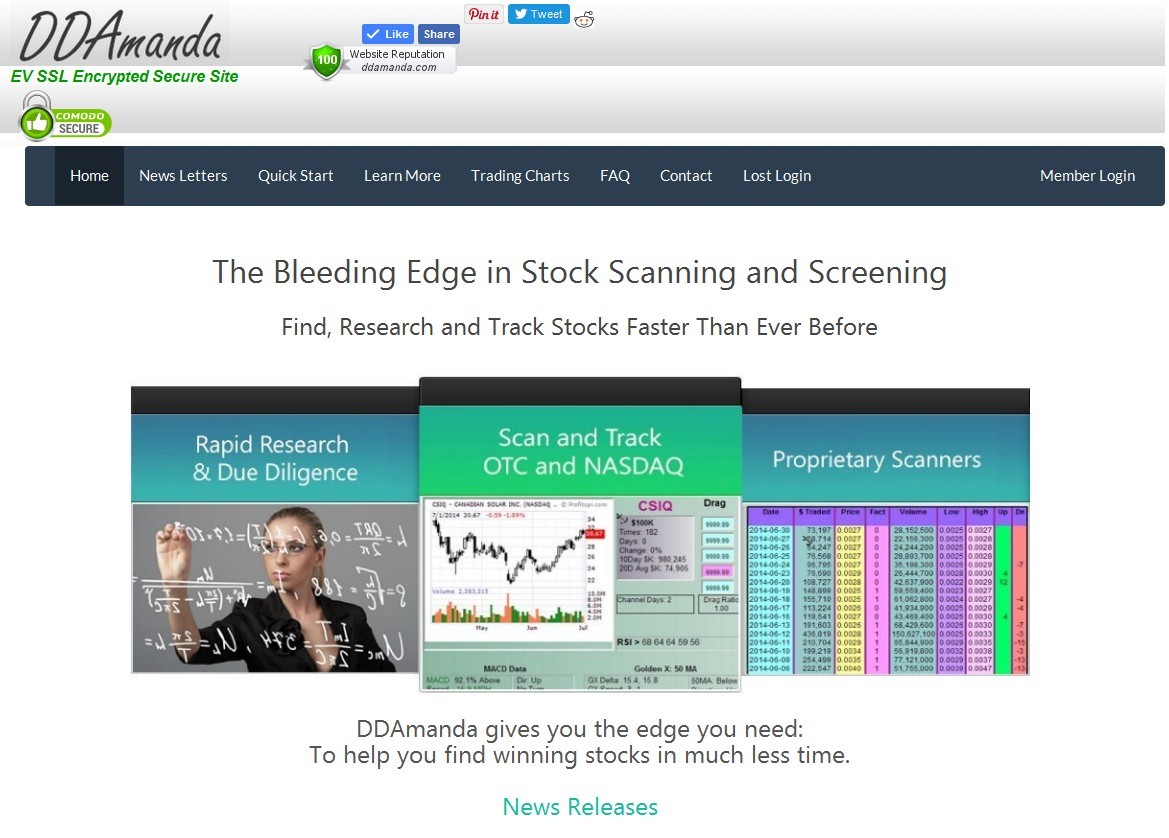
#DDAmanda: How to Trade Stocks and make Winning Trades.
#DDAmanda will help you with your stock trading. You will be able to scan all stocks using our stock trading software, to find winners. Even if you don't know how to trade stocks, DDAmanda has both instructional and trading information that will get you started in a very short time frame.
For instance, using our Insider Scan, you will be able to find stocks that are beginning to trade with unusual volume. This could indicate insider trading by people that know things the general public does not. And you can get in early on these plays, before the obvious becomes general public knowledge.
z
Wow !
Missed that one !
GLTU ! GLTA !
#DDAmanda Chart on: $KGKG Up 428% since Alert :
You can scan for these before they run.

What the Fact (Factor) Column is:
The Factor is a proprietary indicator used for scanning in #DDAmanda.
It's defined as Today's $Traded divided by the average daily $Traded (20 day avg).
SO, if a stock has say a 10 Factor that day, it means she traded 10 Times the $ she normally trades.
That's significant, and many times indicates that a run in the stock is coming.
#DDAmanda Chart on: $NICH:
You can scan for these before they run.

What the Fact (Factor) Column is:
The Factor is a proprietary indicator used for scanning in #DDAmanda.
It's defined as Today's $Traded divided by the average daily $Traded (20 day avg).
SO, if a stock has say a 10 Factor that day, it means she traded 10 Times the $ she normally trades.
That's significant, and many times indicates that a run in the stock is coming.
#DDAmanda Chart on: $SBES up 86% since Alert :
You can scan for these before they run.

What the Fact (Factor) Column is:
The Factor is a proprietary indicator used for scanning in #DDAmanda.
It's defined as Today's $Traded divided by the average daily $Traded (20 day avg).
SO, if a stock has say a 10 Factor that day, it means she traded 10 Times the $ she normally trades.
That's significant, and many times indicates that a run in the stock is coming.
Sent you a PM.....but here's the same info for anybody else that's wondering:
Ok.......I get what you're saying.
Lots of stocks run off a 200 Day low......
DDAmanda alerts you to those stocks.
And you're right......only some of them will run.......also depends on what level that 200 Day low is at ........like if it's at a support level or not.....or at price points like 5, 10, 15, etc.
SO, you have to evaluate the ones that DDAmanda finds for you.
And if one looks good.....has no conv debt, etc....has good fundies.....is waiting for a development....has hit a channel.....etc.......you can take a position and have a very good chance of making some money.
Hope that clears it up.......OH........and the same goes for a high Factor....but the chances are greater that one of those will run, just based on the high Factor....fwiw.
z
3-23 and 3-31 ....There's arrows pointing to them....
z
What day was your alert on PUGE?
#DDAmanda Chart on: $PUGE up 500% since Alert :
You can scan for these before they run.

What the Fact (Factor) Column is:
The Factor is a proprietary indicator used for scanning in #DDAmanda.
It's defined as Today's $Traded divided by the average daily $Traded (20 day avg).
SO, if a stock has say a 10 Factor that day, it means she traded 10 Times the $ she normally trades.
That's significant, and many times indicates that a run in the stock is coming.
#DDAmanda Chart on: $ARAFF up 161% from first Alert:
You can scan for these before they run.
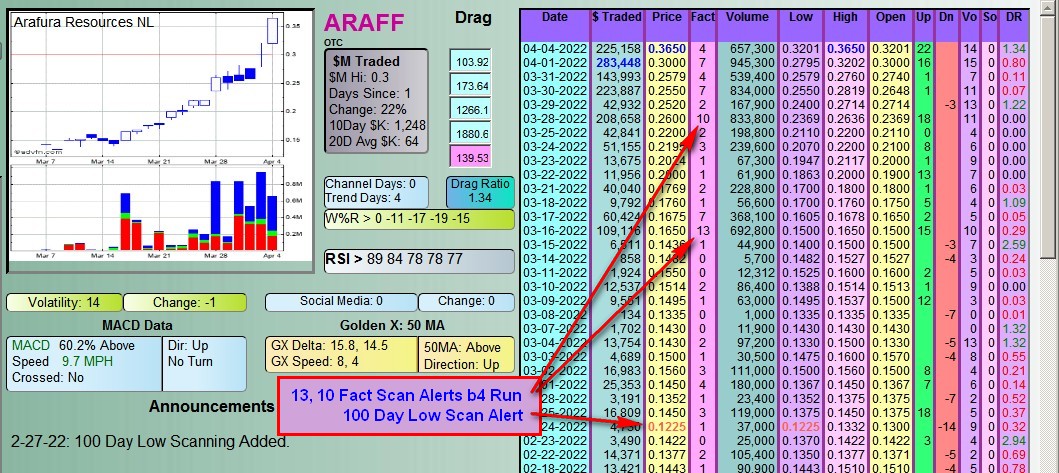
What the Fact (Factor) Column is:
The Factor is a proprietary indicator used for scanning in #DDAmanda.
It's defined as Today's $Traded divided by the average daily $Traded (20 day avg).
SO, if a stock has say a 10 Factor that day, it means she traded 10 Times the $ she normally trades.
That's significant, and many times indicates that a run in the stock is coming.
#DDAmanda Chart on: $IGEX up 177% from Alert :
You can scan for these before they run.

What the Fact (Factor) Column is:
The Factor is a proprietary indicator used for scanning in #DDAmanda.
It's defined as Today's $Traded divided by the average daily $Traded (20 day avg).
SO, if a stock has say a 10 Factor that day, it means she traded 10 Times the $ she normally trades.
That's significant, and many times indicates that a run in the stock is coming.
#DDAmanda Chart on: $KATX up 105% from Alert :
You can scan for these before they run.

What the Fact (Factor) Column is:
The Factor is a proprietary indicator used for scanning in #DDAmanda.
It's defined as Today's $Traded divided by the average daily $Traded (20 day avg).
SO, if a stock has say a 10 Factor that day, it means she traded 10 Times the $ she normally trades.
That's significant, and many times indicates that a run in the stock is coming.
#DDAmanda Chart on: $NNRX :
You can scan for these before they run.

What the Fact (Factor) Column is:
The Factor is a proprietary indicator used for scanning in #DDAmanda.
It's defined as Today's $Traded divided by the average daily $Traded (20 day avg).
SO, if a stock has say a 10 Factor that day, it means she traded 10 Times the $ she normally trades.
That's significant, and many times indicates that a run in the stock is coming.
#DDAmanda Chart on: $ALST:
You can scan for these before they run.

What the Fact (Factor) Column is:
The Factor is a proprietary indicator used for scanning in #DDAmanda.
It's defined as Today's $Traded divided by the average daily $Traded (20 day avg).
SO, if a stock has say a 10 Factor that day, it means she traded 10 Times the $ she normally trades.
That's significant, and many times indicates that a run in the stock is coming.
#DDAmanda Chart on: $NTRR Up 129% from Alert:
You can scan for these before they run.

What the Fact (Factor) Column is:
The Factor is a proprietary indicator used for scanning in #DDAmanda.
It's defined as Today's $Traded divided by the average daily $Traded (20 day avg).
SO, if a stock has say a 10 Factor that day, it means she traded 10 Times the $ she normally trades.
That's significant, and many times indicates that a run in the stock is coming.
#DDAmanda Chart on: $NUGS Up 133% since Alert:
You can scan for these before they run.

What the Fact (Factor) Column is:
The Factor is a proprietary indicator used for scanning in #DDAmanda.
It's defined as Today's $Traded divided by the average daily $Traded (20 day avg).
SO, if a stock has say a 10 Factor that day, it means she traded 10 Times the $ she normally trades.
That's significant, and many times indicates that a run in the stock is coming.
#DDAmanda Chart on: $WDDD Up 503% from Alert:
You can scan for these before they run.

What the Fact (Factor) Column is:
The Factor is a proprietary indicator used for scanning in #DDAmanda.
It's defined as Today's $Traded divided by the average daily $Traded (20 day avg).
SO, if a stock has say a 10 Factor that day, it means she traded 10 Times the $ she normally trades.
That's significant, and many times indicates that a run in the stock is coming.
#DDAmanda Chart on: $SPRV Up 214% from Alert:
You can find these before they run.

What the Fact (Factor) Column is:
The Factor is a proprietary indicator used for scanning in #DDAmanda.
It's defined as Today's $Traded divided by the average daily $Traded (20 day avg).
SO, if a stock has say a 10 Factor that day, it means she traded 10 Times the $ she normally trades.
That's significant, and many times indicates that a run in the stock is coming.
#DDAmanda Chart on: $JPEX Up 69% from Alert:
You can scan for these before they run.

What the Fact (Factor) Column is:
The Factor is a proprietary indicator used for scanning in #DDAmanda.
It's defined as Today's $Traded divided by the average daily $Traded (20 day avg).
SO, if a stock has say a 10 Factor that day, it means she traded 10 Times the $ she normally trades.
That's significant, and many times indicates that a run in the stock is coming.
#DDAmanda Chart on: $FDBL Up 62% from Alert:
You can find these before they run.

What the Fact (Factor) Column is:
The Factor is a proprietary indicator used for scanning in #DDAmanda.
It's defined as Today's $Traded divided by the average daily $Traded (20 day avg).
SO, if a stock has say a 10 Factor that day, it means she traded 10 Times the $ she normally trades.
That's significant, and many times indicates that a run in the stock is coming.
#DDAmanda Chart on: $JAGX Up 45% from Alert:
You can find these before they run.

What the Fact (Factor) Column is:
The Factor is a proprietary indicator used for scanning in #DDAmanda.
It's defined as Today's $Traded divided by the average daily $Traded (20 day avg).
SO, if a stock has say a 10 Factor that day, it means she traded 10 Times the $ she normally trades.
That's significant, and many times indicates that a run in the stock is coming.
#DDAmanda Chart on: $LWLG Up 46% since Alert:
You can scan for these before they run.

What the Fact (Factor) Column is:
The Factor is a proprietary indicator used for scanning in #DDAmanda.
It's defined as Today's $Traded divided by the average daily $Traded (20 day avg).
SO, if a stock has say a 10 Factor that day, it means she traded 10 Times the $ she normally trades.
That's significant, and many times indicates that a run in the stock is coming.
#DDAmanda Chart on: $IFXY Up 63% since Alert:
You can scan for these before they run.

What the Fact (Factor) Column is:
The Factor is a proprietary indicator used for scanning in #DDAmanda.
It's defined as Today's $Traded divided by the average daily $Traded (20 day avg).
SO, if a stock has say a 10 Factor that day, it means she traded 10 Times the $ she normally trades.
That's significant, and many times indicates that a run in the stock is coming.
#DDAmanda Chart on: $GGSM Up 60% Since Alerts :
You can scan for these before they run.

What the Fact (Factor) Column is:
The Factor is a proprietary indicator used for scanning in #DDAmanda.
It's defined as Today's $Traded divided by the average daily $Traded (20 day avg).
SO, if a stock has say a 10 Factor that day, it means she traded 10 Times the $ she normally trades.
That's significant, and many times indicates that a run in the stock is coming.
#DDAmanda Chart on: $CLNV Up 42% since Alert :
You can scan for these before they run.

What the Fact (Factor) Column is:
The Factor is a proprietary indicator used for scanning in #DDAmanda.
It's defined as Today's $Traded divided by the average daily $Traded (20 day avg).
SO, if a stock has say a 10 Factor that day, it means she traded 10 Times the $ she normally trades.
That's significant, and many times indicates that a run in the stock is coming.
#DDAmanda Chart on: $BASA Up 178% since Alert:
You can scan for these before they run.

What the Fact (Factor) Column is:
The Factor is a proprietary indicator used for scanning in #DDAmanda.
It's defined as Today's $Traded divided by the average daily $Traded (20 day avg).
SO, if a stock has say a 10 Factor that day, it means she traded 10 Times the $ she normally trades.
That's significant, and many times indicates that a run in the stock is coming.
#DDAmanda Chart on: $AAU Up 63% from Alert:
You can find these before they run.
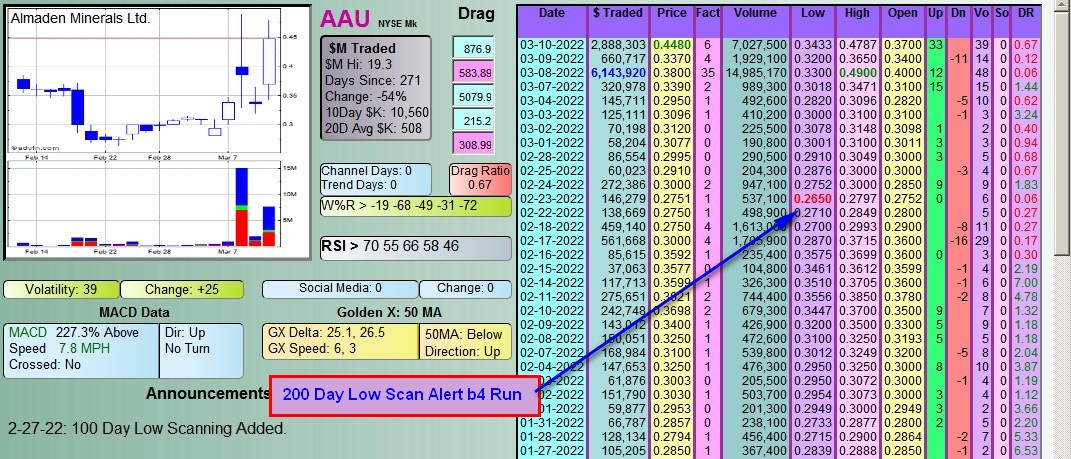
What the Fact (Factor) Column is:
The Factor is a proprietary indicator used for scanning in #DDAmanda.
It's defined as Today's $Traded divided by the average daily $Traded (20 day avg).
SO, if a stock has say a 10 Factor that day, it means she traded 10 Times the $ she normally trades.
That's significant, and many times indicates that a run in the stock is coming.
#DDAmanda Chart on: $TPII (#DDAmanda Pick) :
You can find these before they run.

What the Fact (Factor) Column is:
The Factor is a proprietary indicator used for scanning in #DDAmanda.
It's defined as Today's $Traded divided by the average daily $Traded (20 day avg).
SO, if a stock has say a 10 Factor that day, it means she traded 10 Times the $ she normally trades.
That's significant, and many times indicates that a run in the stock is coming.
#DDAmanda Chart on: $NIKLF Up 45% since Alert :
You can scan for these before they run.

What the Fact (Factor) Column is:
The Factor is a proprietary indicator used for scanning in #DDAmanda.
It's defined as Today's $Traded divided by the average daily $Traded (20 day avg).
SO, if a stock has say a 10 Factor that day, it means she traded 10 Times the $ she normally trades.
That's significant, and many times indicates that a run in the stock is coming.
#DDAmanda Chart on: $SLRX Up 35% since Alert:
You can scan for these before they run.

What the Fact (Factor) Column is:
The Factor is a proprietary indicator used for scanning in #DDAmanda.
It's defined as Today's $Traded divided by the average daily $Traded (20 day avg).
SO, if a stock has say a 10 Factor that day, it means she traded 10 Times the $ she normally trades.
That's significant, and many times indicates that a run in the stock is coming.
#DDAmanda Chart on: $TXMD Up 96% from Alert:
You can find these before they run.

What the Fact (Factor) Column is:
The Factor is a proprietary indicator used for scanning in #DDAmanda.
It's defined as Today's $Traded divided by the average daily $Traded (20 day avg).
SO, if a stock has say a 10 Factor that day, it means she traded 10 Times the $ she normally trades.
That's significant, and many times indicates that a run in the stock is coming.
#DDAmanda Chart on: $LRDC Up 136% from Alert:
You can find these before they run.

What the Fact (Factor) Column is:
The Factor is a proprietary indicator used for scanning in #DDAmanda.
It's defined as Today's $Traded divided by the average daily $Traded (20 day avg).
SO, if a stock has say a 10 Factor that day, it means she traded 10 Times the $ she normally trades.
That's significant, and many times indicates that a run in the stock is coming.
#DDAmanda Chart on: $TPII (#DDAmanda Pick):
You can find these before they run.

What the Fact (Factor) Column is:
The Factor is a proprietary indicator used for scanning in #DDAmanda.
It's defined as Today's $Traded divided by the average daily $Traded (20 day avg).
SO, if a stock has say a 10 Factor that day, it means she traded 10 Times the $ she normally trades.
That's significant, and many times indicates that a run in the stock is coming.
#DDAmanda Chart on: $APMCF Up 70% from Alert:
You can find these before they run.
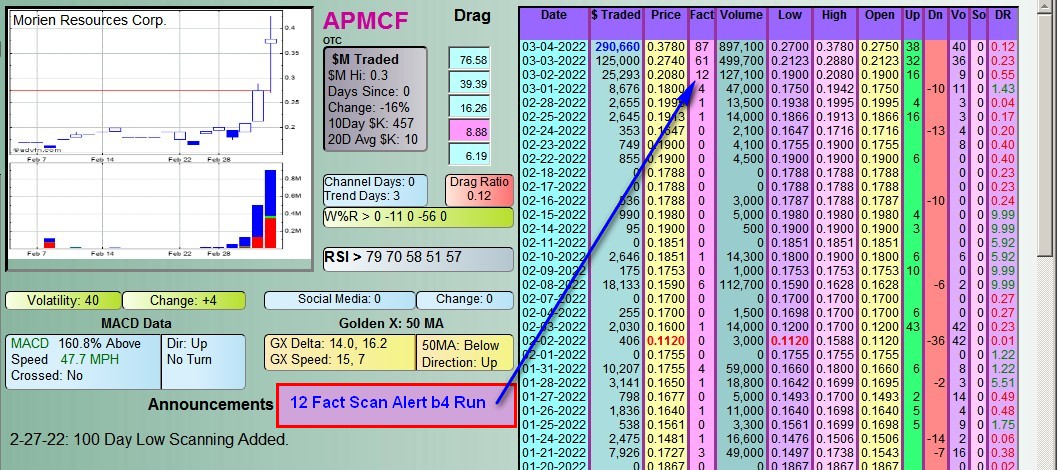
What the Fact (Factor) Column is:
The Factor is a proprietary indicator used for scanning in #DDAmanda.
It's defined as Today's $Traded divided by the average daily $Traded (20 day avg).
SO, if a stock has say a 10 Factor that day, it means she traded 10 Times the $ she normally trades.
That's significant, and many times indicates that a run in the stock is coming.
#DDAmanda Chart on: $TSOI Up 83% :
You can scan for these before they run.

What the Fact (Factor) Column is:
The Factor is a proprietary indicator used for scanning in #DDAmanda.
It's defined as Today's $Traded divided by the average daily $Traded (20 day avg).
SO, if a stock has say a 10 Factor that day, it means she traded 10 Times the $ she normally trades.
That's significant, and many times indicates that a run in the stock is coming.
#DDAmanda Chart on: $ELEK up 300% :
You can scan for these before they run.

What the Fact (Factor) Column is:
The Factor is a proprietary indicator used for scanning in #DDAmanda.
It's defined as Today's $Traded divided by the average daily $Traded (20 day avg).
SO, if a stock has say a 10 Factor that day, it means she traded 10 Times the $ she normally trades.
That's significant, and many times indicates that a run in the stock is coming.
#DDAmanda Chart on: $MOHO :
You can scan for these before they run.

What the Fact (Factor) Column is:
The Factor is a proprietary indicator used for scanning in #DDAmanda.
It's defined as Today's $Traded divided by the average daily $Traded (20 day avg).
SO, if a stock has say a 10 Factor that day, it means she traded 10 Times the $ she normally trades.
That's significant, and many times indicates that a run in the stock is coming.
#DDAmanda Chart on: $AVGR :
You can find these before they run.

What the Fact (Factor) Column is:
The Factor is a proprietary indicator used for scanning in #DDAmanda.
It's defined as Today's $Traded divided by the average daily $Traded (20 day avg).
SO, if a stock has say a 10 Factor that day, it means she traded 10 Times the $ she normally trades.
That's significant, and many times indicates that a run in the stock is coming.
Thanks!......looks like Oil futures are doing pretty good.....
z
|
Followers
|
490
|
Posters
|
|
|
Posts (Today)
|
0
|
Posts (Total)
|
2614
|
|
Created
|
07/26/12
|
Type
|
Premium
|
| Moderator Zardiw | |||
| Assistants Law_Abiding_Citizen7 rt1127 | |||
|
Posts Today
|
0
|
|
Posts (Total)
|
2614
|
|
Posters
|
|
|
Moderator
|
|
|
Assistants
|
| Volume | |
| Day Range: | |
| Bid Price | |
| Ask Price | |
| Last Trade Time: |


