 News
News  Market Data
  Discover
Support: 888-992-3836
Copyright © 2023 InvestorsHub Inc.


Register for free to join our community of investors and share your ideas. You will also get access to streaming quotes, interactive charts, trades, portfolio, live options flow and more tools.
Here's some AIM history with a "mature" company....................................


In this example, I've capped "max cash" at about 50% of portfolio value and used "vealies" when that's satisfied. This is quite a bit of activity in the last three years but all that cash put back to work could offer some pretty good future harvests.
Best wishes,
OAG Tom
Hi JD, Re: v-Wave histogram.......................

It looks so far as though the v-Wave has done a pretty good job defining this most recent market low point. Appreciation potential going forward from here would appear to be slightly better than median.
Best wishes,
OAG Tom
My various portfolios thru July:
U.S. Sector ETF Portfolio

International "Style" ETF Portfolio

Tom's "Sandbox" 10 Stock Portfolio

Tom's Simple Contributory IRA

There's still Cash held in Reserve should last week's action not continue. Reserves are low but are enough for another round of buying should that opportunity become available.
Have a happy Weekend,
OAG Tom
Some good news for Retirees in the U.S.
Actuary tables for life expectancy were changed for a longer life expectancy so Required Minimum Distributions will be less.
https://www.msn.com/en-us/money/retirement/good-news-for-retirees-rmd-formula-changing-for-first-time-in-decades/ar-AAYvggL?ocid=entnewsntp&cvid=053dd620ad134eb89f7915527662e9f7
Best wishes,
OAG Tom
VWave 3.0*
Suggested Starting Cash Value For New AIM Accounts/Positions
Individual Stocks
High Risk: At or above 51%
Neutral: Between 37 and 50%
Low Risk: At or below 36%
Diversified Funds
High Risk: At or above 34%
Neutral: Between 25 and 33%
Low Risk: At or below 24%
_________________________
Week of August 5th
_________________________
Short Term (18 Months)
Individual Stocks: 35% (Up 17 from previous week)
Diversified Mutual Funds
or Portfolio: 23% (Up 11 from previous week)
__________________________
Long Term (3-5 Years)
Individual Stocks: 42% (Up 1 from previous week)
Diversified Mutual Funds
or Portfolio: 28% (Up 1 from previous week)
Oscillator: -2.22 (Up 1.58 from previous week)
*See posts #44585 and #44588 for Tom's explanation
Here's an AIM example with a solar company's stock. The investment was started in 2014, so has had time for some "sunrises" and "sunsets."
https://investorshub.advfn.com/boards/read_msg.aspx?message_id=169533667
At 5 minutes per transaction if the account started with $10,000 value, the hourly rate for AIM's management would be $1628/Hr!!!
Have a great weekend,
OAG Tom
Old-john
Jeff Weber AIMs actual option prices.
I on the other hand pretend I own the actual shares. So it just leaves extra cash in my account which allows me to continue to buy at lower prices or diversify.
I like to put them on after a market crash.
Toofuzzy
Thanks for posting this link. Always interested in hearing about new ideas. Bear buy and super bear buy strategies are new for me. The leap options sound interesting but perhaps somewhat risky. I wonder how this approach would do in a prolonged bear market?
Long time AIM user and teacher Jeff Weber has a new video out on Youtube for your enjoyment.
Good morning JD, Re: v-Wave latest..........................

It would appear we're attempting to form a bottom of sorts here. Risk seems to be flattening out along with the major market indexes.
Tom's International Equity Warehouse has given the Sales Department the summer off while the Purchasing Dept has been working overtime.
Best wishes,
OAG Tom
VWave 3.0*
Suggested Starting Cash Value For New AIM Accounts/Positions
Individual Stocks
High Risk: At or above 51%
Neutral: Between 37 and 50%
Low Risk: At or below 36%
Diversified Funds
High Risk: At or above 34%
Neutral: Between 25 and 33%
Low Risk: At or below 24%
_________________________
Week of July 29th
_________________________
Short Term (18 Months)
Individual Stocks: 18% (Up 3 from previous week)
Diversified Mutual Funds
or Portfolio: 12% (Up 2 from previous week)
__________________________
Long Term (3-5 Years)
Individual Stocks: 41% (Unchanged from previous week)
Diversified Mutual Funds
or Portfolio: 27% (Unchanged from previous week)
Oscillator: -3.80 (Up .30 from previous week)
*See posts #44585 and #44588 for Tom's explanation
I sold 5% of my CRSP shares two days ago at $86+ and today it's off to below $75/share. AIM once again gave me good advice in a timely fashion. The price still h as to decline another $7/share before AIM will trigger a buy back of 12% more shares.
I've only owned this stock since May, so don't have a lot of history so far.

......and no buybacks as of yet. So far, so good.
BTW, this is in my "sandbox stocks" basket. I don't recommend stocks or any such, just reporting on what I've done since May.
Have a great weekend,
OAG Tom
Thanks BB, Re: Markets' next move..............................................
The v-Wave does appear to show the Bear Rampage might be tiring. Another measure of what has been happening is to look at market speculation. Here's my interpretation of that in recent years:

It would appear that speculative money has gone into hiding now. Those bearish peaks back in 2020 and 2021 showed the flood of money moving into the markets. This most recent few weeks shows a real dearth of buying pressure. In Value Line last week the "best performer" was up only 49% over the most recent 13 weeks. Compare that to the "worst" being down over 80% and we can see those dollar bills scampering off to "safer" places. Going back to the start of 2022 we saw the "best" stock up 101% while the "worst was down just 60%. That was the tailing off of the huge cash driven speculative wave.
There are some seriously wounded portfolios out there where less than prudent herd following was the modus operandi. I don't think those dollars will hurry back to the markets. In the mean time Mr. Lichello's AIM has opened up purse strings and allowed some cash to flow back. Those investments were sucked into the market's downward vortex even when fundamentals were solid.
Buy from the Scared, Sell to the Greedy!
Best wishes,
OAG Tom
$SLV Breaking out today here we go
Hi JD,
Looking Good!

OAG
VWave 3.0*
Suggested Starting Cash Value For New AIM Accounts/Positions
Individual Stocks
High Risk: At or above 51%
Neutral: Between 37 and 50%
Low Risk: At or below 36%
Diversified Funds
High Risk: At or above 34%
Neutral: Between 25 and 33%
Low Risk: At or below 24%
_________________________
Week of July 22nd
_________________________
Short Term (18 Months)
Individual Stocks: 15% (Down 3 from previous week)
Diversified Mutual Funds
or Portfolio: 10% (Down 2 from previous week)
__________________________
Long Term (3-5 Years)
Individual Stocks: 41% (Unchanged from previous week)
Diversified Mutual Funds
or Portfolio: 27% (Unchanged from previous week)
Oscillator: -4.10 (Up .33 from previous week)
*See posts #44585 and #44588 for Tom's explanation
So far I seem to have caught the bottom. I must have bought from those that had margin calls.
Toofuzzy
Hi Toof, RE: HASI Shorting..............................
All those selling will need someone to buy those shares. AIMers cash might end up in their pockets but the shares will be the AIMers.
I have an order in for 12% more shares so we'll see how it plays out. The price/share is almost exactly where it was when the position was started in April, 2020.
Best wishes,
OAG Tom
Someone decided to short HASI and it dropped 20%, so I bought 20% more.
I hope this is not one of those cases where the shorts are actually right.
Toofuzzy
Thanks for that clip. I'd not ever seen that one. I should have grown a ZZ Top Beard for the tour!
OAG Tom
One "sharp-dressed" guy. I'm sure that you turned a lot of heads along the way!!!
A 2592 Mile Adventure completed successfully in early June in my '33 FFR Hot Rod. There wasn't a single day it didn't warm to between 95°F and 100°. The car ran perfectly the whole way. The Driver consumed gallons of water and (of course) V-8 Veggie drink.

"If you wanna run Cool, you've got to run on Heavy Heavy Fuel......"
- Mark Knopfler, Dire Straiits
....."In Living Color...."

It's nice to see the market risk as interpreted by the v-Wave back below Median after so much time spent in bearish territory.
OAG Tom
VWave 3.0*
Suggested Starting Cash Value For New AIM Accounts/Positions
Individual Stocks
High Risk: At or above 51%
Neutral: Between 37 and 50%
Low Risk: At or below 36%
Diversified Funds
High Risk: At or above 34%
Neutral: Between 25 and 33%
Low Risk: At or below 24%
_________________________
Week of July 15th
_________________________
Short Term (18 Months)
Individual Stocks: 18% (Down 2 from previous week)
Diversified Mutual Funds
or Portfolio: 12% (Down 1 from previous week)
__________________________
Long Term (3-5 Years)
Individual Stocks: 41% (Down 1 from previous week)
Diversified Mutual Funds
or Portfolio: 27% (Down 1 from previous week)
Oscillator: -4.43 (Down 1.04 from previous week)
*See posts #44585 and #44588 for Tom's explanation
Hi Toof,


OAG Tom
Happy Independence Day,
Happy Financial Independence Day, too...
OAG Tom
VWave 3.0*
Suggested Starting Cash Value For New AIM Accounts/Positions
Individual Stocks
High Risk: At or above 51%
Neutral: Between 37 and 50%
Low Risk: At or below 36%
Diversified Funds
High Risk: At or above 34%
Neutral: Between 25 and 33%
Low Risk: At or below 24%
_________________________
Week of July 8th
_________________________
Short Term (18 Months)
Individual Stocks: 20% (Up 25 from previous week)
Diversified Mutual Funds
or Portfolio: 13% (Up 16 from previous week)
__________________________
Long Term (3-5 Years)
Individual Stocks: 42% (Up 3 from previous week)
Diversified Mutual Funds
or Portfolio: 28% (Up 2 from previous week)
Oscillator: -3.39 (Up 3.06 from previous week)
*See posts #44585 and #44588 for Tom's explanation
Thank you Clive,
Interesting and closely correlates with the v-Wave in risk assessment. I'm not out of cash yet, so we must not be at the 'botttom' yet.
OAG Tom
Hi Tom
By another measure ... downside risk was greater at the start of 2022 than at the start of 2000

Clive.
Time…sprinkled with discipline and patience.
Take care.
Jon
Robert Lichello's AIM - The perfect Portfolio Gyroscope.....
Example:

Some might say to start with these three objectives:
1) Price appreciation over time
2) Dividend capture over time
3) Profitable Volatility capture over time.
These are not mutually exclusive goals. Once the objectives are defined you then need gyroscopic precision to keep on target. Yes, there will be times when conditions will try to knock you off course. That's where the portfolio gyroscope will come in handy.
Best wishes,
OAG Tom
PS: Note the common feature of all three objectives - TIME...
Thanks JD, Re: v-Wave direction..........................

It's nice to see the v-Wave completely below the Median value now.
Best wishes,
OAG Tom
VWave 3.0*
Suggested Starting Cash Value For New AIM Accounts/Positions
Individual Stocks
High Risk: At or above 51%
Neutral: Between 37 and 50%
Low Risk: At or below 36%
Diversified Funds
High Risk: At or above 34%
Neutral: Between 25 and 33%
Low Risk: At or below 24%
_________________________
Week of July 1st
_________________________
Short Term (18 Months)
Individual Stocks: -5% (Down 10 from previous week)
Diversified Mutual Funds
or Portfolio: -3% (Down 6 from previous week)
__________________________
Long Term (3-5 Years)
Individual Stocks: 39% (Down 2 from previous week)
Diversified Mutual Funds
or Portfolio: 26% (Down 1 from previous week)
Oscillator: -6.45 (Down .88 from previous week)
*See posts #44585 and #44588 for Tom's explanation
Hi Tom
A friend tried E85 the other day and decided the lower price was a wash with lower milage..
Eventually we may run our cars on water run thru fuel cells after the oxygen is SEPERATE from the hydrogen.
Toofuzzy
Hi Toof, Re: Buying..........................
My VNQ REIT tripped a buy yesterday, the first one in a long time. I'm getting buys in other income producing investments as the interest rates have been climbing. This has been happening when my long time favorite REIT, WPC, has been stretching toward the next Sell signal at around $87/share.
A couple of my "sandbox stocks" have triggered some buying as well. One exception has been CRSP which I only just started as an addition to the Sandbox in recent times. It's been throwing off Sell signals of 5% of position on a frequent basis recently. Then, after my last sale at $71+ it reversed course and dropped toward the buy end of things. Not there yet, but it's trying.
My portfolio of international "style" ETFs has been accumulating shares in EFG and PIZ - both 'growth' oriented ex US funds. The 'value' components have been slower to drop and are holding up better right now. The overall shift from cash to equity has been slow but steady. So far June has not been an exception.
I tried to listen to CNBC this AM for a while and have to say that I got nothing of value out of it. I think the Cartoon Channel gives better advice! Of note was that the price of regular unleaded gasoline rose from $2/gal to $5/gal and the POTUS has asked Congress to remove the $0.18/gal tax from gas. Hmmmm, I don't think that's going to do much to mitigate the $3.00/gal price rise. (but it did get 'headlines')
I returned from a 2592 mile tour of the deep South last Saturday. It would have been a nicer trip if the temperature had been 10° to 15° cooler. I decided my car runs better on gasoline without "corn gas" being added. Many of the southern states don't sell ethanol laced gas. Mileage goes up when ethanol goes down.
Best wishes,
OAG Tom
Added 10% to my holdings of SCCO. PROBABLY way early but AIM says to buy.. last sale was at $77 just bought at $55.78
Toofuzzy
Hi Tom..
There is an old Wall Street adage: "You make most of your money in a bear market; you just don't realize it at the time." AIMers do. ;o)
Take care.
Jon
Hi Jon,
Here's a haiku for tomorrow's opening..................
Everyone agrees.
"This is a scary market!"
Load the Shopping Cart!
Hi Tom…
In looking back, the short term actually jumped over into minus territory. Sort of like oil futures not too long ago!
Take care.
Jon
Good morning Jon, Re: Current v-Wave and history..................
Here's how it looks after last week's dismal market performances:

That's a pretty significant down draft in just one week. I'm watching the 18 Month v-Wave closely and comparing it to the Covid Valley. It looks like we're not there yet.
Thanks and Best Wishes,
OAG Tom
VWave 3.0*
Suggested Starting Cash Value For New AIM Accounts/Positions
Individual Stocks
High Risk: At or above 51%
Neutral: Between 37 and 50%
Low Risk: At or below 36%
Diversified Funds
High Risk: At or above 34%
Neutral: Between 25 and 33%
Low Risk: At or below 24%
_________________________
Week of June 24th
_________________________
Short Term (18 Months)
Individual Stocks: 5% (Down 30 from previous week)
Diversified Mutual Funds
or Portfolio: 3% (Down 20 from previous week)
__________________________
Long Term (3-5 Years)
Individual Stocks: 41% (Down 4 from previous week)
Diversified Mutual Funds
or Portfolio: 27% (Down 3 from previous week)
Oscillator: -5.57 (Down 3.75 from previous week)
*See posts #44585 and #44588 for Tom's explanation
I've never tried it.
When an AIM account has used up all its cash I have used a 0.8 divisor on the last buy to come up with a selling price for those last purchased shares. I think I called it a black swan sale. It puts a bit of cash back in the account if the share price declines again. But it does make the next sell price even higher.
The idea was to recycle those dollars if the market is at a cyclical bottom with no upside breakout. I used the previous last buy price as the buy target after such a sale.
Then I went back to the regular AIM sell signals and just waited. Not fun, but it worked in the '08-'09 crash.
Keep me posted on your progress.
OAG Tom
Hi Tom, let's say you have 4 consecutive buys and your Buy Safe is 25. If your Sell Safe stays at 0 the hold zone becomes very wide and it's unlikely you'll get a sell for a long time. What I've been doing is subtracting 5 from my Sell Safe so it become negative. So with a Buy Safe of 25 my Sell Safe would be -15.
Do you do that as well?
I just had a GTC buy of BIB at $40
Toofuzzy
It seems the Market can't find it's own bottom even while groping with both hands!!!!
Take careful AIM and look for the whites of the seller's eyes
Best wishes,
OAG Tom
The month of May was a tough one for investors. AIM kicked in on the Buy side in most of my portfolios. Here's the overview for each one:
10 Stocks "Sandbox" portfolio

Note how the Cash Reserve has been shrinking for a while, transferring to the Equity side of AIM.
International Style ETF Portfolio

Since the start of 2022 cash has slowly moved over to the ETF side after building nicely since Covid.
Simple Contributory Retirement Account

Again, there's a bit of a flattening of the previous overall growth. Contributions plus a slight shift of the Twinvest allocation has softened the downturn seen in the equities markets.
U.S. Sector ETF Portfolio

Cash finally dipped in May with some share buying. Overall, this portfolio has held onto its value fairly well so far.
Best wishes,
OAG Tom
|
Followers
|
311
|
Posters
|
|
|
Posts (Today)
|
4
|
Posts (Total)
|
47282
|
|
Created
|
01/29/02
|
Type
|
Free
|
| Moderator OldAIMGuy | |||
| Assistants The Grabber Toofuzzy | |||
Here's a handy "Quick AIM Calculator" for finding the next AIM directed Buy and Sell prices for your portfolio holdings:
A.I.M. Users Bulletin Board (AIMUSERS): Thanks LC, Now they can use the "calculator" again! (advfn.com)
While the AIM book is no longer being reprinted, it is available from Amazon for their Kindle for $5.99.
http://www.amazon.com/How-Make-Stock-Market-Automatically-ebook/dp/B002VKJ1EI/ref=sr_1_1?s=books&ie=UTF8&qid=1395757939&sr=1-1&keywords=lichello
Mr. Lichello wrote the book on AIM in 1977. In the mid-'80s he put an infomercial on AIM on late night TV and attempted to sell his workbook and audio tapes.
(1) How To Make $1Million In The Stockmarket Infomercial - 1985 - YouTube
It's a reasonable review of the AIM method for those who are unfamiliar.

Run A Successful Equity Warehouse
Welcome to the AIM Users Bulletin Board. This is the thread to post your thoughts, questions and comments on the use of Robert Lichello's Automatic Investment Management for handling the risk of being involved in the Equities markets.
The AIM strategy gives the user LIFO gains of 20% minimum if the method is followed "by the book." It is ideally suited to those seeking long term investment growth while managing the risk of being invested.
Thoughts on being a successful Individual Investor
I wrote this book review a long time ago. It's a trader's interpretation of
Sun Tzu's "Art Of War." I related it to AIM as best I could.
------------------------------------------------------------------------
Mr. Lundell says, "Today's financial markets are the last bastion of unabashed conflict.....
To participate, you must be your own general, devising a strategy, gathering information, executing your plan, and adapting to the situation."
How can we use AIM and the v-Wave for strategic and tactical planning to carry out Mr. Lundell’s requirements to participate in the Equity Markets?
"Be your own general"
You are in charge. You are responsible. When you win, you benefit. When you lose, only you are to blame.
a) Broad trends persist. Discover them. They will survive boom and bust.
b) Don't contemplate engaging in war while beholden to another. They could become your ruler!
To me this means "Stay away from Margin Buying unless you are certain of victory."
c) Establish and maintain a "Baseline of Survival" for your command.
This is the "income" side of my overall portfolio.
d) Know that reality is governed by Darwinism; Long Term Survival belongs to the fittest.
"Devise a Strategy"
Our strategy is to sell inventory into market strength and to buy into market weakness. Robert Lichello's AIM algorithm provides us with a systematic approach to follow that employs this strategy.
a) Sell quality merchandise to all those willing to pay.
b) Buy quality merchandise when the price offers reasonable hope to resell at a profit.
c) Let the allocation of resources and inventory be governed by the course of the market and AIM's guidance.
"Gather Information"
Today there is no excuse for not being informed.
a) Differentiate between information VOLUME and QUALITY.
b) Differentiate between FACTS and OPINION.
c) Find good sources of judgement where you cannot act as judge.
d) Information is trusted only when provided by those proved trustworthy.
"Adapt to the Situation at Hand"
The v-Wave measures general U.S. Market Risk (and may be sensitive to world market risk) from low to average to high. This helps you gauge the situation by:
a) Gauging your initial cash reserve requirements on new investments
b) Gauging your on-going cash reserve requirements on established investments
c) Judging whether to establish a bias for accumulation or distribution
d) Possibly starting no new AIM accounts when the v-Wave is showing High Risk
e) Possibly ignoring all AIM Buy Signals during v-Wave High Risk events.
f) Following all AIM buy and sell signals during v-Wave Average Risk events
g) Possibly ignoring all AIM Sell signals during v-Wave Low Risk events
h) Re-assessing your "Baseline For Survival" at times when AIM has your account heavily in Cash
i) Always attempting to beat measured inflation by 5 basis points minimum after all taxes and living expenses are paid. If you do this consistently, in good and bad markets, you will be winning long term
j) Possibly using "vealies" when your positions are cash rich relative to the v-Wave. Limiting supply helps to keep Momentum player’s Demand high.
"Execute your Plan"
Set the plan in motion; know that it takes time for realization. Follow the plan without hesitation allowing the goals to be realized. The strategy is sound so execution is all that is required.
a) Buy when the plan says
b) Sell when the plan says
c) Be very patient when no buy or sell signals are being generated
Reading Mr. Lundell's interpretation of Sun Tzu's work will help you focus on your own plan. It will arm you with knowledge of what others not using AIM are doing in the market. Understanding Short Term Trader's strategy and tactics is like having a spy in the enemy's camp. AIM users can profit by knowing just how these people think and act. AIM acts as almost a mirror image of what goes on in a trader's mind.
-------------------------------------------------------------------------------------------------------------
The v-Wave........
Mr. Lichello used fixed cash starting levels; first it was 50/50 then 67/33 and in the last edition of his book 80/20 for the Equity/Cash ratio. This "one size fits all" approach is like a broken watch that shows the correct time twice a day but is wrong the rest of the time!
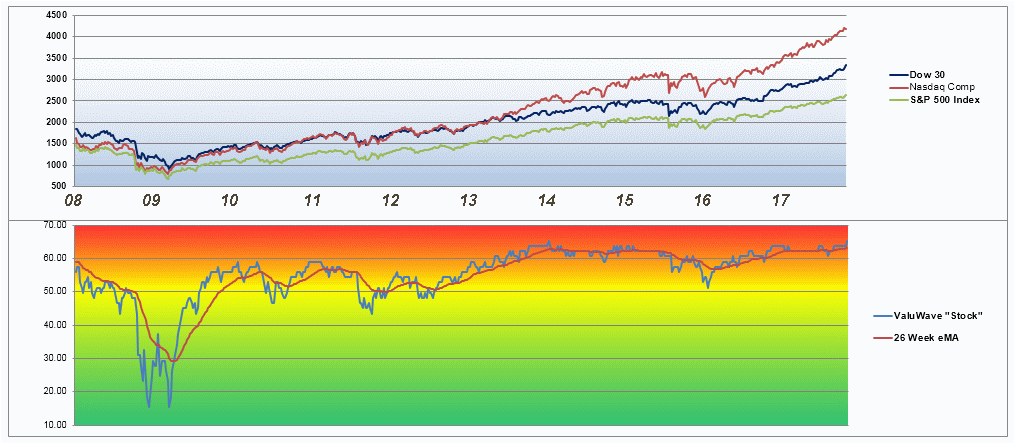
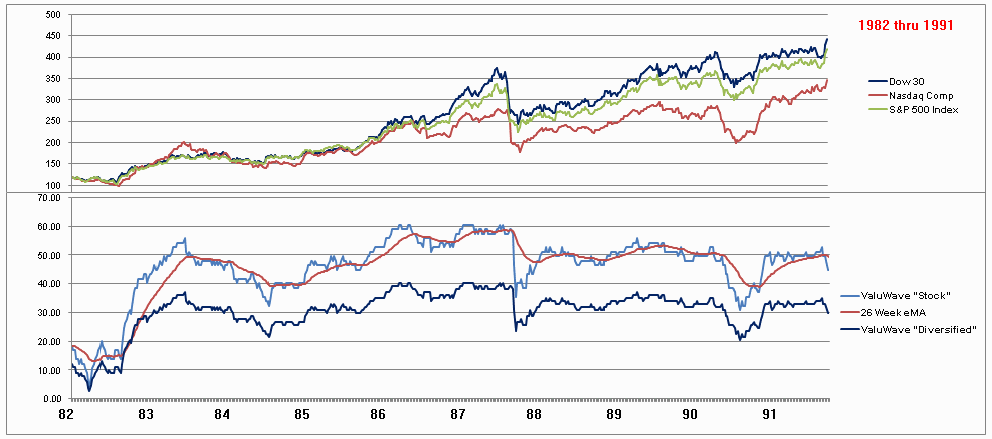
Minstrlman, a regular contributor here, helped gather data from Value Line and formed a highly capable risk-cash indicator for our use. Since then, J Derb continued his work each week. As an adjunct to the AIM methodology we now have a Cash Indicator which helps guide our starting and ongoing Cash Reserve level of AIM relative to measured market risk. It can be used as a general market barometer or specifically with the AIM method. The v-Wave (or VW) is derived from the Value Line "Appreciation Potential - Next 3-5 Years" (VLAP) indicator shown weekly in their Summary and Index Section for their 1700 stock edition. Looking back through V/L's history we find the peak Appreciation Potential occurred 12/23/1974 at +234%. Our continuous database starts January of 1982 and we scaled our "zero cash" to the market risk low point of early that year. We take the VLAP and manipulate it to get an indication of how much cash should be reserved for diversified mutual fund AIM accounts. It should be multiplied by your stock or portfolio's BETA to get the cash reserve level of less diversified or more aggressive holdings.
v-Wave Weekly Cash Reserve Indicator For AIM Users
Current years of the v-Wave:
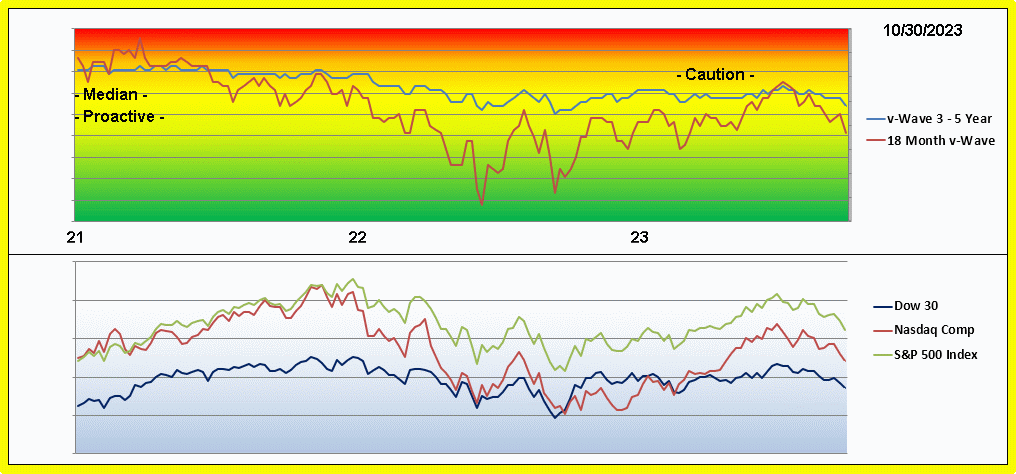
For diversified portfolios the Median value for the v-Wave is 29.5%. High Risk is 34% cash or higher for individual company stocks. Low Risk is 24% cash or lower.
To get a more proper cash level for individual company stocks multiply the current "Diversified" value by 1.5. This gives us 51% as the high risk threshold and 36% for the low risk boundary.
Looking at the cumulative risk of the v-Wave gives another perspective:
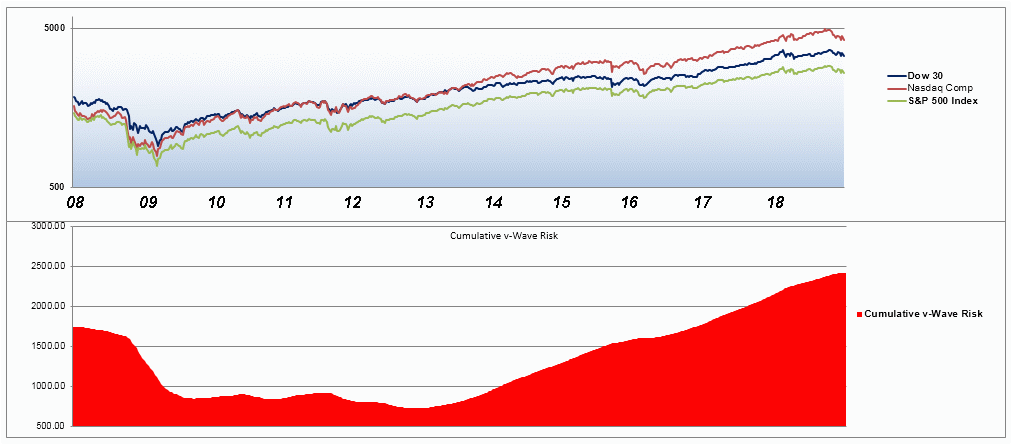
Cumulative v-Wave is calculated by taking each week's v-Wave Stock value, subtracting the median value from it and adding it to the previous total.
Significant historical events are shown nicely here and the v-Wave's response at those times.
v-Wave Calculations can be found at #30219. The data are a work-in-progress for now.
TooFuzzy provided us with a handy "Quick AIM Calculator" Here's a link to that page:
A.I.M. Users Bulletin Board (AIMUSERS): Thanks LC, Now they can use the "calculator" again! (advfn.com)
(follow the link on the above page)
AIM has a predictable pattern of "cash burn" in a declining market. Depending upon the SAFE settings AIM will generate new buy orders sequentially as share prices decline. It can be helpful to know in advance about how deeply AIM is going to draw down one's cash reserves. This link is to the "Cash Burn" AIM page. It shows various end points based upon the starting cash reserve level. Here's a link to that page:
"" rel="nofollow noopener noreferrer ugc" target="_blank">http://www.aim-users.com/cashburn.htm"; rel="nofollow noopener noreferrer ugc">A.I.M. Cash Burn Rate (archive.org)
Best wishes,
Old AIM Guy
|
Posts Today
|
4
|
|
Posts (Total)
|
47282
|
|
Posters
|
|
|
Moderator
|
|
|
Assistants
|
| Volume | |
| Day Range: | |
| Bid Price | |
| Ask Price | |
| Last Trade Time: |


