 News
News  Market Data
  Discover
Support: 888-992-3836
Copyright © 2023 InvestorsHub Inc.


Register for free to join our community of investors and share your ideas. You will also get access to streaming quotes, interactive charts, trades, portfolio, live options flow and more tools.
Happy Halloween~

hey orca
wazzupp bro
Hi Di4,
I think it's a worth reading post imo.
Posted by: vortmaximum Date: Friday, October 31, 2008 10:11:28 AM
In reply to: None Post # of 13157
RMDM will run imo. For a few posters to spend that much time hammerring on a stock with no bid and a pps at trip 1 is ludicrous IMO........
http://investorshub.advfn.com/boards/read_msg.aspx?message_id=33248185
hey MrBizzzzzzzzzzzzz
The Fool Ratio Explained
* The Fool Ratio
o The P/E Ratio
o The Growth Rate Examined
o Calculating the Growth Rate
o The Fool Ratio Explained
The Fool Ratio brings together what we've already learned into a new, simple, and terribly meaningful configuration. It numerically expresses the relationship between a stock's current price-to-earnings multiple and the rate of the company's growth.
Let's take the show to Maui, home of the waves, the babes, and get-rich-on-real-estate infomercials.
Maui Joe's Luau Supplies (NASDAQ: HULA) is a tiny niche company with a highflying stock that over the past 6 months has tripled to its current level of $9 per share. Having called the company and obtained the only up-to-date report by any analyst (which took a fingernail-extracting three weeks to arrive in the mail), you first learn that Maui Joe's EPS over the past 12 months has been $0.50. Which makes the P/E ratio 18. You furthermore discover that the analyst projects Maui Joe's to have earned 75 cents per share a year from now. And $1.15 the year after.
Well, we already have the P/E. We need the growth rate. "Calculator on," you vocalize, powering up your trusty sidekick. Lightning fast, you repeat the steps you learned above, coming up with 52% (rounded) for your 2-year annualized growth rate.
"What's the Fool on the stock?" your neighbor across the street has asked you, fondly referring familiarly to our Ratio.
Shouldn't be too difficult to figure out. You have the P/E. You have the growth rate. Now just find the ratio of the P/E to the percentage rate of growth. (18 divided by 52 equals 0.35.) So 0.35 is the Fool on this stock. Trading therefore at just 35% of its full, fair, Foolish value, Maui Joe's might make you some money, as you'll see below.
Like most numbers, the Fool Ratio needs a context before it can take on meaning. That's what we're here for. Here's the context in tabular form:
With the
Fool Ratio Tend To
.50 or less Buy
.50 to .65 Look to buy
.65 to 1.00 Watch (or "hold")
1.00 to 1.30 Look to sell
1.30 to 1.70 Consider shorting
Over 1.70 Short
In plain English, these numbers say, "Tend to buy stocks when their P/E's are half their growth rates; tend to sell stocks when their P/E's equal their growth rates; tend to sell short stocks (cf. "Shorting Stocks," the Eleventh Step to Investing Foolishly in the Fool's School) when their P/E's exceed their growth rates by 30% or more." (We actually prefer to find our shorts among stocks with Fool Ratios of 1.70 or more. That makes us feel REALLY good about the investment.)
The Fool Ratio is our favorite tool, and not just because we came up with it. We think it's darned useful, giving many investors a much-needed guide to the best prices to buy and sell stocks in which they're interested. The Ratio often imposes a trading discipline that is sorely lacking in many of us (the authors included). It can be terribly hard to ignore buying a favorite stock of yours whose Fool Ratio is 0.60. It can be terribly uplifting (and profitable) when, a week later, a short-term decline in this stock brings its Fool below 0.50. Pouncing, you snap up the stock more than 15% below what you would have paid for it, increasing your profit potential that much more.
Of course, the Phillips head screwdriver is another favorite tool of ours, but we don't try to screw lightbulbs in with it. Every tool has its limits. You should regard The Fool Ratio levels included in the table above as a guide only. A useful guide, we believe, but still just a guide. We don't want some guy from Philly to calculate (or possibly miscalculate) a Fool Ratio of 0.47 on a stock he follows, buy it at $12, watch it go to $2, and tell us our approach stinks. Manifold reasons exist for stocks to drop from $12 to $2. Maybe earnings estimates were downgraded, or the company reported a surprise loss, or the market crashed, or whatever. There's a lot more to security analysis than merely calculating Fool Ratios -- learning how to obtain and understand financial statements is also essential. The Ninth Step to Investing Foolishly and How to Value Stocks sections do a good job of this.
Also, please note that the Fool Ratio should not be applied to every situation. We ignore the Fool Ratio (and generally these stocks as well) for the following industries: airlines, banks, brokerage houses, leasing companies, mortgage companies, oil drillers, and real-estate companies. (The list may not be complete, since new industries spring up from time to time, but it's our best shot.)
These industries, for their different reasons, have low P/E's that virtually never reach their growth rates, mainly because their companies are valued off assets they hold (like oil deposits and real estate) rather than operating earnings. The Fool Ratio also has nothing to say about companies with negative earnings, since no P/E exists and determining growth rates (if any) often involves too much guesswork. And finally, the larger the company, the less we rely on the Fool Ratio to guide us. That's because, again, the bigger a company is, the less likely it is to be valued purely off of earnings.
In closing, the greatest beauty of the Fool Ratio is its ability to confer to the average investor a sense of at what price a given stock is a good buy and at what price a good sell. We view this as profoundly important, since the Ratio can ultimately help guide its fans into both long and short positions, seeking to profit up and down at the same time with different stocks.
Now THAT, as those who know our Fool Portfolio will acknowledge, is Foolish.
DCF analysis calculator
http://www.creativeacademics.com/finance/dcf.html
simplegreen is one of Ihub's best - that's for sure
Excellent post! I love it!
Here is more from that Ibox... I marked the board and will enjoy hanging out there to learn more.
Thanks a lot:)
>>>>>>>>
Part 2
Now I will talk about the greed factor a little more.When I determine an entry point for any stock that I intend to buy then next I must ask myself how large a position will I take.Lets say I want 50,000 shs of a stock trading at .08.Once I make that firm determination and feel it is a good entry point then I buy but only 25,000 shs which is 1/2 the shares I had decided on!Why do I do that?The reason is that if you think about it many of the problems that traders have is being too high on their entry whether thru getting caught up in a MOMO play near the high end or simply miscalculating the Market Makers intent and the MMs set the bid/ask not the traders...IOW traders may want to move it up and MMs want to open a spread and walk it down to serve their needs and you bought too high tho it seemed a good call.If you follow my method you can turn loss into profit due to the fact that you have less leverage if it goes up but you have only 1/2 the leverage against you if it goes down instead plus you have the liquity to at least break even and pull out or more often you can pick up enough shares as it bottoms too have leverage to profit on a trade that could have been a loss.Bear in mind one other fact...fewer shares mean less leverage for profit or loss but also the way I operate is usually in much more conservative position sizes so that I can move into a stock and out of a stock with relative ease!Watch how MMs like Goldman Sachs (GSCO)work...studying GSCO methods on Level II several years ago caused me to develop this style of trading that allows me to be somewhat invisible in the market but compound my profits easily without the dangers that come from trying to make a killing.If all were trading like this then it would seriously reduce the selling pressure on a perfectly good play.Huge positions tend to be counterproductive to my efforts if I am still in and momentum is gone.Trying to make a killing many times result in loss.I try to simply make a good trade that is profitable and money compounds quite easily._
Below is a sample of my current equity chart indicators and will answer any questions on the indicator set including how I build them and why I use these particular parameters..also this chart shows the EMA(6) and EMA(13) tandem cross above EMA(62) which can yield some very nice continuation moves
From Simplegreen's IBox:
http://investorshub.advfn.com/boards/board.aspx?board_id=5392
Simplegreen's Trading Methods
Assume that your account is very small and you have ..let's say $2500 cash
Ok..you have no stock and $2500 cash so with this limitation 2 things are a MUST..EVERY BULLET MUST COUNT and PATIENCE is cultivated in your brain.
At this point I will say that this is the way I treat my account even now...as if I only had that $2500 !!Burn this into your thinking and you will reduce your bad trades and losses dramatically.
It is very rare that I take a loss of any significance and the percentage of bad trades I make is very low.Even Warren Buffet once said about 1 out of 8 calls turn out to be good calls and I certainly do a lot better than that but it is only because I have myself brainwashed into being "hungry" on every trade.
The greed factor is also cured by this type of thinking...If you are "hungry" you will take profits at a good profit point and not look back..you are just happy to add to that $2500 portfolio value that you started that trade with!
This type of thinking IS IMPERATIVE to me and I WILL NEVER.. NOT be hungry in my trading again.
When I first started years ago with $4000 I did quite well til I got up to around $11,000 I would start to backpeddle.After a few cycles of this I realized I was the problem because I was no longer "hungry" and would start getting sloppy,greedy and would make mistakes.
I DO NOT, on the other hand trade to make money ,I trade to TRADE WELL! If I have made a good well planned trade in both the buying and the selling then the money is a byproduct of that trade.Read this area repeatedly and practice it religiously and it will serve you well...it has me.
Posted by: Stock Lobster Date: Sunday, March 25, 2007 9:47:27 AM
In reply to: sublime who wrote msg# 41829 Post # of 295169
L2 Warning Shots: Speaking of being pummeled, thought I'd repost a few classic pics of what danger looks like. The CLYP, SEAB, SSGI, STGI, HDSN, HILL, LAMP, MICA 'Family Tree', as you said..lol. Here they are, caught in the act, on a few recent stocks. When this picture shows up, you could have anywhere between 15 minutes to several hours to exit. This setup generally occurs after a decent run. Remeber, guys, it's always a good idea to take out your main investment, and ride freebies. Bulls make money, pigs get slaughtered.
(fyi, I'm not eliminating these plays from my watch list, these are just recent examples of a particular 'moment in time'. Nearly ALL penny stocks have dilution and waves of company selling. That's a fact. The selling may be over on these stocks, and the plays could well be safe again for running, but these are merely examples of what trouble generally looks like before a correction! There have been a few stocks recently, like HYRF at .0085, which had a similar setup, but rocketed right through to .015 without blinking. However, the odds seem to be about 15-1 against that happening when you see this kind of bid picture fwiw. For confirmation, look and see if one of the same MMs is on the ask. If so, one of those positions is fake, and it's the bid. Remember, hedge funds are almost never in the business of buying pinksheets or penny stocks. But they are very much in the business of selling them):
SCLL:
http://www.investorshub.com/boards/read_msg.asp?Message_id=17553087
GBDX:
http://www.investorshub.com/boards/read_msg.asp?message_id=17442288
AAGH:
http://www.investorshub.com/boards/read_msg.asp?Message_id=16949052
http://www.investorshub.com/boards/read_msg.asp?Message_id=16920479
OMOG:
http://www.investorshub.com/boards/read_msg.asp?Message_id=16949072
http://www.investorshub.com/boards/replies.asp?msg=16920537
MDSP
http://www.investorshub.com/boards/read_msg.asp?Message_id=16949793
XTMS
http://www.investorshub.com/boards/read_msg.asp?Message_id=16849844
GHTI:
http://www.investorshub.com/boards/read_msg.asp?Message_id=16949799
http://www.investorshub.com/boards/read_msg.asp?Message_id=16949808
And of course, what it looks like when the friendly bid support turns against you:
http://www.investorshub.com/boards/read_msg.asp?Message_id=17206163
Posted by: MrBigz Date: Sunday, August 10, 2008 5:24:16 PM
In reply to: MrBigz who wrote msg# 32563 Post # of 32564
Stock Analyzer's Video Chart Tutorials
http://investorshub.advfn.com/boards/satutorials.asp
Sometimes you will see posts that are obviously brought over from a ticker specific board. I just wanted to post here, that though they may be about a specific stock... within those posts is general information or special situations that I would like to access and refer back in the future if needed.
Thanks BUD F0X! I appreciate all the valuable information I can get... I value your contribution too and look forward to your additions :)
Posted by: ClayTrader Date: Saturday, August 09, 2008 4:48:25 PM
In reply to: None Post # of 25281
.<font color=red> ** FREE Video Lessons **
Charting: The Counter Attack -- http://investorshub.advfn.com/boards/playvideo.aspx?v_id=56
Message Boards (Part 1) -- http://investorshub.advfn.com/boards/playvideo.aspx?v_id=65
Message Boards (Part 2) -- http://investorshub.advfn.com/boards/playvideo.aspx?v_id=68
Message Boards (Part 3) -- http://investorshub.advfn.com/boards/playvideo.aspx?v_id=71
The Percent "is" What Matters -- http://investorshub.advfn.com/boards/playvideo.aspx?v_id=49
Using Charts To Distinguish PR's -- http://investorshub.advfn.com/boards/playvideo.aspx?v_id=43
FRE: "Live Trade" -- http://investorshub.advfn.com/boards/playvideo.aspx?v_id=78
GRMN: "Live Trade" -- http://investorshub.advfn.com/boards/playvideo.aspx?v_id=79
GM: "Live Trade" -- http://investorshub.advfn.com/boards/playvideo.aspx?v_id=98
ABK: "Live Trade" -- http://investorshub.advfn.com/boards/playvideo.aspx?v_id=99
If you enjoyed these videos, then I'm very confident you will find my Robotic Trading video CD extremely helpful! Interested? Check it out --> http://investorshub.advfn.com/boards/rtdetail.aspx
Read what others have to say about "Robotic Trading" --> http://investorshub.advfn.com/boards/read_msg.aspx?message_id=31280110
<font color=red> **Free Trading Videos** (InformedTrades.com)
http://www.informedtrades.com/trades.php?page=school
Charts are Coooool

Great board here di4, I've got it marked!!!
 Posted by: iknowaguy Date: Sunday, August 10, 2008 10:38:44 AM
In reply to: None Post # of 3814
ho humm
mm's are sissy's
"Some ways MM's entice sellers:
1. Run the stock up with a "tight spread" in a fast market, then "open" up the spread to slow down the buying interest. After it has "cooled off" for a little while lower the offer below the last trade right after a small piece trades on the offer then tighten the spread so that the sellers feel they can take a "quick profit" by "hitting the bid" on the tight spread. Once the selling starts the MM's will walk it down quickly by only making small prints on the way down with the tight spread.
2. Another way is by running the stock up in the morning, averaging up their short then use the above technique to walk it down in the afternoon. Hopefully, after doing this for several days, it will demoralize the buyers. The volume will dry up and the sellers will materialize thinking that the game is over. Contrary to popular opinion, MM usually Do Not Cover in Fast moving markets either Up or Down if they are short. They Short More. They usually try to cover after the frenzy is out of the market. There are many other techniques they use but the above are the most popular.
These techniques work about 9 times out of 10 particularly in a BB market. However, that is because 9 out of 10 BB stocks are BS. Remember what I said above. Most MM's don't have a clue as to the value of a Company until they get trapped."

will do, there are some greats here, very cool di4~
Hey there :) You know how when you click 'keep' on posts, you can only scroll through the last 10... well, I save lots and lots and rather then have them get buried so I can't access them, I paste them here every now and then. Please feel free to use this board as your dumping ground too ;)
Thanks :) Feel free to add to it with any good posts you may come across on the great big world of ihub!
I marked it also..
Nice board, marked it !!!!
Posted by: Stock Lobster Date: Sunday, December 31, 2006 2:23:10 PM
In reply to: plastipunk who wrote msg# 505 Post # of 1333
fyi: EXPLORE LEVEL II
Thanks to RGhonaim's for his first rate tutorial, on HSM. (whoa..his rank is "Stock God". Sensei!)
http://www.hotstockmarket.com/forums/showthread.php?t=14938
______________________________________________________________
The In-Depth picture of the supply and demand for a particular stock
What's Level II all about?
Let's answer this with an example: Level II is exactly like watching what happens behind the scenes of a movie. In this case, all the group involved into the creation of the movie are the Market Makers (MMs). The people buying the tickets for the movie are us, the stock traders.
What to look for on Level II? When watching a movie behind the scenes, you listen to the producer and the star to see what they have to say about it. On Level II, we are looking for the "producer" and the "star" of the action going on, in this case, the key MMs.
I) IMPORTANT LINKS
1. Each MM has his own name abbreviation composed of 4 letters, these can be found in the link below, sorted from A to Z: http://tinyurl.com/2drf7
2. After the end of the month, a monthly share volume report for every stock comes out indicating the number of shares bought and sold by the MMs playing the stock. Hence, these reports are one month delayed.
a) Report for OTCBB listed stocks: http://tinyurl.com/4btzc
b) Report for NASDAQ listed stocks: http://tinyurl.com/6vkxh
II) IMPORTANT L2 TERMS
MM (Marker Maker) : The Market Maker buys and sells the stock to brokerage firms.
Ax : The ax is the MM that is in control on the supply/demand of a security or a stock. I also like to call that particular MM "the leader".
CD (Convertible Debenture) : A Convertible Debenture can be converted into trading stock at the option of the holder and/or the issuer at a specified date in the future.
ECN (Electronic Communication Network) : It is an electronic system that brings buyers and sellers together for the electronic execution of trades. It disseminates information to interested parties about the orders entered into the network and allows these orders to be executed.
2 Important filling terms meaning dilution on a stock :
1. S-8 : These are shares paid out by the company for services.
2. SB-2 : These are optionally sold shares by the company to the public via small business issuers.
III) The Axes
These are the key players you look for on Level II. It is basically the main MM that always seems to be supporting the bid driving it up, or hitting the ask and driving the PPS down. It is the party who seems to be controlling the action in the stock. The ax isn't always trading the stock in one direction or another. Sometime he is keeping it in a tight range and sometimes he is not there at all and another ax may step forward. Note that there are times where there is no ax present. The point is the ax is the one to watch closer than all other parties or MMs. When you learn to trade with the ax your odds greatly increase.
NOTE : The Axes are usually the ones responsible for S-8 share selling, they will be consistent on the ask until the S-8 is completed. Once that particular MM starts supporting bid, it means that the S-8 is getting close to completion. In the case of viable companies, this is usually followed by a SHARP RISE in the PPS, known as an s-8 bounce.
So how do we find the ax ?
The best way to find the ax is through familiarity of the stock. By taking the time to watch the stock trade via Level II the ax will usually become quite apparent. But since we want info now and not wait days to find out, there's a shortcut. It's no substitute for watching the action, but it can at least give you a lead on a few parties to watch closer than others or MMs: The Monthly Share Report.
The key on these share reports is to NARROW THE SELECTION; generally look at the top 5 spots on the report, don't count the ECNs since many other players can use them to buy or sell shares. Don't count retail ECNs like GVRC for this similar reason, and also since most of the traffic is retail. Get rid of unnecessary small MMs since it will not happen that a little guy is going to control a stock.
Note that the ax is not static. On any given day any party can be an ax, there may be one ax in the morning and another in the afternoon and neither of them could be listed in the top ten of the monthly share volume report.
If a big order comes onto the trading desk of a firm that doesn't do big volume in a certain name, the ax will take care of it and command the action.
An ax can easily use an ECN to hide much of their action. They can and will use fake outs. Keeping an eye on Level II will reveal the ax, use the monthly share volume report as a confirmation to your observation.
Example of finding the ax on WNMI : In February, the axes CHIG and UCAP weren't on the report. The run started late march, remember this report is a month delayed. You can get some more DD out of who is diluting by checking S-8's and SB2 fillings, then by looking at the chart before the stock broke out, notice who was soaking more shares than others.
IV) MM Behavior On Level II
Example of an ax who is selling:
When the market is rallying, the stock has a hard time moving higher, seemingly hitting a wall every time. And every time the wall seems to have the same initials and yet, when the strength subsides, the stock has no trouble falling. And funny enough, the ax seems to be following the stock down. That's where Level II comes into play. You have now found the missing link per se. You can see around the corner and start to see patterns. MM AX is on ask - it means he is driving price down - not good for us because we are buying and not shorting the stock (can't short OTCBB).
The ax seems to be following the stock down, he's killing the stock on the ask! If this behavior is recognized what would be the appropriate course of action? Going long the declines or selling the rallies?
Answer: selling the rallies. Since we can't on OTCBB and Upside is limited every time the stock tries to advance. Instead of trading against the ax and hoping that the buyers will overwhelm him, it is much smarter to sell with the ax and watch the stock fall as buyers pull away. Hence you would short it. The only kind of buying which should be going on is the covering of short positions as necessary. Work with the ax to your advantage.
Example of finding the dilutor on RWNT:
Input RWNT into monthly share report. Remember focus on top 5 spots. Don't count wholesalers. VERT is the dilutor. Explanation: Look at April. Then look at May. Nothing in April. Then he dumped 57mil shares in May. You can even go back to March and he wasn't even a listed MM. So he came on in April and then he started his selling. Keep in mind that RWNT is extreme and you're not always going to see that.
Example of MM supporting PPS stock northward:
Let's say that a stock (shell) has been lying quietly at $.25 bid $.50 offered. A limit order comes into one of the MMs to buy at $.50 for a thousand shares. Prior to this trade that MM may be "flat" (neither long nor short any shares). He fills the order and is now short 1,000 shares. He may raise his bid hoping to find a seller to "flatten" out his position. But before he realizes it a wave of buyers have come in and cleared out all the $.50 offers. Now the stock is $.50 bid .75 offered. Here comes that "Big" firm he just sold the 1,000 shares to at .50 with another bid for 1000 at .75. He makes this print. Now he is short 2,000 at an average of .625. The market keeps moving and now its .75 bid 1.00 offered. Now he has to make a decision. Just like investors, MM Hate to take a loss. So 9 times out of 10 he will now sell 2000 at 1.00 making him short 4000 but with an average .81. At this time he would love to see a seller at .75 so he can cover his short and make a few but instead the market keeps moving up. Now it is 1.00 to 1.25 and here comes the buyer again at 1.25. He doesn't want to lose the call so now he needs to sell 4,000 at 1.25 to keep his break even point above the bid. Now he is short 8,000. Market moves up to 1.25 bid 1.50 offer here comes the buyer now he feels he must sell 8000 here because "stocks don't go up forever". Now he is short 16,000. And so on and so on. If the stock keeps moving up, before he realizes it he could be short 50k or 100k shares (depending how big his bank is). Finally the market closes for the day and on paper he may look all right in that his "break even" price may be around the closing price. But now he has to figure out how to entice sellers so he can cover this short. It is important to note that if this happened to one MM it has probably happened to most all of them.
Some ways MM's entice sellers:
1. Run the stock up with a "tight spread" in a fast market, then "open" up the spread to slow down the buying interest. After it has "cooled off" for a little while lower the offer below the last trade right after a small piece trades on the offer then tighten the spread so that the sellers feel they can take a "quick profit" by "hitting the bid" on the tight spread. Once the selling starts the MM's will walk it down quickly by only making small prints on the way down with the tight spread.
2. Another way is by running the stock up in the morning, averaging up their short then use the above technique to walk it down in the afternoon. Hopefully, after doing this for several days, it will demoralize the buyers. The volume will dry up and the sellers will materialize thinking that the game is over. Contrary to popular opinion, MM usually Do Not Cover in Fast moving markets either Up or Down if they are short. They Short More. They usually try to cover after the frenzy is out of the market. There are many other techniques they use but the above are the most popular.
These techniques work about 9 times out of 10 particularly in a BB market. However, that is because 9 out of 10 BB stocks are BS. Remember what I said above. Most MM's don't have a clue as to the value of a Company until they get trapped.
V) S-8 Dilution
Look in the filings of a particular stock for S-8's. The filings aren't that bad of a dilution, some can even be employee stock options. The MM ax will remain on the ask until the S-8 share selling is completed. The price at which they sell isn't important since they are shares TO BE SOLD, the ax won't be looking to BARGAIN SELL THEM.
Once the ax seller steps off ask and starts supporting the bid, look for a run upwards. You will see a lot of market maker shifting as well as MM's need to get ready for stock to reverse into the opposite direction (upwards). You usually want to buy a little right before the S-8 is completed to benefit from such runs.
S-8 share selling doesn't always drive the price down as opposed to any other form of dilution.
Example of an S-8 dilution done smart : BMIC was diluting ONEV, but he did it right and it still ran hard with him selling the whole way up. Look up BMIC's monthly share report on ONEV (APRIL 04). *
VI) Key Level II Players:
TOP 5 MOST IMPORTANT (typically out of dilution) : NITE, ETRD, SCHB, TDCM & ARCA.
NITE & SCHB are wholesalers, TDCM a retailer, ETRD a retail ECN and ARCA an ECN.
NITE : This is the king MM of the OTC. He intimides traders and other MMs use that to their advantage knowing that he scares them. That's why NITE is the shaker on most stock runs; he is the most common ax. NITE could be on the ask all the time, he could be leading a dip scaring sellers to his buddies SCHB and TDCM on the bid.
TDCM : Retailer MM, you love him on the bid.
Biggest OTCBB ECNs : GNET, TRAC & DATA - you love them on bids also.
Other ECNs : ARCA, BRUT, BTRD, INCA, INTL, ISLD, REDI
Big Shorters : JIMK, POND, GNET or ARCA (anyone can use GNET, even other MMs because it's an ECN).
Wholesalers : ETRD, HRZG, MASH, NITE, SHWB
Top Retail Dilutors : ACAP, AGIS, BAMM, BMIC, CHIG, CLYP, FANC, FRAN, JIMK, MAYF, NATL, PERT, SACM, UCAP, VERT, VFIN
_______________________________________________
That's it for Level II, always keep learning!
Sincerely,
RG
a big thank you goes to ATS for all the help on this
*** Also read JP's explanation on L2 http://tinyurl.com/4wap3 ***
Posted by: Stock Lobster Date: Sunday, December 31, 2006 2:25:09 PM
In reply to: plastipunk who wrote msg# 505 Post # of 1333
fyi: How to Read a Detailed Stock Quote Table
http://daytrading.about.com/od/educationtraining/a/quote.htm
A detailed stock quote table provides one with much more information than just the current market price of the stock. Being able to understand a stock quote table is essential when investing in the market. You may obtain detailed stock quotes from any of the major financial sites such as Yahoo Finance or CBS Marketwatch. Here is an example of a detailed stock quote table for Microsoft from Yahoo Finance.
The following explains the major components of a typical detailed stock quote table.
Ticker Symbol: This is the unique 3 or 4 letter name which identifies the stock for purposes of trading on a particular exchange. For example, the ticker symbol for Microsoft is MSFT. If you wish to obtain a stock quote online, you search for a company by its ticker symbol. If you don't know what a particular company's ticker symbol is, you can search for it by company name at most major financial sites such as Yahoo Finance.
Last Trade: The most recent price at which the security was traded. All quotes are updated continuously throughout the day as further trades are made.
Trade Time: The time of the most recent trade of a particular stock.
Change: The difference between the previous day's closing price and the most recent price of the stock.
Prev Close: The last trading price for the stock recorded when the market closed on the previous day.
Open: The price of the stock's first trade of the day. This is the price of the stock as of the market open. Trading opens at 9:30 a.m. Eastern Time.
Close: The close is the last trading price recorded when the market closed on the day.
Bid: The price at which a market maker or stock exchange trader is prepared to buy a particular security from an investor.
Ask: The price at which a market maker or stock exchange trader offers to sell a given security to an investor.
Day's Range: This refers to the price range at which the stock has traded at throughout the day. It represents the maximum and the minimum prices that investors have paid for the stock during a particular market day.
52wk Range: This refers to the price range at which the stock has traded at during the past 52 weeks. It represents the maximum and the minimum prices that investors have paid for the stock during the preceding one year period.
Volume: How many shares of a particular company traded that day.
Change: The difference between the previous day's closing price and the most recent price of the stock.
Market Cap: The value of a company as determined by multiplying the total amount of its outstanding shares by the current market price per share.
P/E: This is the company's Price/Earnings Ratio, calculated by dividing the current stock price by earnings per share from the last four quarters.
Dividend Per Share: This indicates the annual dividend payment per share for a company that currently pays out dividends.
_______________________________________________________
If you take anything I say as advice, you're crazier than I am.
Posted by: Montanore Date: Saturday, March 17, 2007 3:39:52 PM
In reply to: None Post # of 2757
More about dilution:
Dilution:
The selling of newly issued shares. The basis in which the entire stock market revolves around is the issuance of shares to acquire the capital to sustain and allow a company to grow. This is 100% legal, even when done with 'less than good' intentions and done thru mis-representation. The less 'blue chip' a company is, the more likely the dilution will not bear fruit.
Dilution is inevitable in all companies, given it's nature and value to a company. A 'good' company dilutes minimally, and gives shareholders 'value for their money', ie; increasing/improving bottom line fundamentals.
It is HIGHLY advised to locate the Transfer Agent (TA) of any company you wish to be invested in for more than 1 week. By frequently calling the TA, you can gain a neccessary understanding to what extent the company is diluting. TAs can give you the outstanding shares (o/s) for any date you ask. By knowing the o/s on the first of the last 3 months, gives a good idea of dilution rate.
Stay far away from an issue that the TA has been gagged, atleast until you have become VERY experienced in investing/trading. There is virtually NO good reason for a TA to be gagged. None.
Posted by: Stock Lobster Date: Sunday, March 18, 2007 6:24:03 PM
In reply to: Stock Lobster who wrote msg# 37325 Post # of 295165
IBD: Sell On Technical, Not Fundamental, Cues
BY ALAN R. ELLIOTT
INVESTOR'S BUSINESS DAILY
Posted 3/15/2007
Finding the next big winning stock requires a smooth blend of fundamental and technical analysis.
A smart investor will look for superior sales and earnings growth and hefty profit margins as proof that a stock owns the fundamental strength to beat its rivals.
On the technical side, spotting a stock forming a sound base is a must. Grab it during a market uptrend, just as it's breaking out in heavy volume, and you could be on your way to big gains.
But when it comes time to sell, fundamentals rarely play a significant role. In fact, leading stocks will routinely see their price plummet weeks or even months before sales or earnings show their first sign of weakness.
So don't get seduced by a stock with impressive ratings. The view always looks best from the top.
Instead, scrutinize the daily price and volume action. If sell signals such as stalling, high-volume decline or a sharp decline through a key support level start cropping up, it may be time to cut bait.
By April 2006, Connecticut-based railroad stock Genesee & Wyoming (GWR) had mounted a three-year, nearly 500% gain.
In fundamental terms, the firm was still going great guns. Earnings had grown 40% to 52% in the prior three quarters. Sales gains were holding steady between 29% and 36%. The company made the IBD 100 on April 21 with top-shelf ratings.
But G&W's chart showed the stock was in the late stages of its advance, flashing warning signs.
The stock marked new highs on light volume in March 1. During the week ended April 21, shares ran up another 11% in weak trade 2. G&W staged a sharp reversal the following week, shedding 10% 3.

In hindsight, we know the market was headed for a May correction.
Many other stocks were showing clear signs of fatigue, despite still-solid fundamental data. Some of those stocks quickly recovered when the Nasdaq found its footing in July.
Rail carriers other than G&W also righted themselves. Many of those stocks consolidated in fresh price patterns, then bounced back when the market turned higher for another run beginning in July 2006.
But G&W, as the old railroad saying goes, did not make the grade. After a weak rebound try in late '06, it kept struggling. The stock is now 31% off its May '06 all-time summit.
Posted by: Stock Lobster Date: Wednesday, March 28, 2007 4:38:44 PM
In reply to: jlew732 who wrote msg# 44025 Post # of 295165
Level 2s (l2s): Well first, take a look at these L2 posts. They were decent articles on how to read l2s, imo.
http://www.investorshub.com/boards/read_msg.asp?Message_id=15898672
http://www.investorshub.com/boards/read_msg.asp?Message_id=15898720
http://www.investorshub.com/boards/read_msg.asp?Message_id=15898734
Then go over the basics in a few of the IBD posts. Of course, Investors Business Daily focuses on large cap stocks, but some of the advice on fundamentals is relevant across the board, imho:
http://www.investorshub.com/boards/read_msg.asp?Message_id=17987862
Do a keyword search for 'IBD' on this board, and you'll find them all.
Posted by: Bill Panetta Date: Tuesday, January 08, 2008 9:53:33 PM
In reply to: None Post # of 14684
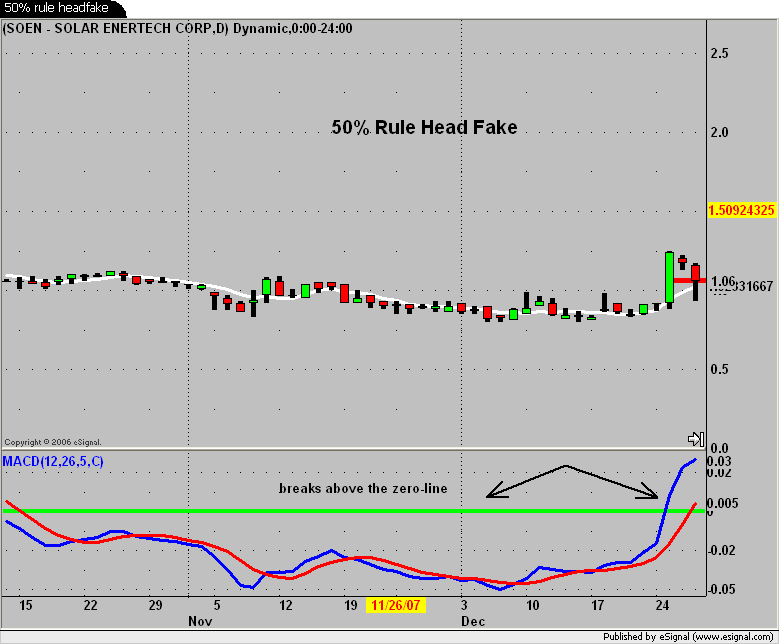
50% RULE HEAD-FAKE (new article) 01-08-2008
Let me walk you through one of my latest trades using the stock SOEN.
In this 3 part example we are going analyze and make it clear, you have to use closing prices and not intra-day action.
There seems to be confusion among traders, do i use closing price or intra-day. I am gonna show you where its better to go with the closing price to stay in a trade.
Lets look at the first chart:
I took the trade on the big green candle day on the chart 12-26-2007. I love big green candles because you use them as your guide. My average was .98 the first day.
The next day was OK, it was a small inside day, there was no violation of the 50% rule, it was holding up really nice. Then the next day all hell broke loose. I will go into money management at the end of this article to explain what i did on the first day.
3rd day : (12-28-2007) We had a hard pullback and we violated the 50% rule on a intra-day basis (key word intra-day basis) we also violated the 5 day moving average which is a very critical moving average for momentum. Now as a trader or investor there are decisions to make because basically all of you gains were taking away temporarily ( money management later).
At this point your upset, discouraged, your saying i suck as a trader, but wait a minute, my secret weapon is still there to guide me through this volatility. What am i talking about thats right the MACD, the trend indicator the measure of strength in the trend.
If you look at the chart you will see that the MACD breaks above the green line which we call the zero-line (the MOMO line). The green line represents real power, a strong trend.
As you can see, we made that hard pull back on 12-28-2007 the MACD my life saver was clearly above the zero-line (green line) on the chart. This is why we use the closing prices not inta-day action. We hit a bottom that day and we came all the way back and closed right at the 50% rule of the big green candle, But in conjunction with this reversal we got back to the 5 day moving average. HUGE reversal the followed.
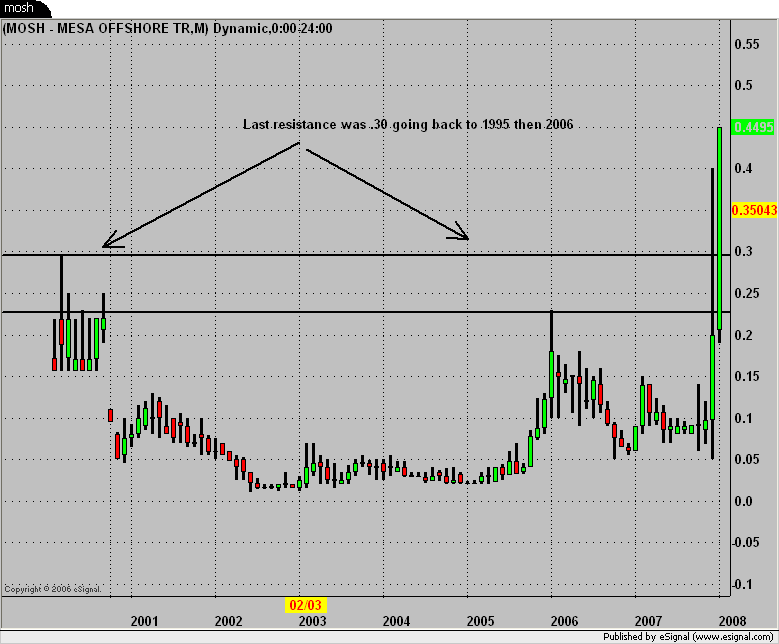
Lets go to the 2nd chart and see what accrued in the days ahead.
As you can see after the reversal day the stock explodes 3 days in a row for higher prices and turns into a great trade. 3 days in a row the 50% rule keeps you in for max profits. very clear on the chart what happened.
Lets go to the 3rd chart and wrap this study up
The 4th day SOEN gaps below the 50% rule of the previous day and its time to lock in profits. You can clearly see the close is below the red-line, it had been a great trade its time to take profit.
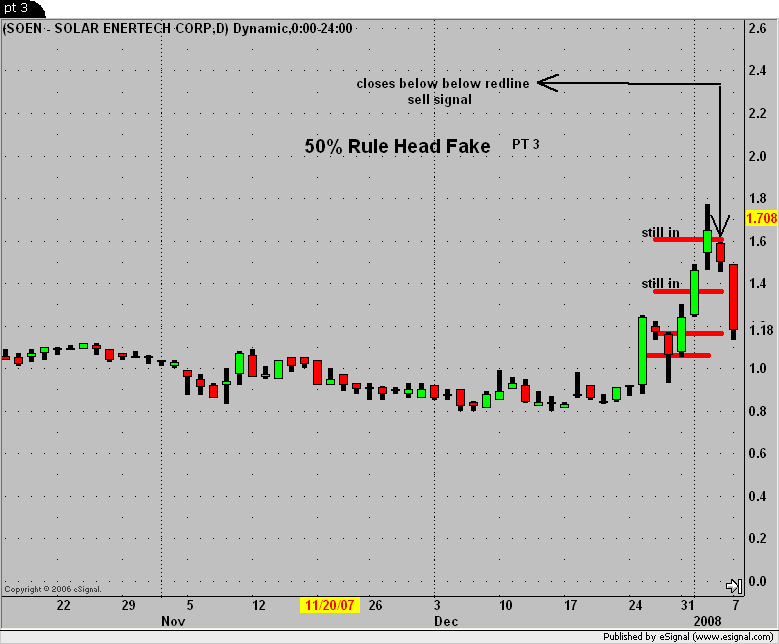
We used 3 key indicators in this article to teach you how to read into momentum in a stock. 50% rule, 5 day moving average and a basic indicator the MACD. Master these 3 and you will do fine trading Mico-Cap and Small-Cap Stocks.
Last thing, Money Management: When I trade stocks like SOEN my entry was a .98 average the close that day was 1.24ish. At the end of the day i sold a portion of my position.Why? because of what can happen in these stocks. If the stock goes up i am good if the stock comes down and gets real volatile I had some profits locked in. You hear traders say sell 1/2 when you double your money, I say sell a portion when you have good profit that way you take out the emotions out of trading. also if it comes back down to your original entry point , you didn't blow the trade completely.
There's a lot more to trading and investing but this will give you a great start for momentum trading.
Anyway, lets have a great 2008.
Continued success to everyone.
Bill

Posted by: zardiw Date: Thursday, February 07, 2008 10:17:51 AM
In reply to: BigAl61877 who wrote msg# 17660 Post # of 22446
UNGAGGED TA's (19 of them):
UNGAGGED TRANSFER AGENTS LIST
American Stock Transfer & Trust Company, (800) 937-5449, (718) 921-8124
Atlas Stock transfer 801-266-7151
Corporate Stock Transfer (303) 282-4800
PacWest Transfer-Laurel- 540-675-3129
CompushareTrust-303-262-0889
Guardian Registrar & Transfer 954-915-0105
Florida Atlantic Stock Transfer,Inc 954-726-4954
Executive Registrar- Mary 303-783-9055 fax re 303-783-0852
Integrity Stock Transfer-702-317-7757
Interwest Transfer Co., Inc (801)272-9294 Fax:(801)277-3147
Fidelity Transfer Comp-jocelyn@fidelitytransfer.com
Manhattan Transfer Registrar Co. (631) 928-7655 http://www.streettransfer.com/
Monmouth Olde Transfer 732-872-2727.
PACIFIC STOCK TRANSFER 702-361-3033
Signature Stock Transfer-signaturestocktransfer@msn.com
Securities Transfer Corp.-(469) 633-0101
Stalt-650.321.7111
Standard Registrar & Transfer Co.801-571-8844-Marlene
Interwest Transfer Co., Inc (Contact Info coming)
Posted by: Silver Fury Date: Sunday, March 09, 2008 9:35:14 AM
In reply to: Silver Fury who wrote msg# 941 Post # of 15559
Transfer Agent
First American Stock Transfer,
706 East Bell Road
Suite 202
Phoenix, AZ 85022-6642
Posted by: Investorman Date: Friday, March 28, 2008 5:33:39 PM
In reply to: None Post # of 86240
How many of the following tongue in cheek definitions apply in HRCTland?
Pinkie dictionary
AF's - Audited Financials; documents so rare, so precious, that mere mention of their future appearance can cause spectacular price appreciation (See also: Next Week).
Available Funds - a number inversely proportional to the investment merits of the stock you are considering for purchase.
Average Down - what to do when your stock has dropped far below your Mental Stop.
Basher - the ultimate compliment; a person of considerable wealth, wit and skepticism. Will never critique a bad stock, only good ones. (See also: Paid Basher)
Big News - the cause of much anticipation among Stuckholders; if and when released, causes massive Naked Shorting, which is the only way the Market Makers can prevent the price from rising (to the Moon).
Boca Raton - an island of integrity and sound financial advice in the Florida swamps.
Boiler Room - an old documentary about the lost art of reeling in a Sucker by telephone.
Cellar Boxing - a game played by Market Makers when they get bored with pulling the wings off flies.
Cert - an official-looking document that proves you lost money.
Cert Pull - a reliable way to insure that Stuckholders remain so.
Credit Card - an excellent source of funds for non-marginable Emerging Growth Stocks
DD - the process by which you convince yourself to buy a bad stock (courtesy of "serfdom").
Economic Darwinism - the process by which Pink Sheet Stuckholders are relieved of their money and removed from the financial ecosystem, thus insuring that they will never become wealthy enough to cause real damage.
Emerging Growth Company - an implausible story about a hypothetical business.
Emerging Growth Stock - a scam.
Ex-clearing - the red button on the trading terminals of all Hedge Funds that allows a trader to manipulate a single stock, or the entire market, yet avoid detection by any compliance, audit, regulatory or taxation authority.
God Bless (when used at the end of a letter to shareholders, subscribers, etc.) - proof that the author is sincere about wanting to take your money, reluctant to serve a prison sentence, or both.
Greenwich, CT - Hedge Fund capital of the world, home to many Naked Short Sellers; the only portal into Hades with regular train service from mid-town Manhattan.
Gullibler - see Sucker
Gut Feeling - (before you buy an Emerging Growth Stock): a hunch that this will finally be the multi-bagger you have been searching for; (after you buy an Emerging Growth Stock): the urge to vomit.
Hedge Fund - any group of two or more people with more money and brains than you.
Investor Relations - a liar who is unable to hold down a steady job.
JV - an arrangement between the promoters of two or more Emerging Growth Stocks, with the sole intention of inducing Suckers to buy, and shorts to cover; a meaningless document.
Janice Shell - part cyber-sleuth, part vampire, she clones rats in a secret underground lair and can destroy an Emerging Growth Stock by simply moving her fingers. Sued by the SEC, Amazon and Business Week, she fled her Texas trailer park and is now living in exile in the former Soviet republic of Italy.
Letter of Intent - a letter sent by one party to a second party, usually made public with the sole intention of inducing many third parties to purchase an Emerging Growth Stock. (See also: MOU, JV, Big News, Next Week)
Level II - an electronic stream of data that will enable you to lose more money, faster than ever before.
Locked and Loaded - "I have doubled down more than once on this pig, and if it doesn't go back up very soon, I am in deep, deep trouble…"
Long and Strong - "My irrational belief in this dishonest promotion will not be shaken by assertions of fact."
MM - Market Maker; the Ferrari-driving 24 year-old who emptied your account, one trade at a time.
MOASS - the Mother of All Short Squeezes; when predicted as imminent, a guarantee that your stock will drift lower for the rest of time.
MOU - a letter sent by one liar to another.
Margin - a quicker way to send your entire portfolio to Money Heaven.
Margin Call - the market's way of telling you to stop trading and buy no-load mutual funds.
Melchizidek - a business-friendly domicile for Emerging Growth Companies (see also: Utah)
Mental Stop - an arbitrary point below your purchase price, and always adjusted down to be below the current quote. (See also: Stop Loss)
Mine - a hole in the ground with a liar at the top (Mark Twain).
Mining Company - a group of liars.
Mining Company (Exploration Stage) - a group of liars who have not yet agreed what to lie about.
Mining Company Stock - expensive toilet paper.
Money Heaven: the final resting place for the capital of retail Spec-o-lators. (See also Greenwich, CT.)
Money TV - a platform for fraudulent stock promotion, hosted by paid shill and convicted goat-f*cker, Donald Baillargeon.
Moon - frequently-promised price-point for Emerging Growth Stocks; a mineral-rich celestial body, ripe for exploration by Mining Companies.
NSS (Naked Short Selling) - a helpful service provided by Market Makers to lower the price of your stock, so you can buy more at bargain levels (in time for the MOASS).
Next Week - the time frame for the release of the Big News. Always Next Week, never This Week.
NITE - Knight Trading, the largest Market Maker of Emerging Growth Stocks, and the party responsible for your lack of investment acumen and poor trading skills.
OS - Outstanding Shares, like the National Debt, a large and ever-increasing number, but with more immediate negative effect on Stuckholders' wealth.
Optomistic - this mis-spelling of the word optimistic reliably indicates the victim has not yet realized the extent of his losses, or the depths to which the company's management or IR person will go to deceive him.
Paid Basher - one already rich from not wasting their capital on Emerging Growth Stocks, and able to pull down many additional billions by criticizing YOUR stock.
Penny Stock - a business so unprofitable, so mis-managed, so dishonest, that no bank or VC would lend them a cent (see also: Emerging Growth Stock, Mining Company).
Penny Stockholm Syndrome - the love that dare not show a spouse the brokerage statement (see also: True Long).
Pink Sheets - an electronic stock exhange whose secret objective is the transfer of wealth from Suckers to Hedge Funds and executives of Emerging Growth Companies.
Positive DD - what the CEO/promoter/IR person tells you on the phone (but is unable to put in writing); frequently involves Big News, which may arrive as early as Next Week.
Press Release - (when issued by a Real Company) an announcement of material interest to the financial community, intended to goose the stock price; (when issued by an Emerging Growth Company) a collection of exaggerations, lies and errors of omission, intended to goose the stock price.
Reverse Split - the market's way of letting you know your stock is a loser.
SEC - huge, lavishly-funded regulatory agency, whose secret objective is the transfer of wealth from Suckers to Hedge Funds.
Short - the natural enemy of the Sucker;
Short, Naked - see NSS
Spec-o-late - to throw one's capital down the Stinky Pinky Toilet; to engage in wild financial fantasies that will never be realized.
Steve Cohen - (pronounced: Cth'ul'hu) Hedge Fund manager and notorious Short; very camera-shy, due to the fact that he has actual horns growing from his head.
Stinky Pinky - see Emerging Growth Stock
Stinky Pinky Toilet: the place your money goes. (See also: Money Heaven)
Stop Loss - an invitation to a Market Maker to take your money.
Stuckholder - holder of a position in a Stinky Pinky where the proceeds from selling would be less than the commission.
Sucker - anyone long a Penny Stock for longer than it takes to go to the bathroom.
Things that make you go HMMMMMM - prelude or finale to a message-board post consisting of well-researched links that clearly prove the price weakness in a particular Stinky Pinky is due to a vast conspiracy by a secret alliance of Hedge Funds, Market Makers, central banks, the supreme court, Raging Bull, Paid Bashers, the Vatican, the SEC and DTCC, the House of Saud, George Soros, the Smoking Man, etc.
Time Travel - a technology found only in the business plans of Emerging Growth Companies.
Trailing Stop - a trading technique designed to protect profits, seldom needed by investors in Emerging Growth Stocks.
True Long - the con man's best friend.
Utah - a business-friendly domicile for Emerging Growth Stocks.
Vancouver - a street in Canada where your broker worked before he moved to Boca Raton
Wall St - a really old movie with Michael Douglas that portrays the softer, more sentimental side of finance (see also: Boiler Room).
Zero Bid - the market's way of letting you know your stock is a loser.
Posted by: sandintheshorts Date: Wednesday, April 16, 2008 8:28:30 AM
In reply to: None Post # of 28
Anybody know about this? Found this on Yahoo message board..
first of all, congratulations to those of you who spotted harmel rayat's bull@#$%.
harmel rayat ran 5 bogus companies out of the same small office in vancouver, along with his stock pumping / promoting company known as "equity alert" - a company which he used illegally to promote / pump his own stocks. here is the link to the SEC website and page that proves harmel rayat was fined for this infraction. http://www.sec.gov/litigation/admin/33-8...
harmel rayat is the MAJORITY SHAREHOLDER in all of these companies.
rayat changed the addresses as a smoke screen because people have been catching onto his scamming ways. he used to run them all out of the same small office in vancouver.
http://finance.yahoo.com/q/ir?s=PYTO.OB
http://finance.yahoo.com/q/ir?s=HPLF.OB
http://finance.yahoo.com/q/ir?s=ETHT.OB
http://finance.yahoo.com/q/pr?s=IENI.OB
4 publicly traded companies in completely different sectors... one recurring name. Rayat must be a very busy and talented man. how can someone be the ceo of so many companies (in different geographical regions) at the same time?
go to the octillion message board (OCTL.OB) and read the mountain of information that i have provided about harmel rayat. OCTL.OB is another of harmel rayat's scam companies. http://messages.finance.yahoo.com/Stocks...
in fact, here are some of the threads that i have posted information about this bastard in...
http://messages.finance.yahoo.com/Stocks...
http://messages.finance.yahoo.com/Stocks...
http://messages.finance.yahoo.com/Stocks...
in this thread, i explained why harmel rayat stepped down as octillion ceo and why the companies addresses have changed...
http://messages.finance.yahoo.com/Stocks...
harmel rayat and his crew of stock pumpers are obviously on all of the message boards pertaining to all of the companies they own, posing as investors. they post positive comments and attitudes about the companies' stock, but never provide any proof. i, on the other hand, always provide proof that states the contrary, and i am sure that they are very annoyed with me.
here's a thread that someone started which pertains to david gelbaum, a millionaire that bought 6.7 percent of OCTL's shares. people mistakenly believe that because this guy bought shares, that makes this company legitimate. david gelbaum has skeletons in his closet too.
http://messages.finance.yahoo.com/Stocks...
go to this link and scroll down to the bottom of the page for an interesting article about rayat's failed companies and scams.
http://10qdetective.blogspot.com/2007_09...
go to this link and scroll down to the post by a guy called inspector bud, dated september 10th 2007, for an interesting article about rayat and octillion, and how he misleads people.
http://oneguysinvestments.com/gumshoe/co...
LOOK OUT FOR YOUR FELLOW INVESTORS AND SPREAD THE WORD! GO TO THE MESSAGE BOARDS OF ALL OF THE RAYAT COMPANIES AND COMPARE NOTES. YOU ARE NOT THE ONLY ONES GETTING SCAMMED!
Posted by: BUD F0X Date: Tuesday, April 22, 2008 2:45:37 PM
In reply to: None Post # of 6111
L2 Due Diligence and Education....
If you are looking to further your understanding of L2, please read on. I think the following posts offer a solid education of the basic "whats what" and how to read L2, properly. They also goes on at length about MMs to keep an eye on and how they setup to deceive traders. These posts come courtesy of StockLobster, arguably the best L2 trader on iHub.
http://investorshub.advfn.com/boards/read_msg.asp?message_id=18290658
http://investorshub.advfn.com/boards/read_msg.asp?message_id=23184480
http://investorshub.advfn.com/boards/read_msg.asp?message_id=18186225
Posted by: abbytraderwin Date: Friday, April 25, 2008 4:21:53 PM
In reply to: None Post # of 26850
JUST NOTICED THAT SCOTTRADE JUST PLACE THIS ON THE RESTRICTED LIST FOR ONLINE BUY ORDERS!!! I GUESS THAT MEANS MONDAY IS GOING TO BE A VERY GOOD DAY!! LOL.
HERE IS HOW TO OVERCOME IT. CALL YOUR ORDER IN NOW, MODIFY IT TO .0001 SO IT IS READY TO GO, USE IT WHEN READY. I HAVE A LIST OF 30 PLUS RESTRICTED STOCKS IN MY SYSTEM READY WHENEVER, ALWAYS. THIS WAS NOT RESTRICTED BEFORE. WHEN I LOAD SOMETHING I KNOW IS GOING THROUGH THE ROOF, I PALCE MULTIPLE ORDERS AS JUST DESCRIBED EVERYTIME. SO NOW WHEN IT BECOMES RESTRICTED, I KNOW I AM RIGHT AND I AM READY. PLACE PHONE ORDERS FOR 100.00 EACH 5 OR TEN TIMES AND ALWAYS RESET THEM BELOW THE BID, I USE .0001, THEN YOU ARE READY AND ANYONE HERE THAT HAS TRADED ANY OF THE STOCKS THAT HAVE GONE UP 100%-500% IN A DAY KNOW WHAT I MEAN. YOU NOTICE IT AND TRY TO BUY IT ONLINE AND FIND OUT THAT IT IS RESTRICTED. BY THE TIME YOU CALL IT IN THE STOCK IS UP ANOTHER 50%!!!
BTW THE ADX(1-45) ARE NOW REST FOR LIFTOFF!! IF YOU FOLLOW MY POSTS BACK ON ADCS YOU WILL SEE WHAT I MEAN.
CONFIRMED THE FAKE WALL, HIT THE ASK, AND YOU SEE HOW FAST IT MOVED. IT IS MOST LIKELY THAT SOME OF THE NEGATIVE POSTERS ON THIS BOARD WERE SETTING UP THE FAKE WALLS.
I WOULD EXPECT THAT NEWS IS COMING MONDAY OR SOMETIME NEXT WEEK BECAUSE SCOTTY KNOWS EVERYTHING AND THEY LIKE TO MAKE ALL THE MONEY. LOL. GREEDY TURDS!!
IF YOU DOUBT ME. TRY AN ONLINE ORDER FOR ANY OF THE RECENT OR TODAYS BIGGEST GAINERS AND SEE. HERE ARE A COUPLE FROM THIS WEEK THAT I ALSO GOT IMEN,WEHI,LFTC,WFYW,IGAI,HCNCT,NSLT,EFCR,SVMI.ATVE,MBTT,MIHS,LTII,CEOA,, etc....
Have a great weekend and enjoy next week.
Posted by: bud750 Date: Friday, April 25, 2008 7:44:53 PM
In reply to: None Post # of 26850
Ok here is some info on stuff.
TOP 5 MOST IMPORTANT (typically out of dilution) : NITE, ETRD, SCHB, TDCM & ARCA.
NITE & SCHB are wholesalers, TDCM a retailer, ETRD a retail ECN and ARCA an ECN.
NITE : This is the king MM of the OTC. He intimides traders and other MMs use that to their advantage knowing that he scares them. That's why NITE is the shaker on most stock runs; he is the most common ax. NITE could be on the ask all the time, he could be leading a dip scaring sellers to his buddies SCHB and TDCM on the bid.
TDCM : Retailer MM, you love him on the bid.
Biggest OTCBB ECNs : GNET, TRAC & DATA - you love them on bids also.
Other ECNs : ARCA, BRUT, BTRD, INCA, INTL, ISLD, REDI
Big Shorters : JIMK, POND, GNET or ARCA (anyone can use GNET, even other MMs because it's an ECN).
Wholesalers : ETRD, HRZG, MASH, NITE, SHWB
Top Retail Dilutors : ACAP, AGIS, BAMM, BMIC, CHIG, CLYP, FANC, FRAN, JIMK, MAYF, NATL, PERT, SACM, UCAP, VERT, VFIN
Thank BUD
Posted by: stervc Date: Monday, April 28, 2008 8:40:08 AM
In reply to: None Post # of 58875
Concerning the UHCR CUSIP# Change...
This is a revision of a post that I had done a few months back that might be of some use here for UHCR. A few months back I called the CUSIP Service Bureau at 212-438-6565 and spoke to a few people. I finally landed at speaking with a guy by the name of Vinnie. Please forgive my redundancy for posting this if it has already been thoroughly discussed. Pay particular attention to what's in bold below. The above phone number is from the link below:
http://www.cusip.com/
Vinnie informed me that a CUSIP change "usually" comes with a name change, but not always. He stated that a name change will "always" come with a CUSIP# change though. He told me that the "name change" and the "CUSIP# change" starts with the company's Transfer Agent (TA) coordinating electronically with the CUSIP Service Bureau by linking the company's name and address. Then the CUSIP Service Bureau Coordinates with the Depository Trust Company (DTC).
The DTC will serve as the overseer to coordinate with whomever as deemed necessary. Sometimes the TA will coordinate with the DTC too for certain confirmations or transactions as deemed necessary. The DTC makes sure there is proper share accountability for proper dissemination into our brokerage accounts. This is all done electronically.
After the company/TA receives their new CUSIP# from the CUSIP Service Bureau, the company/TA (& legal team) then coordinates with the NASDAQ and SEC for the already coordinated amount of shares as the new inventory. The company/TA will then coordinate with the DTC to confirm the amount of shares and other key info.
After accountability is confirmed by the DTC, the DTC then authorizes the brokerage companies to change all old CUSIP numbers to the new CUSIP numbers electronically within our brokerage accounts. A CUSIP# change is not enough from what most believe throughout the investing/trading community to force a covering of a naked shorted position in my opinion.
Personally, I think some companies don't fully understand why it is important to do a "name change" and "CUSIP# change" if you are trying to force a covering of a naked shorted company. A ticker change wouldn't hurt either although the guy informed me that he is not knowledgeable about ticker changes as that coordination goes through the NASDAQ/NASD/FINRA and SEC with the company's legal team.
Vinnie, from the CUSIP Service Bureau, explained it to me as when stock 1234 changes its name and CUSP# to stock 5678, the shares of stock 5678 are given to them electronically by the TA to replace stock 1234. This is the key transaction. If only a CUSIP# change transpires then a lesser type of accountability takes place. The name change matching the address of the company is what actually forces an exchange of the "old inventory" of shares to the "new inventory" of shares. Without the name change, there is NOT a "movement of shares" from the TA that takes place.
Only one phase of the accountability process is required to take place to verify accountability when only a CUSIP# change transpires because of the lack of not having a creation of the "new inventory" of shares by the company/TA. Therefore no movement of shares takes place. This is a simple misunderstanding by many companies, but if not considered, it could be the difference for any type of forced covering of any naked shorted positions.
If there is NO DILUTION, a covering of the naked shorted positions should take place due to what's revealed during the accountability process between the DTC after getting the "new inventory" of shares from the CUSIP Service Bureau if there is not only a CUSIP# change, but a name change too.
Because of the CUSIP# change, the MMs will be required to account for each of the old shares with the new shares. Because of the name change, it's important because it forces the DTC to play a more finite role by not only accounting for the old shares to equal the new shares electronically, but forces them to match a "new inventory" of shares that have been given to them from the CUSIP Service Bureau as the new official/approved inventory by way of the shares given from the company/TA.
Hopefully this information helps investors/traders to have a better understanding as to the importance of not just a CUSIP# change, but a name change too.
v/r
Sterling
Posted by: Jim Bishop Date: Monday, April 28, 2008 1:53:38 PM
In reply to: blockbuster who wrote msg# 43700 Post # of 58875
There are rules to follow regarding buybacks.
Rule 10b-18 -- Purchases of Certain Equity Securities by the Issuer and Others
Rule 10b-18 provides an issuer (and its affiliated purchasers) with a "safe harbor" from liability for manipulation under sections 9(a)(2) of the Act and Rule 10b-5 under the Act solely by reason of the manner, timing, price, and volume of their repurchases when they repurchase the issuer's common stock in the market in accordance with the section's manner, timing, price, and volume conditions. As a safe harbor, compliance with Rule 10b-18 is voluntary. To come within the safe harbor, however, an issuer's repurchases must satisfy (on a daily basis) each of the section's four conditions. Failure to meet any one of the four conditions will remove all of the issuer's repurchases from the safe harbor for that day. The safe harbor, moreover, is not available for repurchases that, although made in technical compliance with the section, are part of a plan or scheme to evade the federal securities laws.
Regardless of whether the repurchases are effected in accordance with Rule 10b-18, reporting issuers must report their repurchasing activity as required by Item 703 of Regulations S-K and S-B and Item 15(e) of Form 20-F (17 CFR 249.220f) (regarding foreign private issuers), and closed-end management investment companies that are registered under the Investment Company Act of 1940 must report their repurchasing activity as required by Item 8 of Form N-CSR (17 CFR 249.331; 17 CFR 274.128).
Posted by: Jim Bishop Date: Monday, April 28, 2008 3:23:18 PM
In reply to: zardiw who wrote msg# 43760 Post # of 58875
OTC Equity Short Interest report for April 15th settlement date is finally out...should have been posted last week.
UHCR short, a whopping 22 shares reported to the SROs.
http://otcbb.com/asp/OTCE_Short_Interest.asp
http://otcbb.com/asp/OTCE_Short_Interest_popup.asp?Symbol=uhcr&StlmtDt=04/15/2008
Posted by: redsoxnumba1 Date: Thursday, May 01, 2008 7:19:54 PM
In reply to: m02 who wrote msg# 5944 Post # of 8261
http://www.bloomfieldinvestmentclub.com/pages/public/stockcontest/Default.aspx
day of each month until the 20th day of each month members will submit two stocks that they think (or know) will see the highest combined net gain by the last trading day of that month. On the 20th day of the month the contest will be closed to new picks.
There is a newly added page to the site that is entitled "Contest Standings". Members will be able to log on and go to this page to see their rankings on a daily basis. Members will be listed by their user name minus the @ and the service provider name (hotmail, gmail, yahoo.etc.). The member with the highest combined gains on his or her two stock "quinella" at the closing bell (last transaction price according to the Quote Stream data) on the last day of the month will win the cash and a one month Premium Package subscription. If you want to know what the Premium Package includes go to our "Package Details" page and check it out.
We want everyone to have a good time with this and we are depending on members to spread the word. Tell your friends, associates, and chat room buddies...unless of course you think they can out pick you.
CONTEST RULES:
YOU MUST BE A REGISTERED MEMBER TO ENTER
ABSOLUTELY NO entries will be accepted until the 1st and ABSOLUTELY NO entries will be accepted after midnight on the 20th
ALL entries must be sent to contest@bloomfieldinvestmentclub.com and NOT to the "contact us" link on the website.
When you submit your picks they will be taken from the closing price of the day the picks are submitted. That means if you submit your picks right before the bell or during trading hours your pick will be taken at the closing bell price.
All picks must have a share price of at least .0003 in order to be eligible...any one can paint the tape on two .0001 x .0002 stocks to close up 200% on the month...that is not what we are looking for. Keeping this in mind, if you have a stock that is priced at .0001 it will be accepted, but your pick price will be .0003.
Each of the 2 stocks that are entered must trade an average of $2000.00 per trading day each for the month. That means if there are 20 trading days in the month your picks most trade a total of $40,000.00 each throughout the month during the regular trading session. Almost every pick this month traded well over that amount, so as long as your picks trade this new rule should not be a problem.
On the last trading day of the month when the top stock picker has been declared the contest will start over and all picks must be resubmitted, whether they are the same old tired picks or not.
The Bloomfield Staff will settle any disputes and all Bloomfield Staff decisions are final.
Posted by: NorthLion Date: Monday, May 05, 2008 8:53:16 PM
In reply to: $oldier Hard who wrote msg# 9720 Post # of 11923
It seems ludricous that some are willing to part with their shares so cheaply, like we saw today. Were they disappointed that the share price didn't go above $1.00 as we went through the R/S? Or did they expect their LHC shares by now and are not willing to wait for the process to be completed over the next few months? Were they worried that we have hit a ceiling and that the SP would tank, so they got out now? Who knows, but impatience usually yields poor results.
Warren Buffet is one of the world's most succesful investors, and he is also one of the most patient. I like to collect some of his quotes; a couple that I think could well apply to MTRE are:
“It's far better to buy a wonderful company at a fair price than a fair company at a wonderful price.”
Why not invest your assets in the companies you really like? As Mae West said, "Too much of a good thing can be wonderful".
I like this company and the way it is steadily developing. I have also been fortunate to be able to buy in largely at very undervalued prices. But, even the price levels we are seeing now are still bargains, IMO. I expect that the coming months will prove that this is true.
Posted by: Trump_09 Date: Monday, May 05, 2008 9:59:45 PM
In reply to: Salty Pepper who wrote msg# 45337 Post # of 58875
Per TheStreet.com glossary... the UHCR restricted shares are not tradable for a minimum of one year
MARKET CAPITALIZATION
Market capitalization is a measure of the value of a company, calculated by multiplying the number of either the outstanding shares or the floating shares by the current price per share.
For example, a company with 100 million shares of floating stock that has a current market value of $25 a share would have a market capitalization of $2.5 billion.
Outstanding shares include all the stock held by shareholders, while floating shares are those outstanding shares that actually are available to trade.
Market capitalization, or cap, is one of the criteria investors use to choose a varied portfolio of stocks, which are often categorized as small-, mid-, and large-cap. Generally, large-cap stocks are considered the least volatile, and small caps the most volatile.
The term market capitalization is sometimes used interchangeably with market value, in explaining, for example, how a particular index is weighted or where a company stands in relation to other companies.
Posted by: Jim Bishop Date: Wednesday, May 07, 2008 1:20:38 PM
In reply to: weatherdude who wrote msg# 45875 Post # of 58875
OT: No Microsoft didn't start pink, it was never a penny stock, although that is a popular urban myth on the stock threads.
It IPO'd in 1986 at $21.00 but the first trade was at $25.50 and hit a high of $29.25 that day and closed at $27.75.
Initial public offering raised $61 million. They had $140+ million in revenues in 1985.
http://www.thocp.net/companies/microsoft/microsoft_company.htm
Posted by: dak77 Date: Wednesday, May 07, 2008 9:30:10 PM
In reply to: Marty_Gallas who wrote msg# 1465 Post # of 15558
Marty, when we get our returns from this stock here's the worlds gas prices to spend your profits on.............................
Gas prices around the world
Think you pay a lot for gas? Perhaps you'd prefer to live in Venezuela.
NEW YORK (CNN/Money) – Gasoline prices in the United States, which have recently hit record highs, are actually much lower than in many countries. Drivers in some European cities, like Amsterdam and Oslo, are paying nearly 3 times more than those in the U.S.
The main factor in price disparities between countries is government policy, according to AirInc, a company that tracks the cost of living in various places around the world. Many European nations tax gasoline heavily, with taxes making up as much as 75 percent of the cost of a gallon of gasoline, said a spokesperson for AirInc.
In a few Latin America and Middle-East nations, such as Venezuela and Saudi Arabia, oil is produced by a government-owned company and local gasoline prices are kept low as a benefit to the nation's citizens, he said. All prices updated March, 2005.
Nation City Price in USD Regular/Gallon
Netherlands Amsterdam $6.48
Norway Oslo $6.27
Italy Milan $5.96
Denmark Copenhagen $5.93
Belgium Brussels $5.91
Sweden Stockholm $5.80
United Kingdom London $5.79
Germany Frankfurt $5.57
France Paris $5.54
Portugal Lisbon $5.35
Hungary Budapest $4.94
Luxembourg $4.82
Croatia Zagreb $4.81
Ireland Dublin $4.78
Switzerland Geneva $4.74
Spain Madrid $4.55
Japan Tokyo $4.24
Czech Republic Prague $4.19
Romania Bucharest $4.09
Andorra $4.08
Estonia Tallinn $3.62
Bulgaria Sofia $3.52
Brazil Brasilia $3.12
Cuba Havana $3.03
Taiwan Taipei $2.84
Lebanon Beirut $2.63
South Africa Johannesburg $2.62
Nicaragua Managua $2.61
Panama Panama City $2.19
Russia Moscow $2.10
Puerto Rico San Juan $1.74
Saudi Arabia Riyadh $0.91
Kuwait Kuwait City $0.78
Egypt Cairo $0.65
Nigeria Lagos $0.38
Venezuela Caracas $0.12
Posted by: The Rainmaker Date: Thursday, May 08, 2008 1:33:59 PM
In reply to: bud750 who wrote msg# 16124 Post # of 26850
Baron Philippe de Rothschild, ever an opportunist, is said to have advised, “Buy when there’s blood in the streets.” Investors like Warren Buffett do just that all the time.
The point is, you can easily profit from a ghastly investing environment. When everyone else is selling, it may just be the best time for you to step in and pick up a great company for cheap.
Sometimes the blood is your own
But Mark Mobius reported in his book Passport to Profits that there is a second part to Rothschild's quote -- one that is perhaps even more impressive and intellectually inspiring. Buy when there's blood in the streets, "even if the blood is your own."
That means being confident enough in your analysis to buy stocks you already own..
Posted by: Jim Bishop Date: Friday, May 09, 2008 4:18:56 PM
In reply to: rjdover who wrote msg# 46795 Post # of 58875
Pssst Nasdaq and NASD were two different entities. NASD by the way no longer exists...it was replaced by FINRA last year.
http://www.finra.org/index.htm
Posted by: xbigshot1
In reply to: xbigshot1 who wrote msg# 1250125
Date: 5/10/2008 12:19:17 PM
Post #
UNCLE MIKEY talk for ROOKIES...PART 2:
some of you guys are COMPLETELY clueless on smallcap stocks.....i dont give a rip who is saying what about what stock.......you simply CANNOT play a pink/otcbb stock like you do a naz or nyse stock......two completely different animals....the only similarity is that they both have SYMBOLS, and thats where the similarities stop....last year i found myself upside down in a ton of stocks last summer....found myself playing some ole bad tapes in my head, and was light on buying power, and didnt really have the money to play some of the runners......big mistake.....and yeah i probably have a lil larger port than some, but if you think it doesnt happen to seasoned traders, GUESS AGAIN........and if it happens to veterans, i KNOW its happening to rookies.......i have been there........so try this, regardless of what you may read about some possible high flyer: TAKE THE QUICK PROFIT and GET OUT!.......just try it and see if this helps.......it helped me and i know it will help you................too many guys are getting stuck and are simply BUYING TOO HIGH........old rule of thumb......"buy when others are selling and selling when others are buying"....another version: " buy the silence, sell the noise"..........there are just too damn many folks out there who are buying the sells at or near the top........you simply cannot do this!!!!!!!PERIOD!!!!!!!
again, everyone have a great day
mikey
Posted by: xbigshot1
In reply to: xbigshot1 who wrote msg# 1249420
Date:5/10/2008 11:53:19 AM
Post #of 1250131
UNCLE MIKEY talk for ROOKIES:
It seems like every year we have to break in a whole new bunch of posters, you guys know who i am talking about:.....the koolaid gang, the rookies, the newbies, the stuckholders, the bashers, the fundamentalists, the po'd party, etc......
i am just astounded at the shear stupidity of some of our brethern, although i can look back a few years ago and see myself in the same mess......had to reload and restart 4 times---three failures and i finally got it right the 4th time.....and because i was wayyyyyyy over my head at the time, the absolute pure volume of bs i would post would make some of our basherbrethern look like choir boys......so why did i do this?......easy answer: it was my only recourse to having a WIN......I COULDNT TRADE WORTH A S****.......and i had to have a win, so my 'WIN' was to confirm that the stock i was in was, indeed, a POS.......in fact i was so good at it, i could site fundamental facts, figures, people, names, dates and places to produce said POS.. and then CONFIRM the POS'ITIS on each subsequent DOWNTICK...ala......."told ya this pos was coming down"......VOILA: A WIN.........I WON........yep, clear and significan win.......no one could OUTPOST the old man, so much so, that I was once written up in a national magazine complete with mugshot for getting my ass handed to me but being a helluva POSTER........what a proud moment that was for me, back in 2000.......national attention....redherring magazine....picture.....email address...full name with city and state.....attention.....15mins of fame.......ohhhhhhhh mannnnnnn the thrill of it all was more than i could bare.....so much so, that i completely forgot that i had lost $15,000 on that pos........didnt matter, i was a "somebody" .....i won the posting contest, and proved i was RIGHT......misplayed the stock?.......didnt matter.....redherring magazine, man......are you serious?.......didnt know how to trade?.......makes no difference......national exposure........left cheek bleeding?.....get out of the stock and take my losses?.......not a chance, i am on a mission here........set mental/broker/qt stops?.....oh please, it aint about the money anymore.....its about me WINNING, and i win with each downtick......TOLD YA this was a pos, and i am right!........RIGHT?........do a search and try to find more dirt on this scumbag and post it with glee?.......yep, thats the ticket, get a confirmation out to the world, that i have no earthly idea wth i am doing.........put that hammer down: WORKS EVRY TIME, you'll feel better, sleep better, possibly get other followers who also cant trade, and generally just leave the computer with a cozy warm fuzzy...... pay no attention to your bank acct and portfolio, those losses are just collateral damage for being a great POSTER!
everyone have a great day
mikey
Posted by: KarinCA Date: Saturday, May 10, 2008 8:52:11 PM
In reply to: Maldical who wrote msg# 47001 Post # of 58875
UHCR...Yes, anyone buying a stock in hopes of it going up is in a "long" position. When selling for a higher price the difference is the profit. You may be in a long term or a short term position.
The term was in existence well before the movie Wallstreet came out.
For those that may not know, a "short" position is one taken when borrowed shares of the stock are sold. You are betting the stock will go down and you can buy the stock back for a lower price while keeping the difference. You may be in a long term or a short term position.
And, you can be a flipper in either direction.
For practical purposes, most aren't able to short pennies. And, for those that are, shares are usually difficult to come by.
In response to:
***On a side note didn't the term "long" come from the movie Wallstreet? Basically what I got from it was a person going "long" was someone that was not shorting the stock. Since we don't short pennies aren't we all "longs". So flippers here are longs also. Am I wrong?***
Posted by: Jim Bishop Date: Tuesday, May 13, 2008 11:23:57 PM
In reply to: janice shell who wrote msg# 47955 Post # of 58875
Of course it is. This guy explains it pretty well for beginners.
All About Dividends
From Joshua Kennon,
Your Guide to Investing for Beginners.
Stock Dividends - An Explanation and Example
Stock Dividends
A stock dividend is a pro-rata distribution of additional shares of a company’s stock to owners of the common stock. A company may opt for stock dividends for a number of reasons including inadequate cash on hand or a desire to lower the price of the stock on a per-share basis to prompt more trading and increase liquidity (i.e., how fast an investor can turn his holdings into cash). Why does lowering the price of the stock increase liquidity? On the whole, people are more likely to buy and sell a $50 stock than a $5,000 stock; this usually results in a large number of shares trading hands each day.
A practical example of stock dividends:
Company ABC has 1 million shares of common stock. The company has five investors who each own 200,000 shares. The stock currently trades at $100 per share, giving the business a market capitalization of $100 million.
Management decides to issue a 20% stock dividend.
It prints up an additional 200,000 shares of common stock (20% of 1 million) and sends these to the shareholders based on their current ownership. All of the investors own 200,000, or 1/5 of the company, so they each receive 40,000 of the new shares (1/5 of the 200,000 new shares issued).
Now, the company has 1.2 million shares outstanding; each investor owns 240,000 shares of common stock. The 20% dilution in value of each share, however, results in the stock price falling to $83.33. Here’s the important part: the company (and our investors) are still in the exact same position. Instead of owning 200,000 shares at $100, they now own 240,000 shares at $83.33. The company’s market capitalization is still $100 million.
A stock split is, in essence, a very large stock dividend. In cases of stock splits, a company may double, triple or quadruple the number of shares outstanding. The value of each share is merely lowered; economic reality does not change at all. It is, therefore, completely irrational for investors to get excited over stock splits. If you do not still fully understand this, you must read How to Think About Share Price. It will clear up any lingering confusion.
One of the more interesting theories of corporate dividend policy is that managements should opt for stock dividends over all other kinds. This will allow investors that want their earnings retained in the business (and not taxed) to hold on to the additional stock paid out to them. Investors that want current income, on the other hand, can sell the shares they receive from the stock dividend, pay the tax and pocket the cash - in essence, creating a “do-it-yourself” dividend.
Special thanks to all of the authors of these posts.
If you come across any posts that you think are especially insightful that others can learn from, feel free to post them here and give the author credit!
To those that see their posts included here, thank-you for your contribution to ihub :)
If you object to your post being included, please let me know along with the post number and I will respect your wishes and delete it as soon as possible.
Please feel free to 'clean out' your saved posts and paste them there so that others can learn from what you believe to be valuable information.
Discussion of posts welcome.... TOS rules apply - so be kind friends.
PLEASE reward posts that you like by member marking the author using the Search option, type in the authors name, select members, then Go. You can view their profile and give them a membermark.
| Volume | |
| Day Range: | |
| Bid Price | |
| Ask Price | |
| Last Trade Time: |


