Register for free to join our community of investors and share your ideas. You will also get access to streaming quotes, interactive charts, trades, portfolio, live options flow and more tools.
It helps to have multiple-monitors to spot opportunities
6 monitor chart layout:
M 1 - Daily and 2 hour showing severals sessions or days:
M 2 - 1 hour, 2-3 sessions and 30 minute showing part of yesterday and today's session so far:
M 3 - 15 minute showing the major market current session from the open and 5 minute showing about 5 hours of the current session:
The lower monitors are for tick charts, each showing diminishing increments of the current session.
The two right hand charts are what I call T-Mode, for order entry...
M 4 - 60T
M 5 - 50T and 40T
M 6 - Time & Sales, 30T (primary T-Mode chart) and DOM
Putting it all together... sharpshortsdaytrading.blogs...
Time Frames, Trend Lines and Signals = REVERSALS...
Some other stuff to consider
Use bracket orders for EVERY entry . . . I use a 4 tick stop-loss and 10 tick initial target with the YM.
Protect your equity at all times with initial stops...This is especially important
when placing orders that don't have very good signals firing on the charts.
Below is a 'feel' based WAG (wild guess) on the O/S Stochastic and MACD lines turning up.
Another thing that can be considered - Let price come back to you...
...also, note that the initial stop was below the recent LOW (using it as support) in the event a fill was made...
Trend Line Break and Late to the party methods...
TLBs suggest imminent trend changes. Trend lines are reflections of Price Action
and can tell you what has been and what is currently happening with prices.
These next two charts show a couple of ways to use trend lines for taking long positions.
After some indicators had printed Signals, a P/A TLB was used as the TRIGGER to BUY.
This 2nd opportunity followed closely behind the one above...
It also uses a P/A pattern (a Money-on-the-Floor pattern)
which confirms that the TLB had indeed reversed the former down trend...
This example uses indicator Signals as the TRIGGER to BUY.
Often if you miss the 1st opportunity you get a second chance to enter the new up trend.
I call the above trade "Late to the party" because it's a 2nd entry in a reversal that's already underway.
REVERSALS RULE
Price can go up, down or sideways...it always has done so and always will.
IMO, reversals from down to up are the easiest to see and to trade.
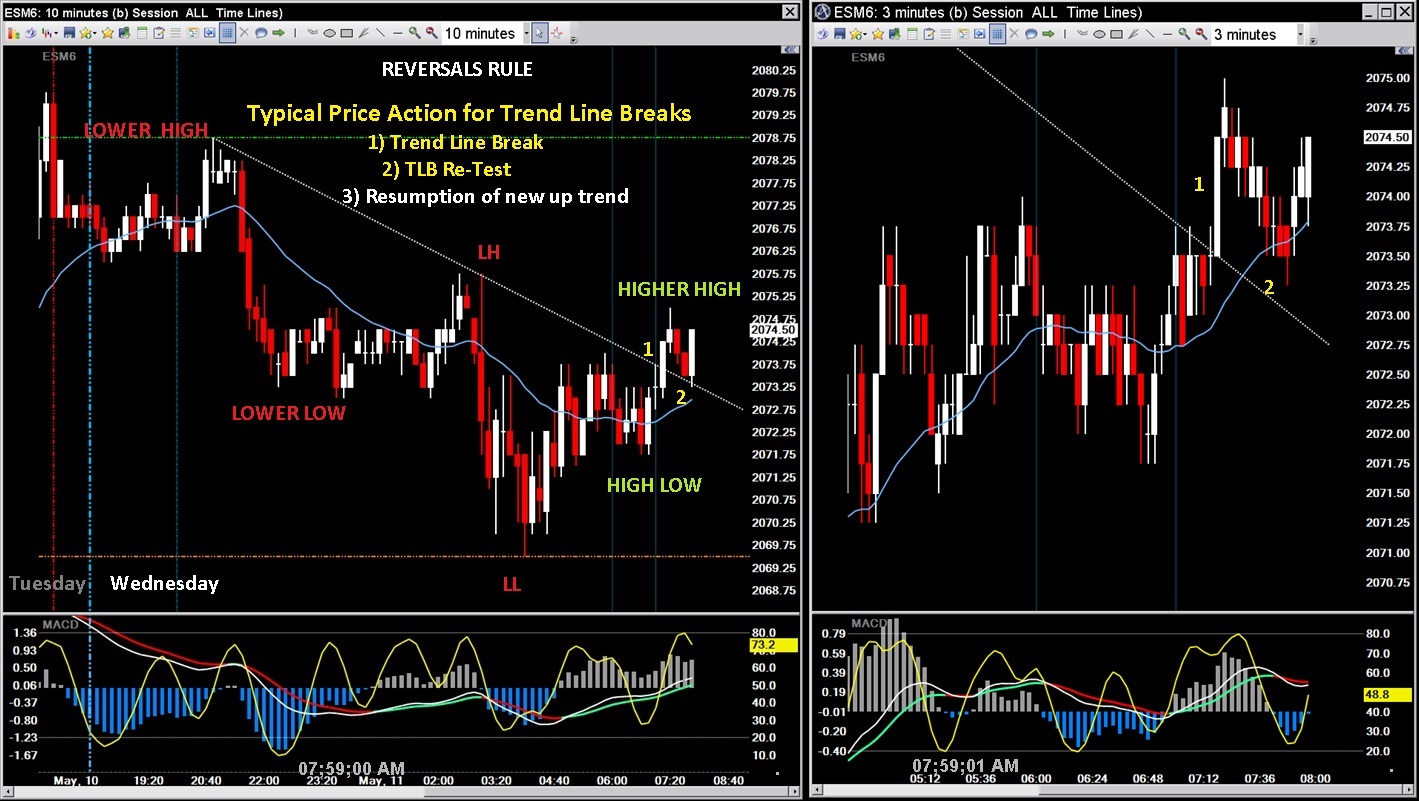
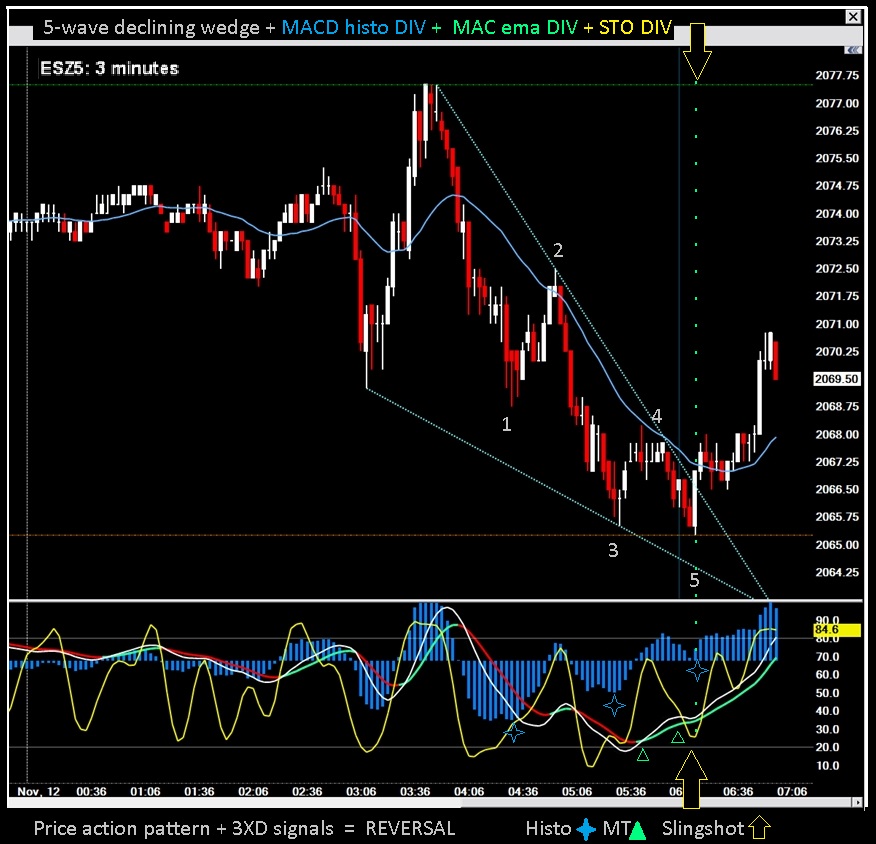
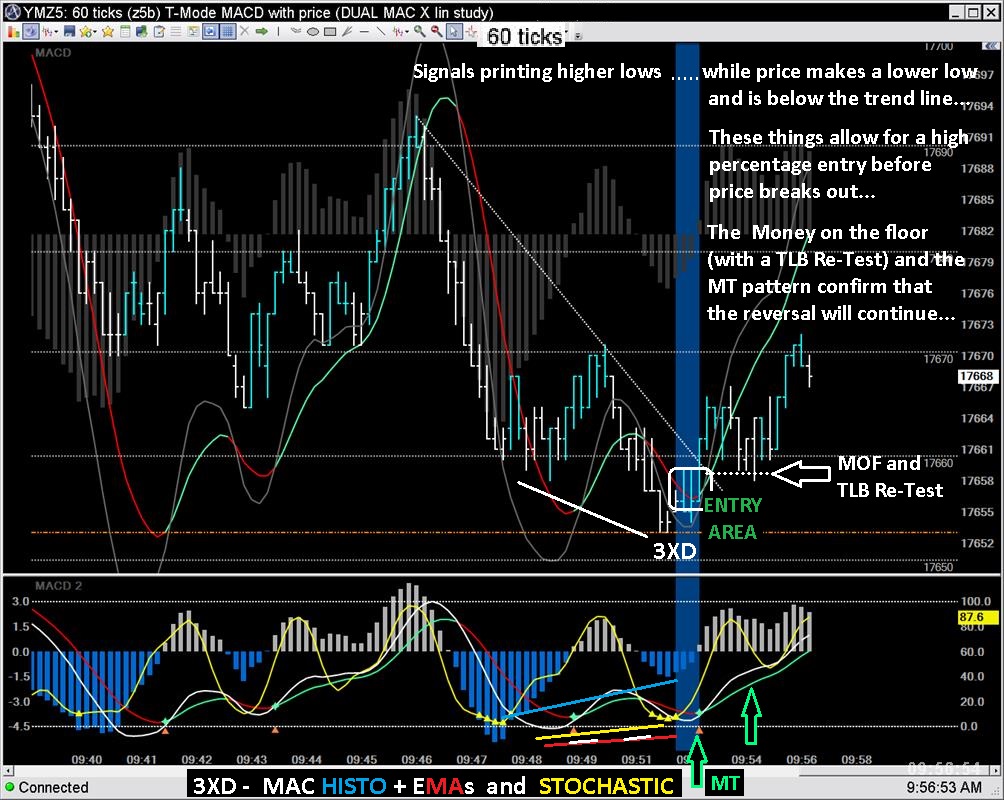
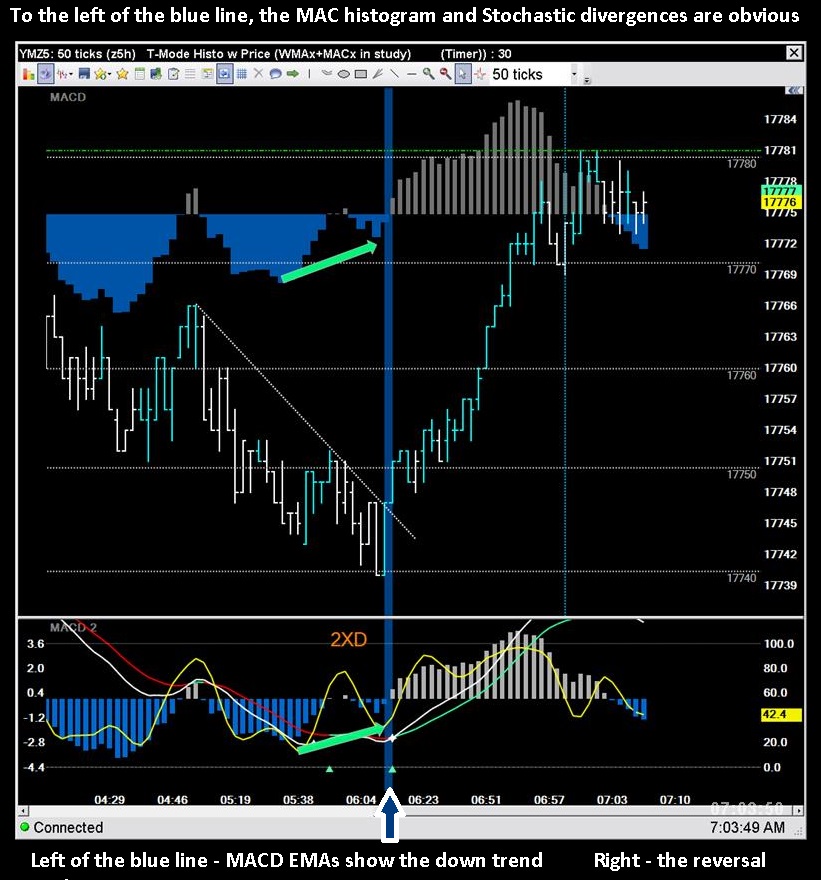
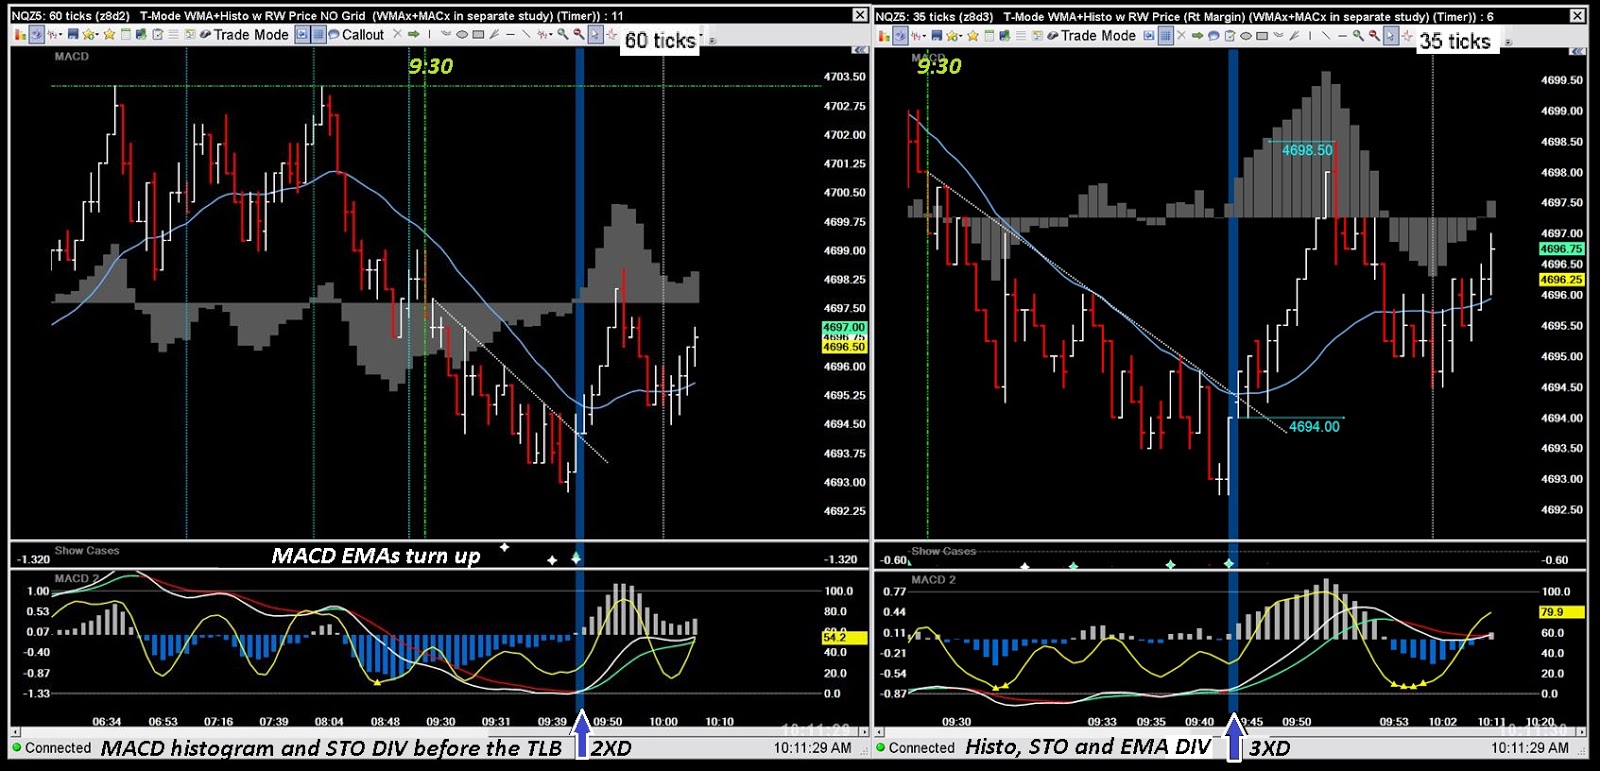
Keep It Simple Scalping... BULLISH REVERSALS RULE!
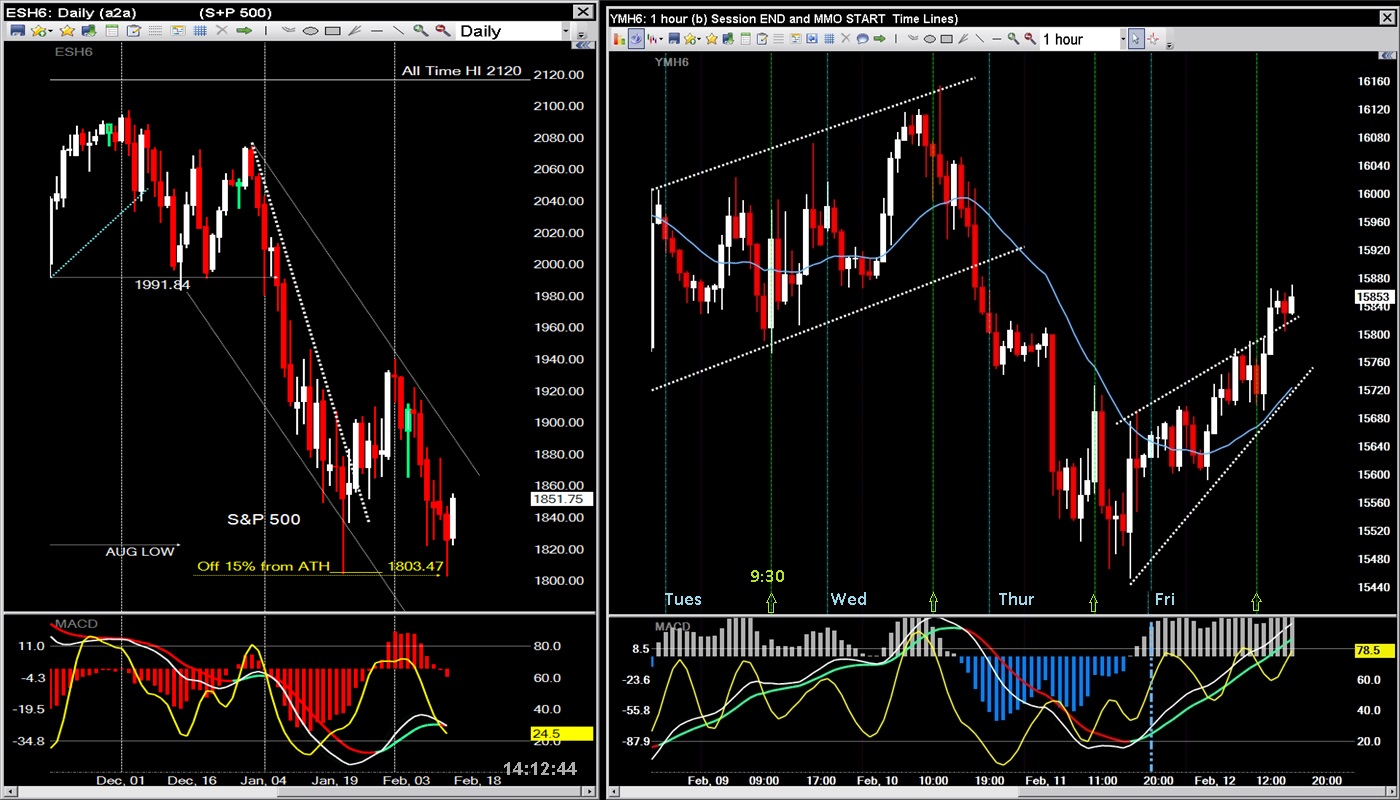
My basic premise : In the markets, what goes down must go up.
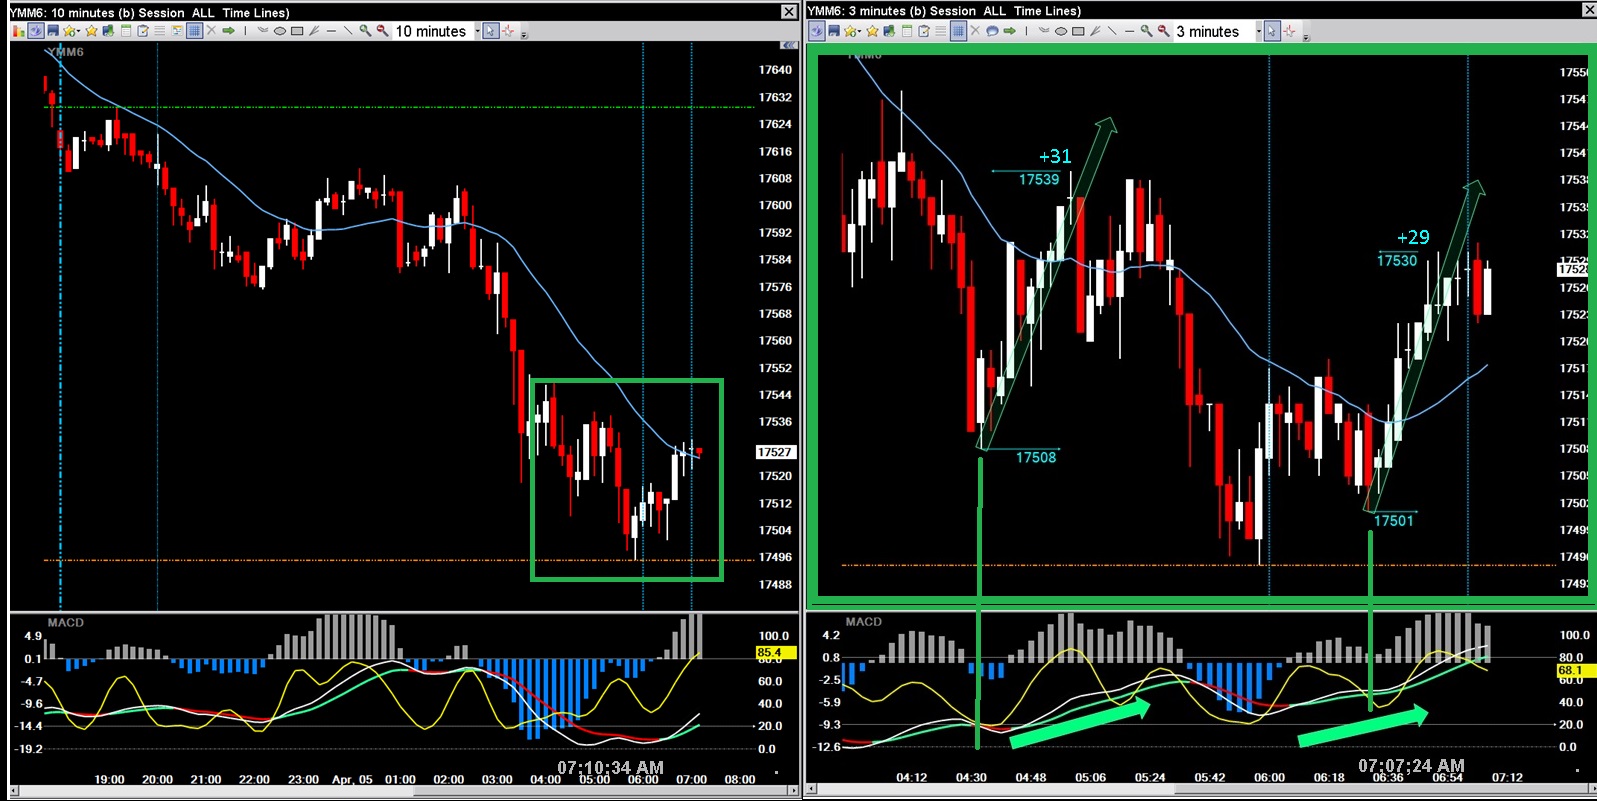
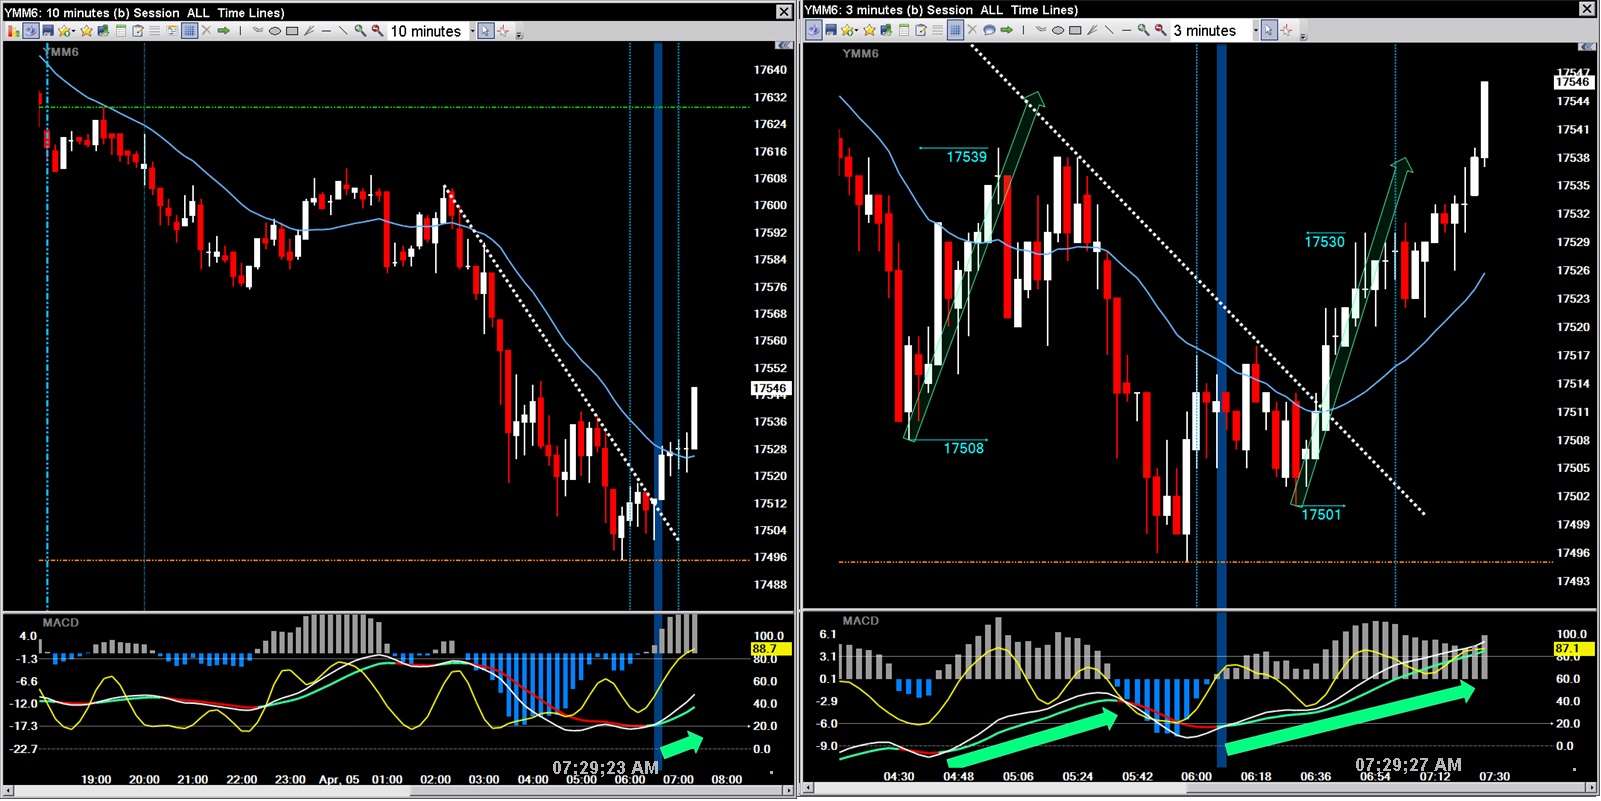
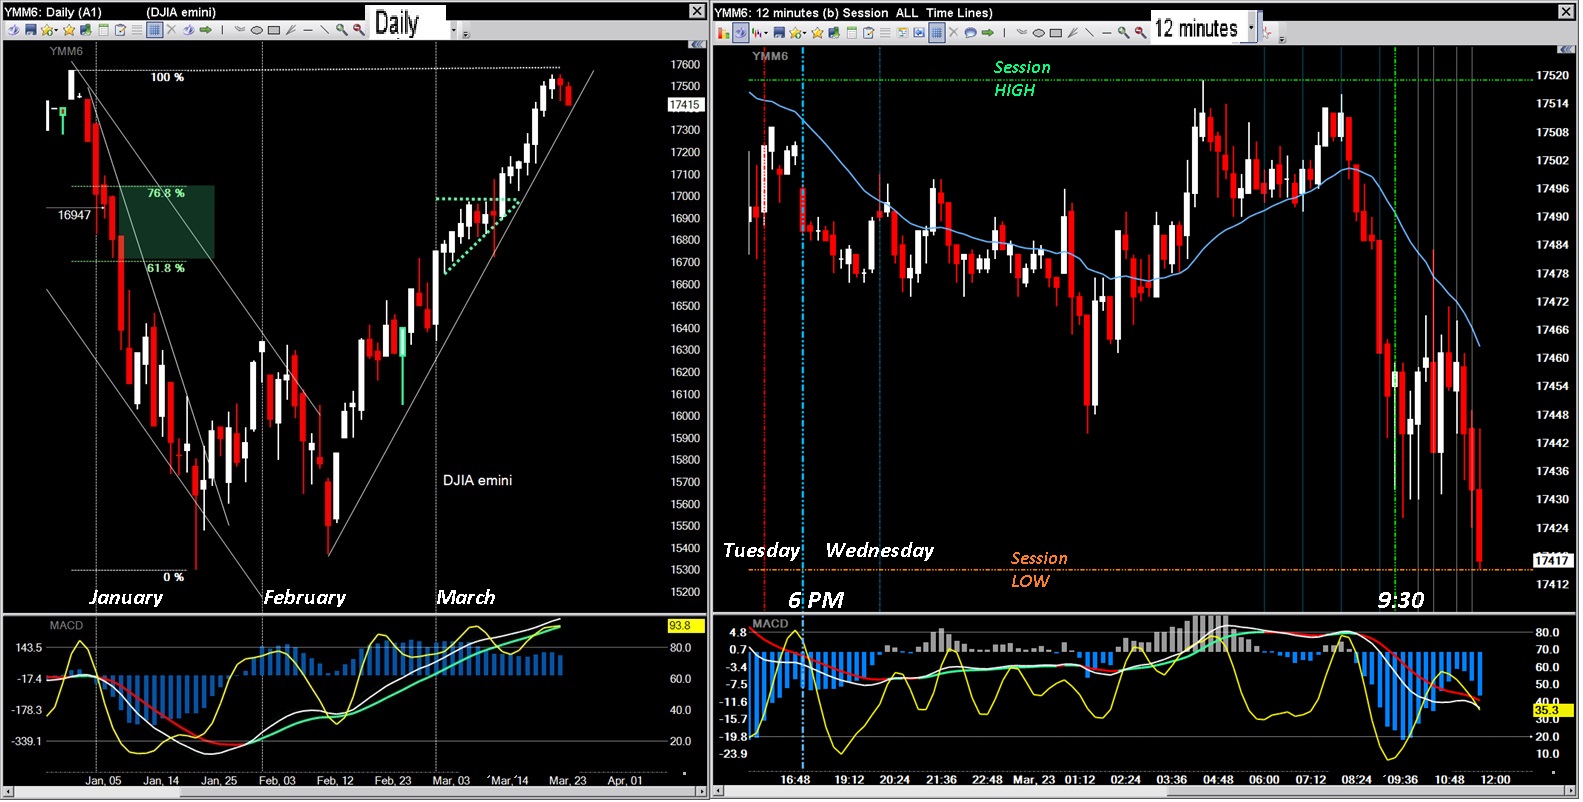
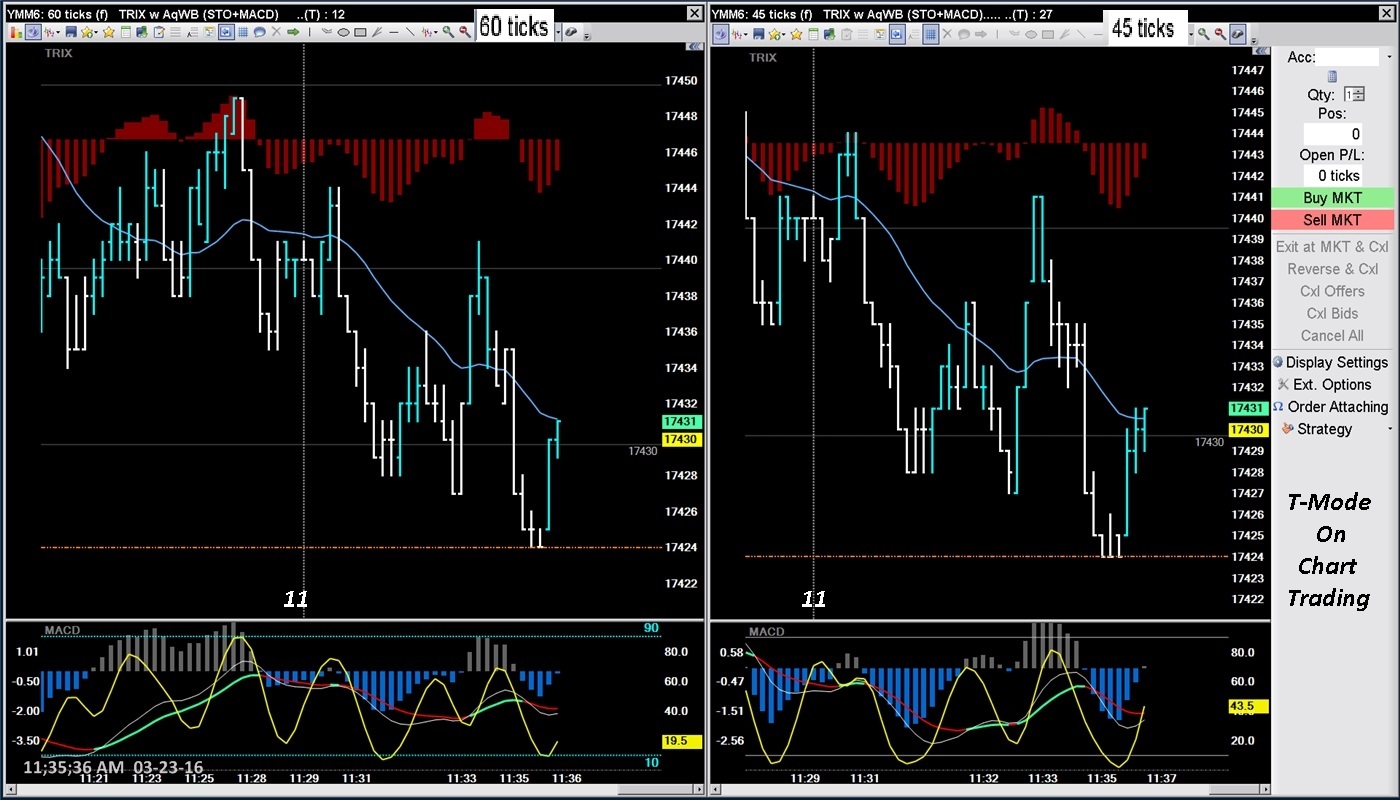
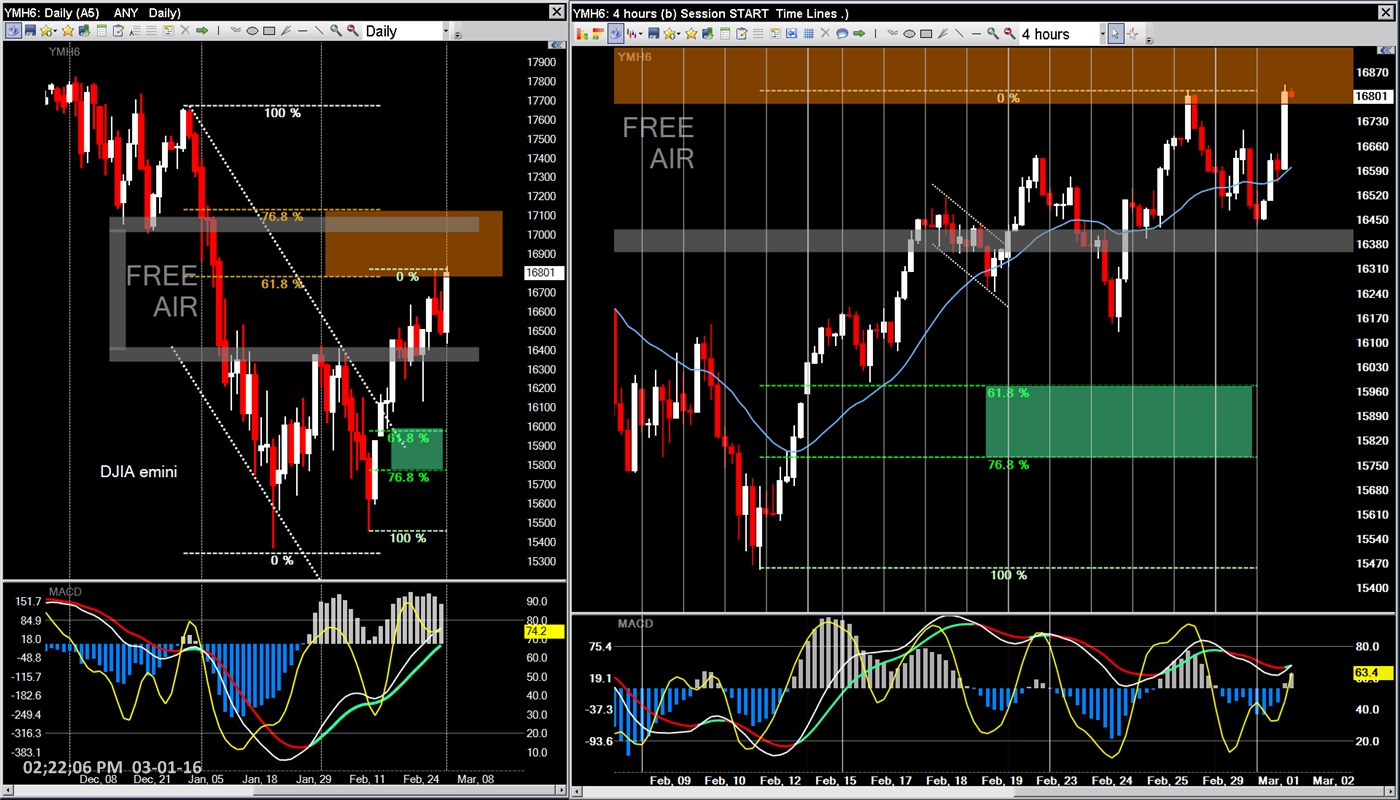
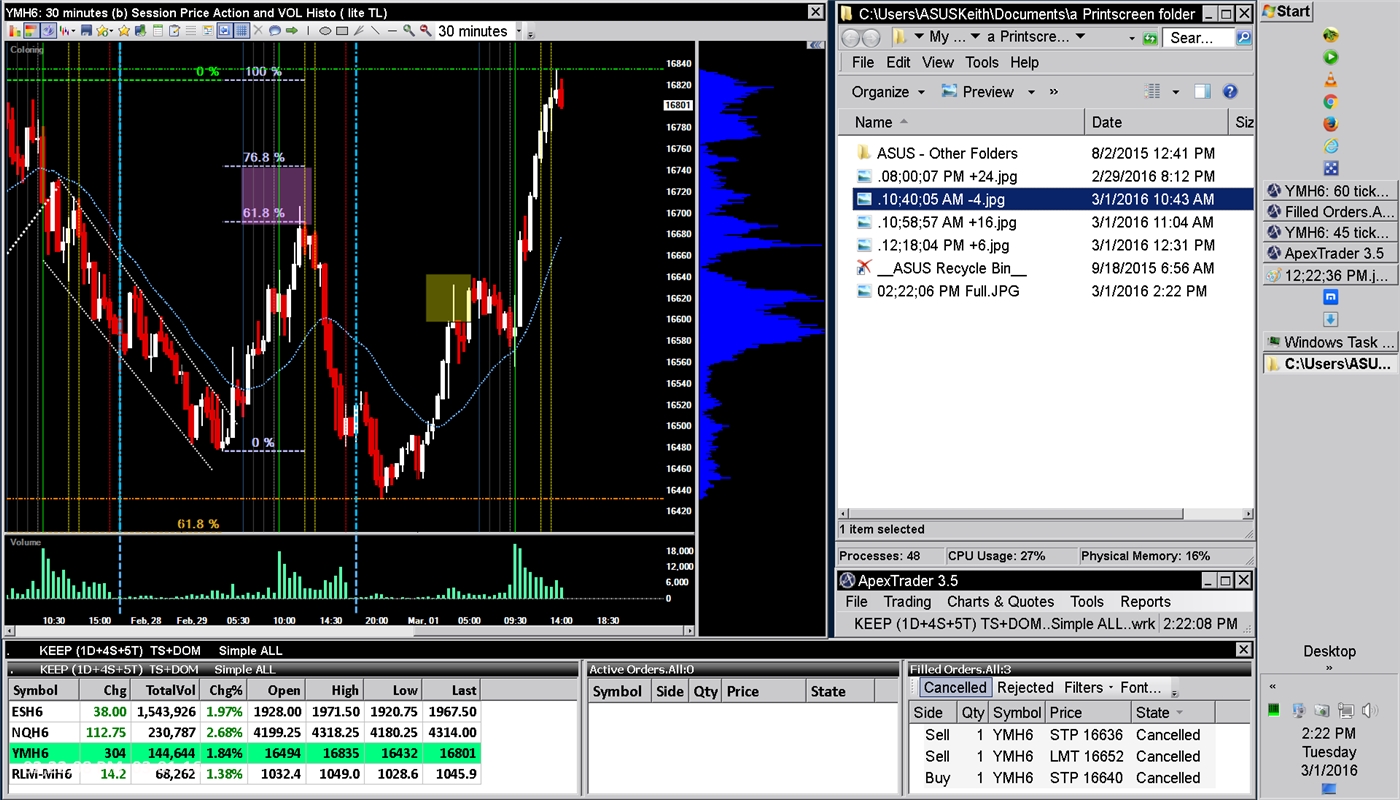
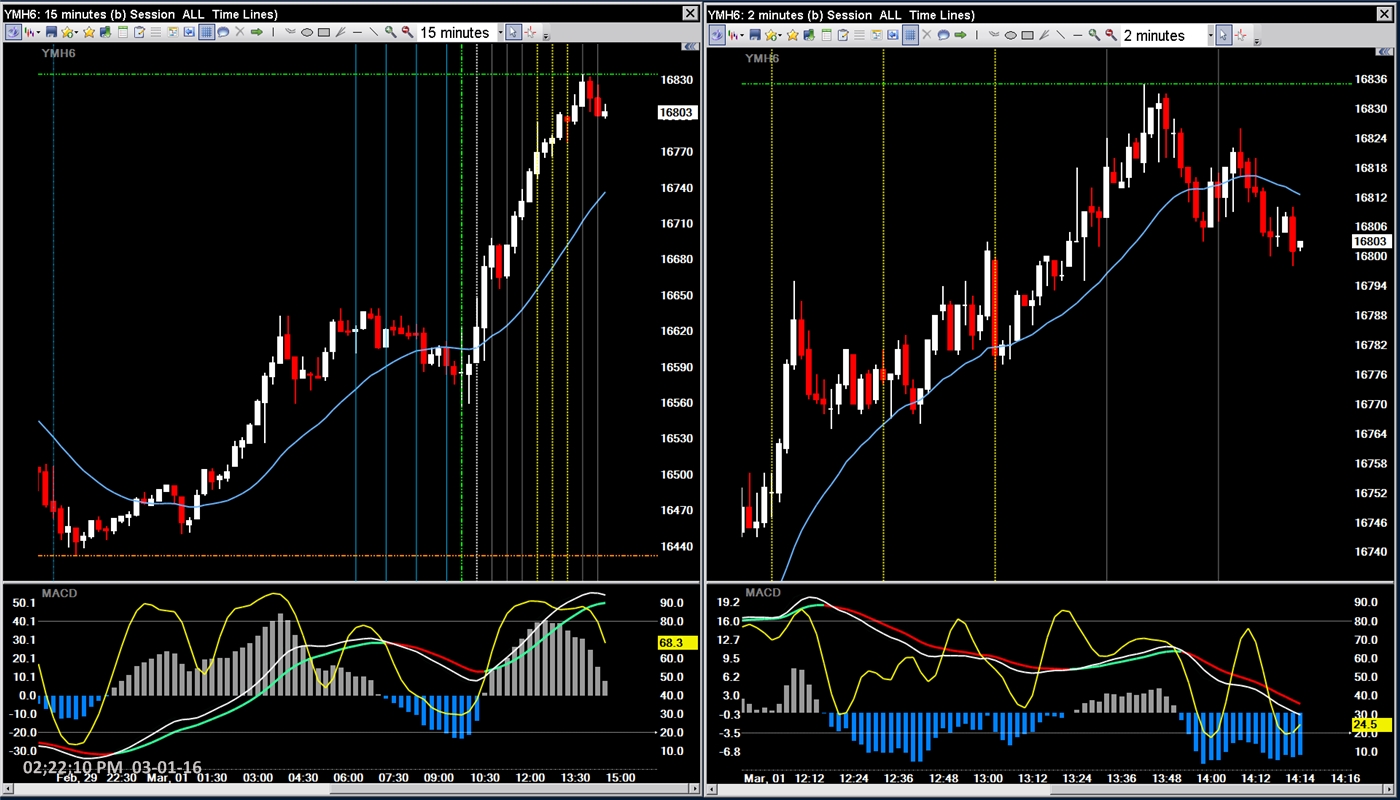
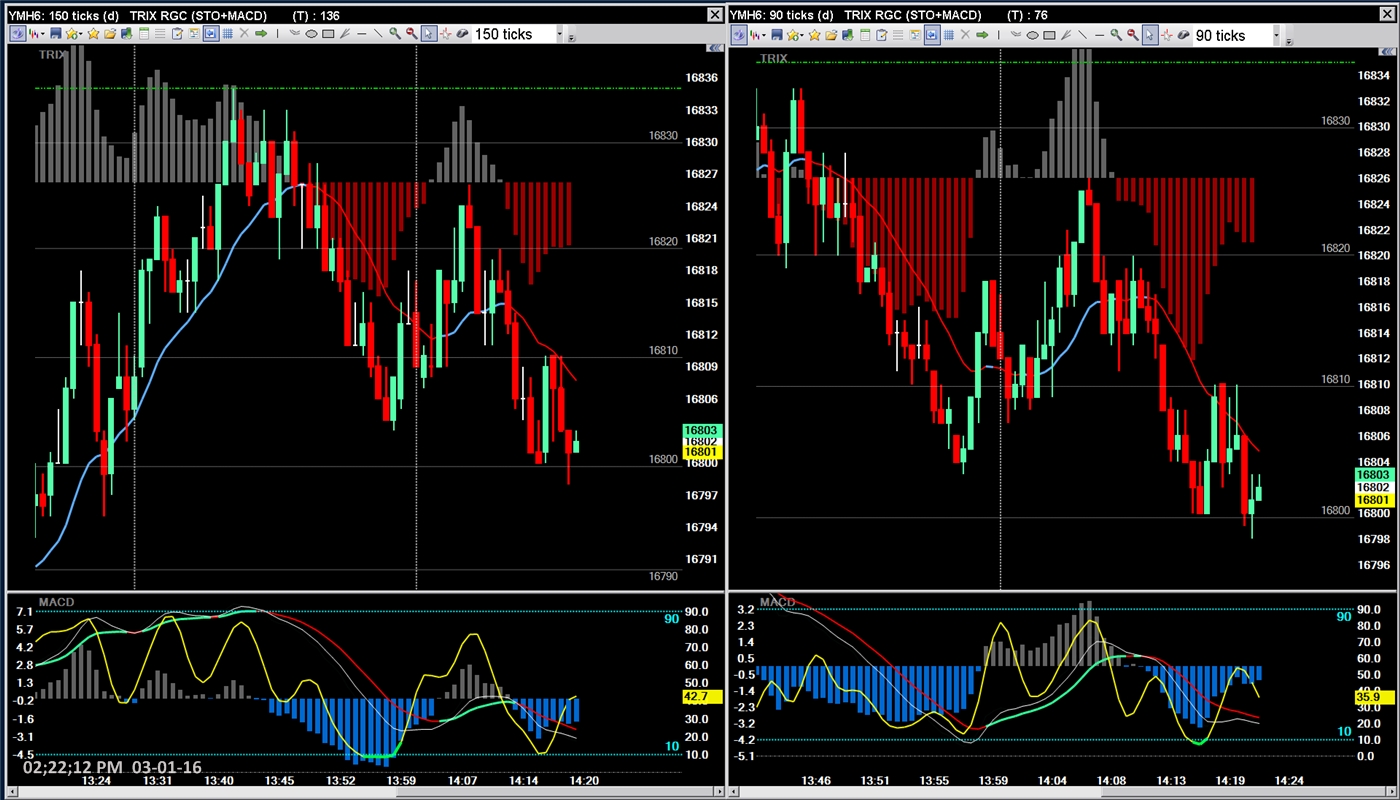
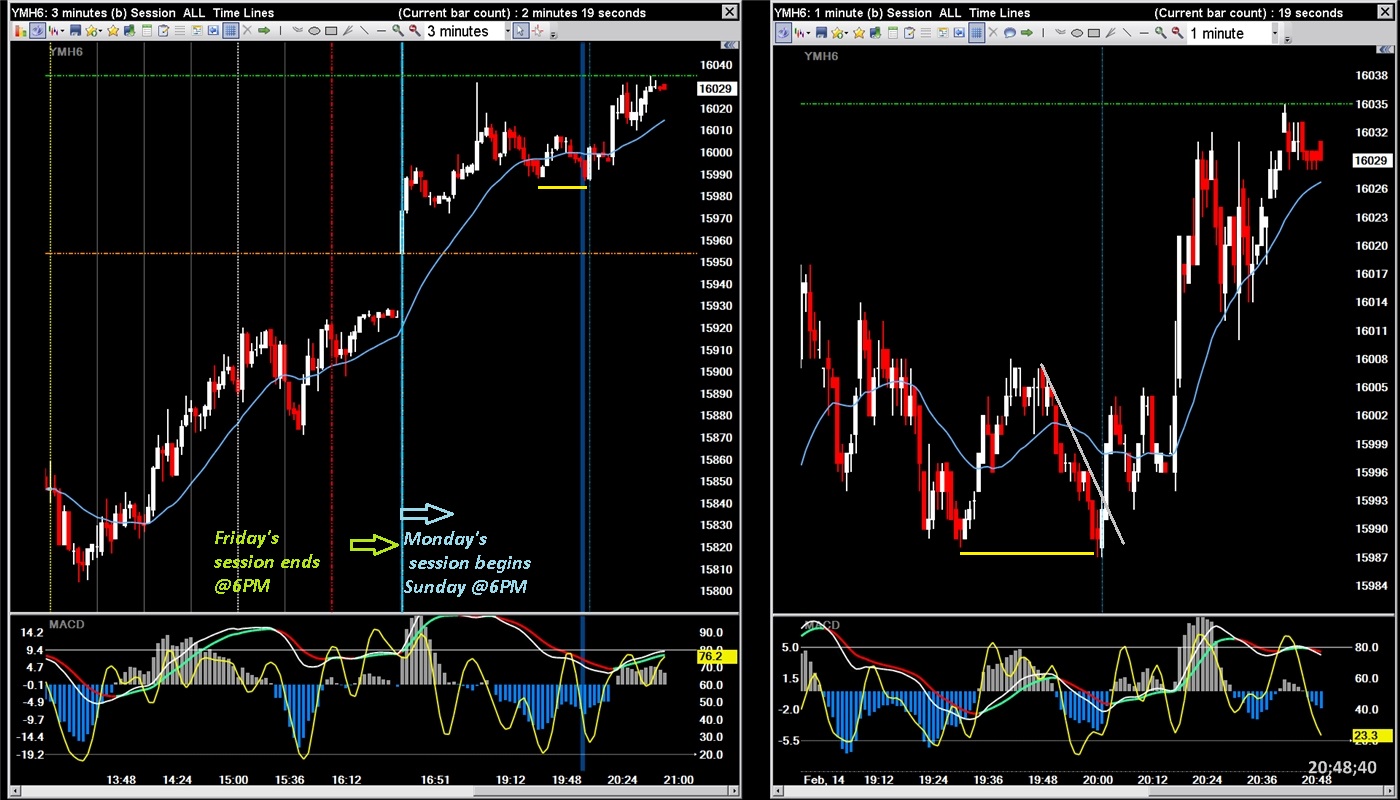
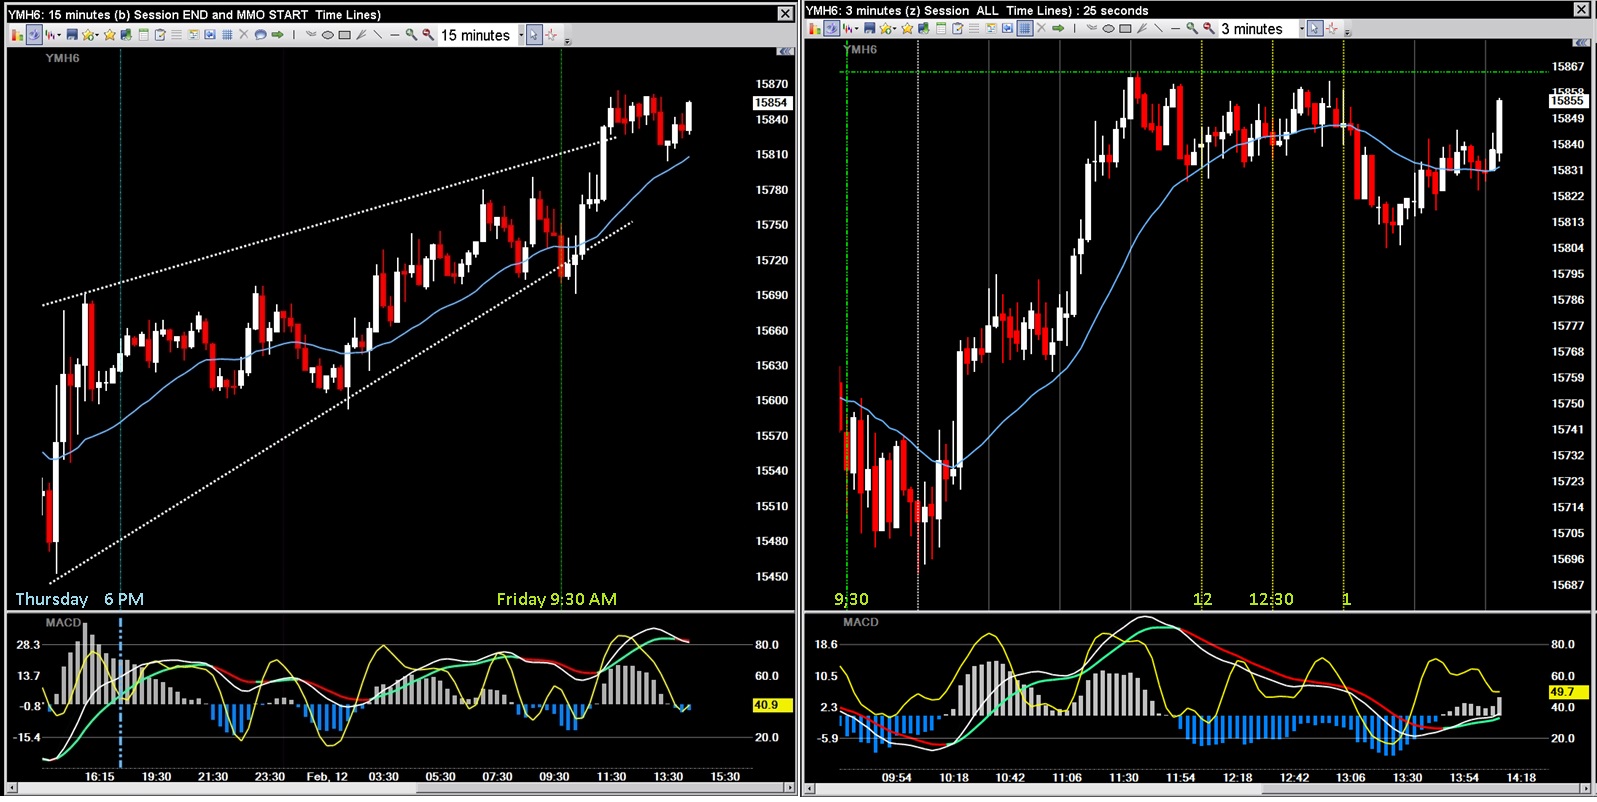
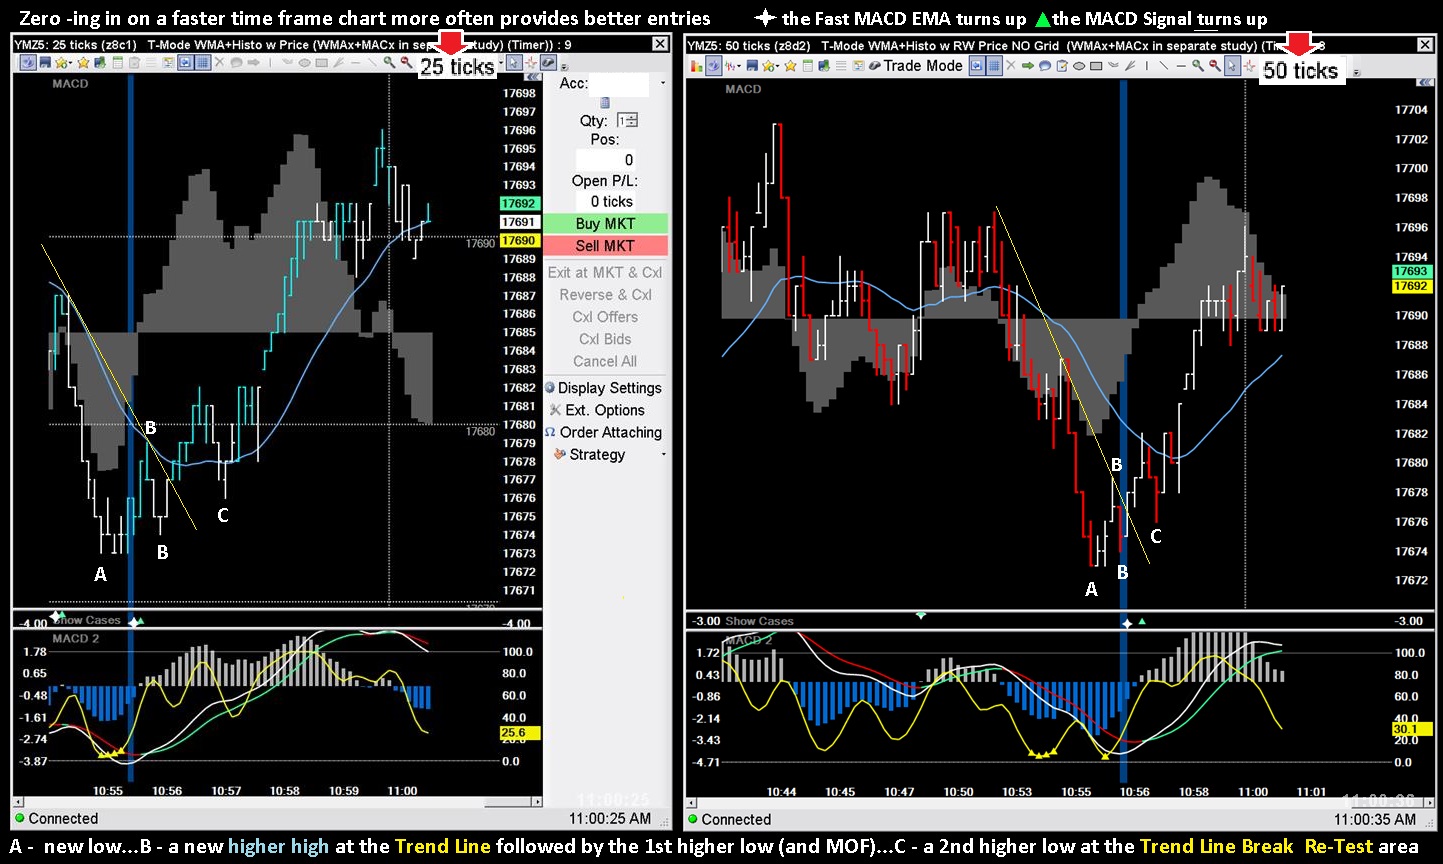
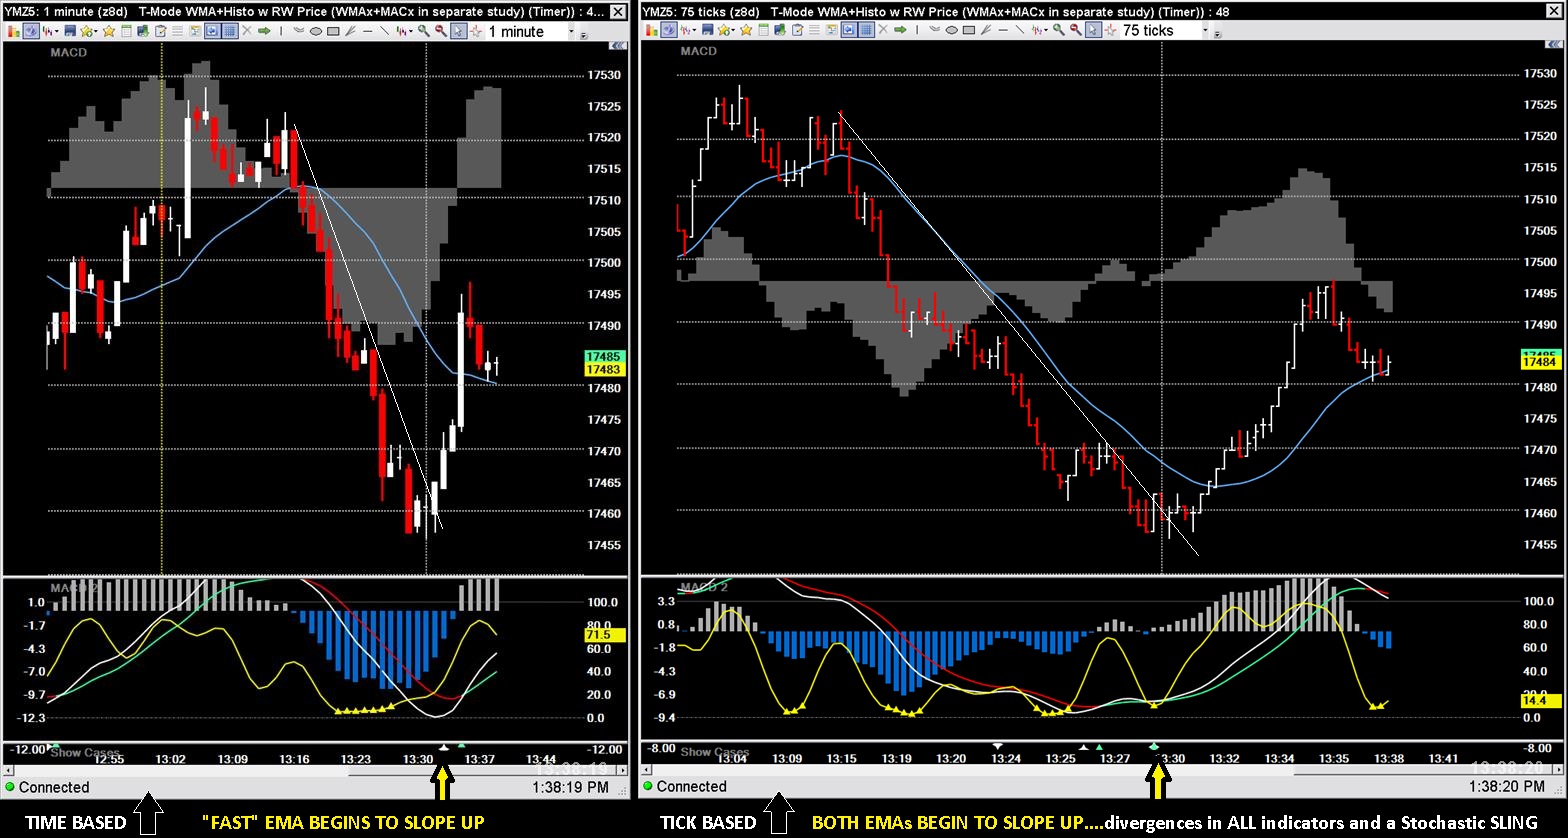
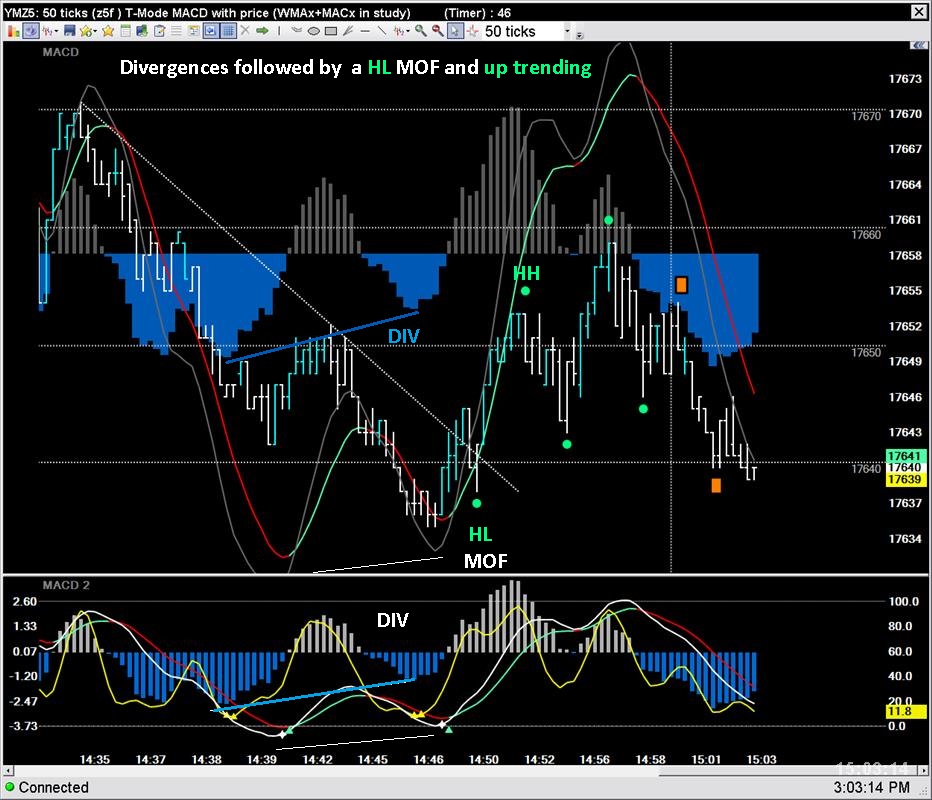
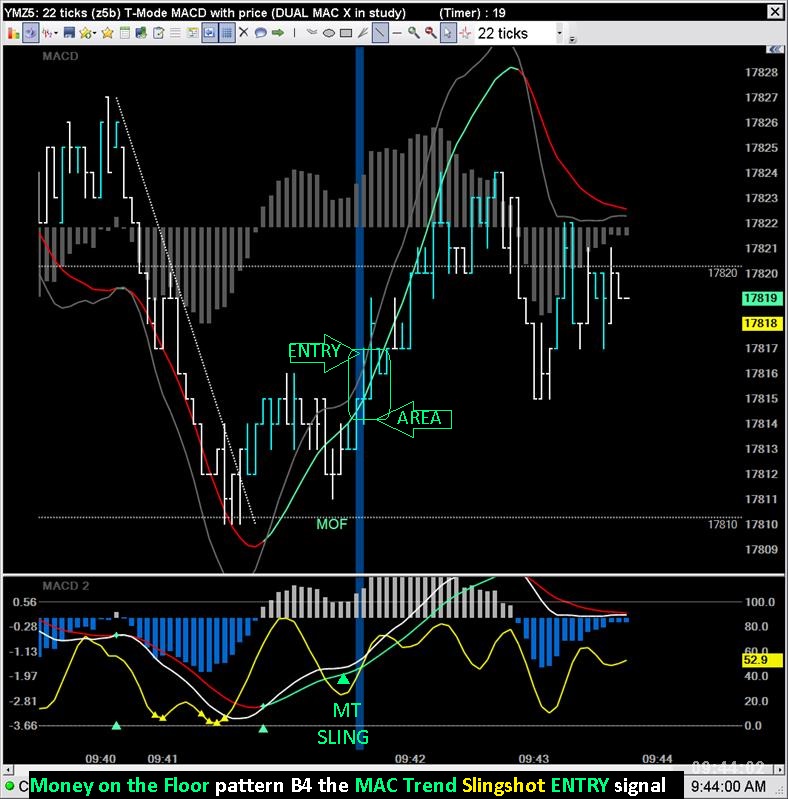
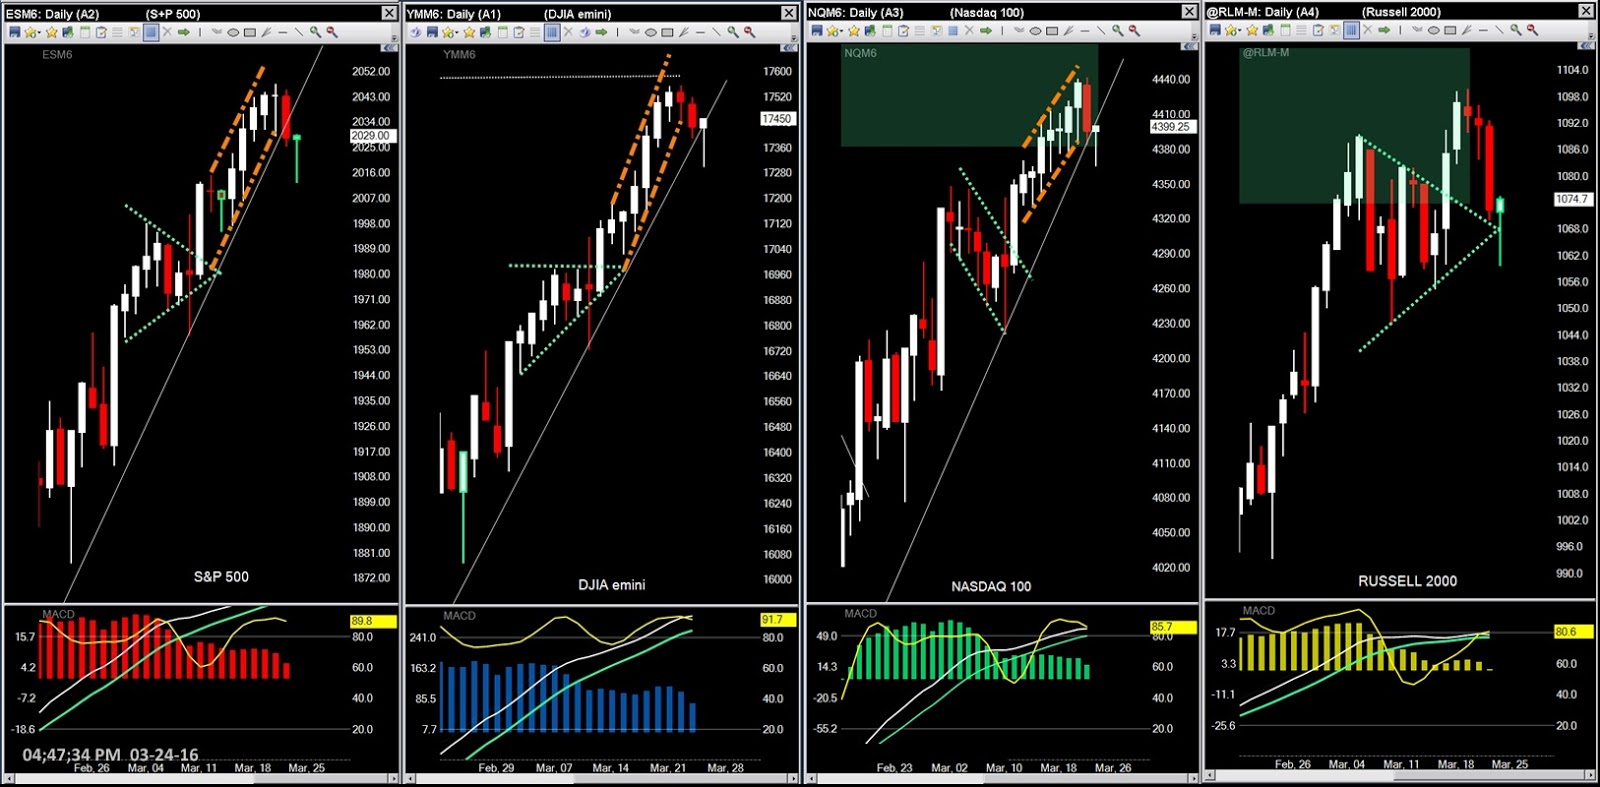
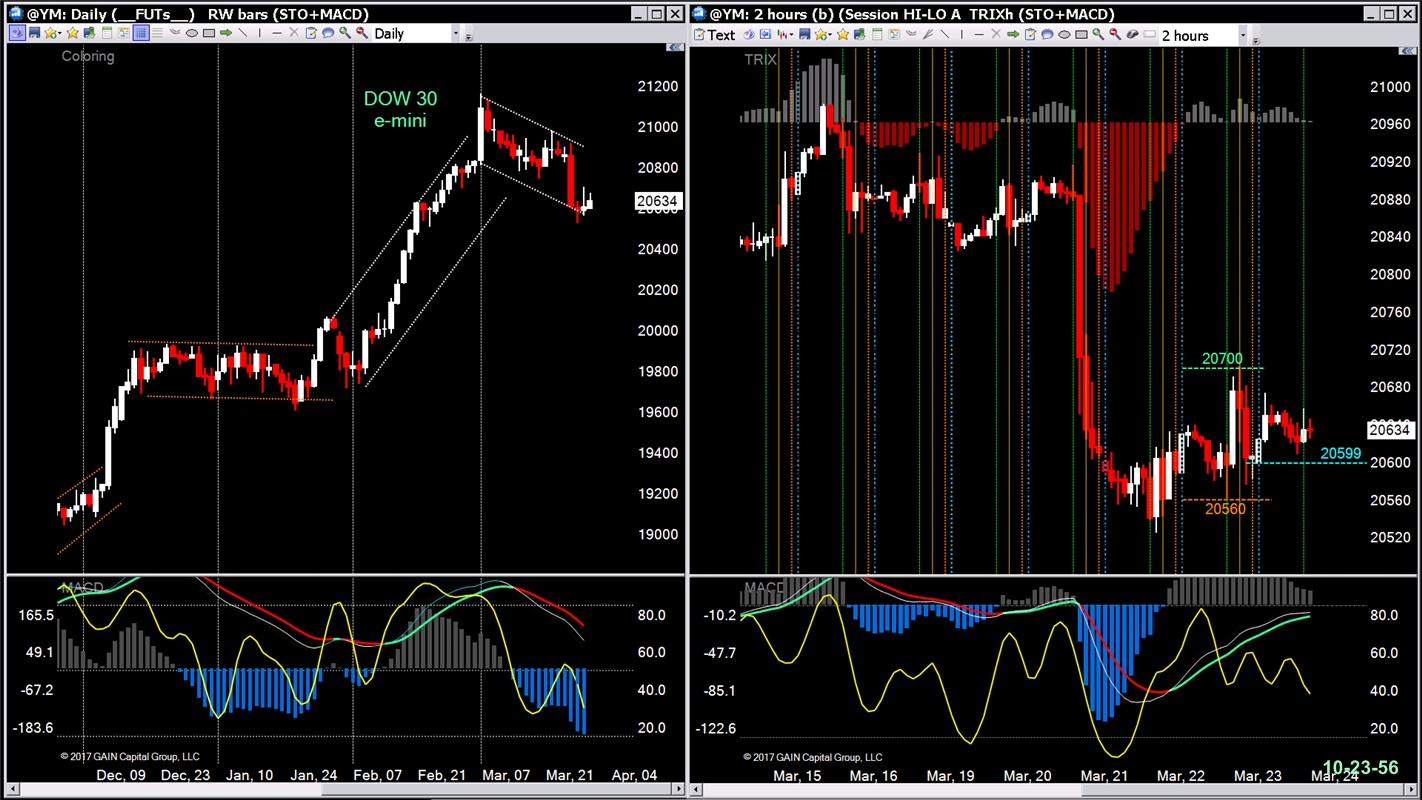
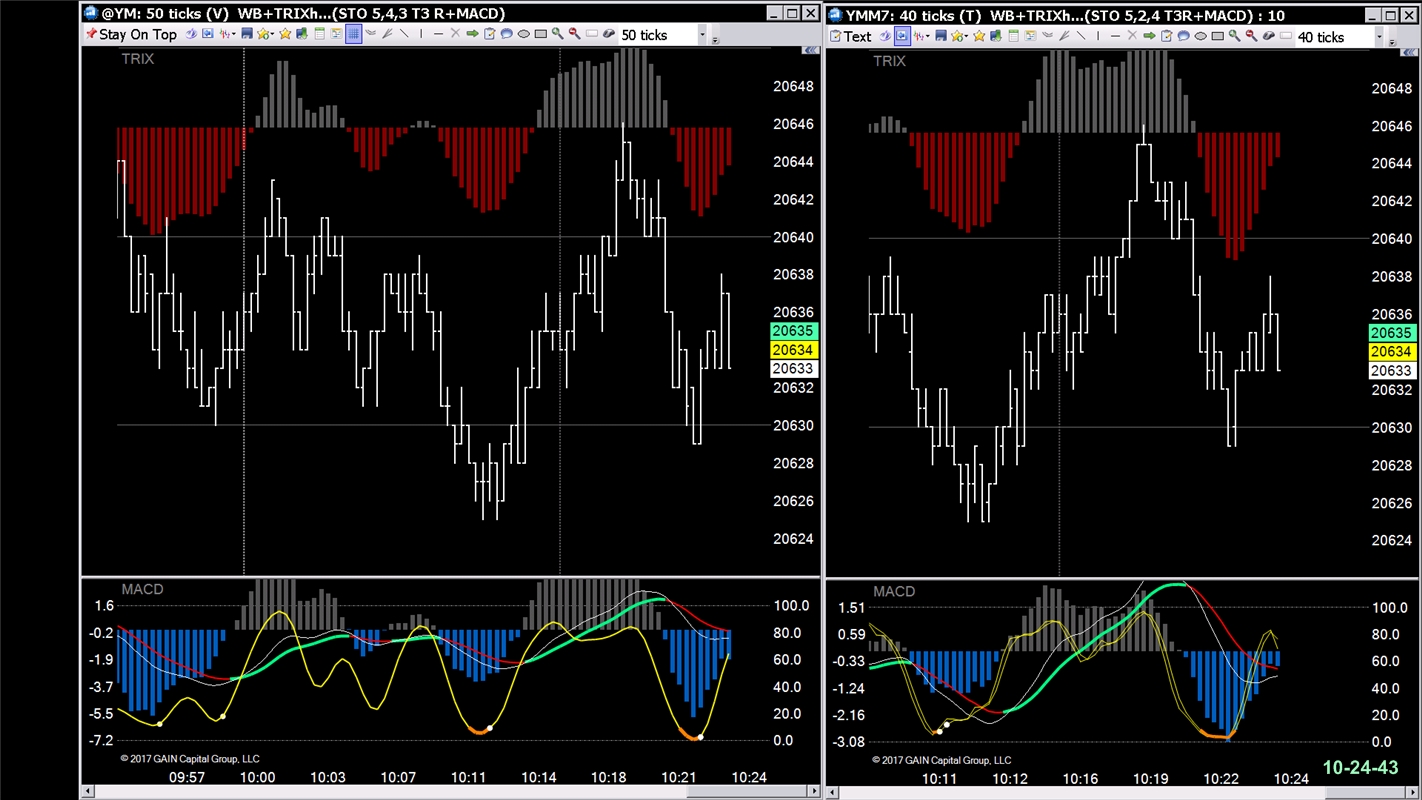
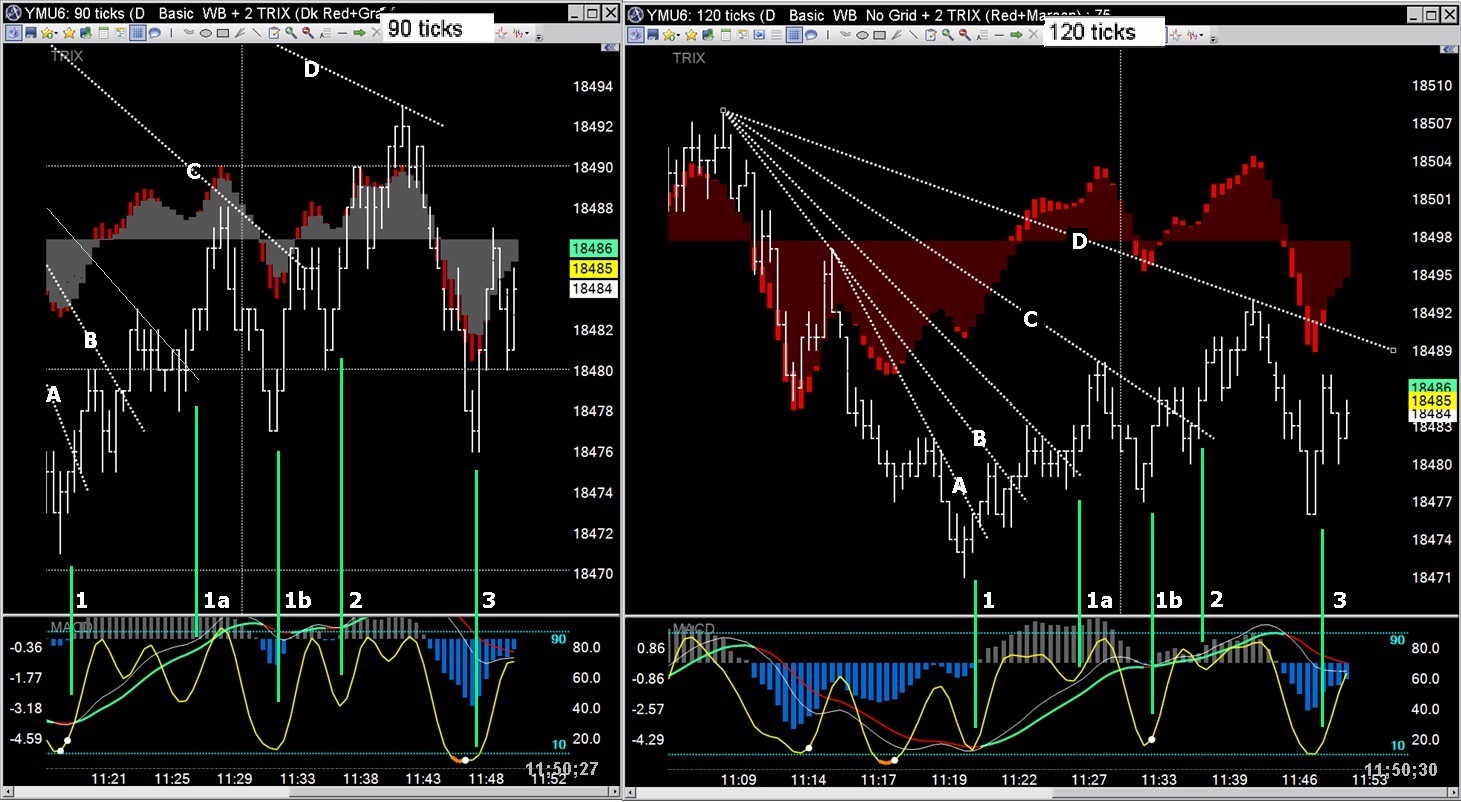
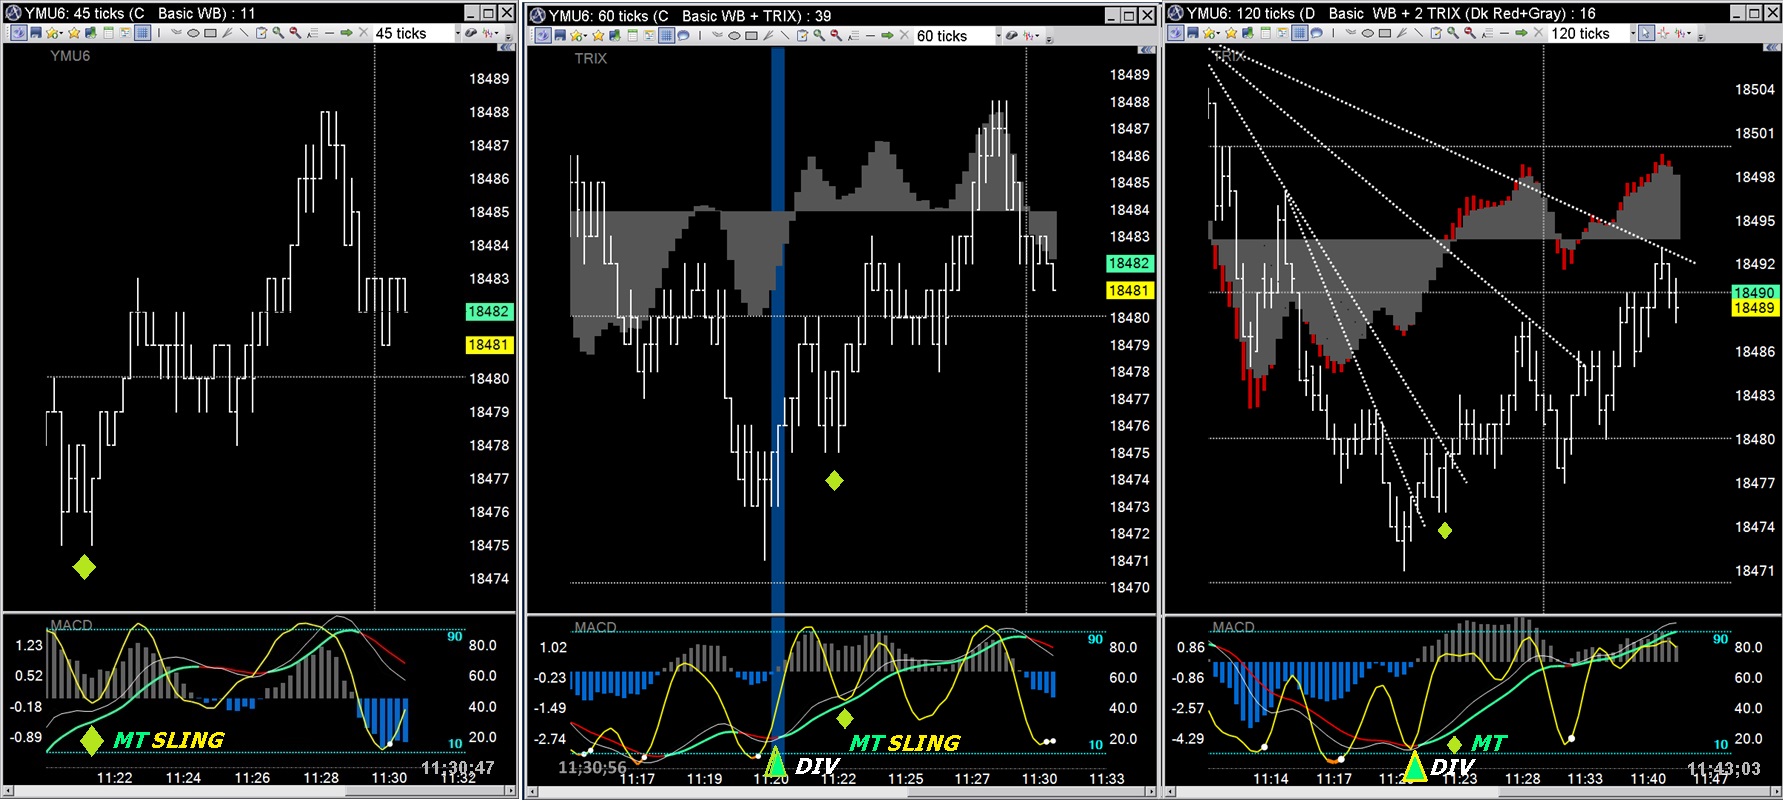
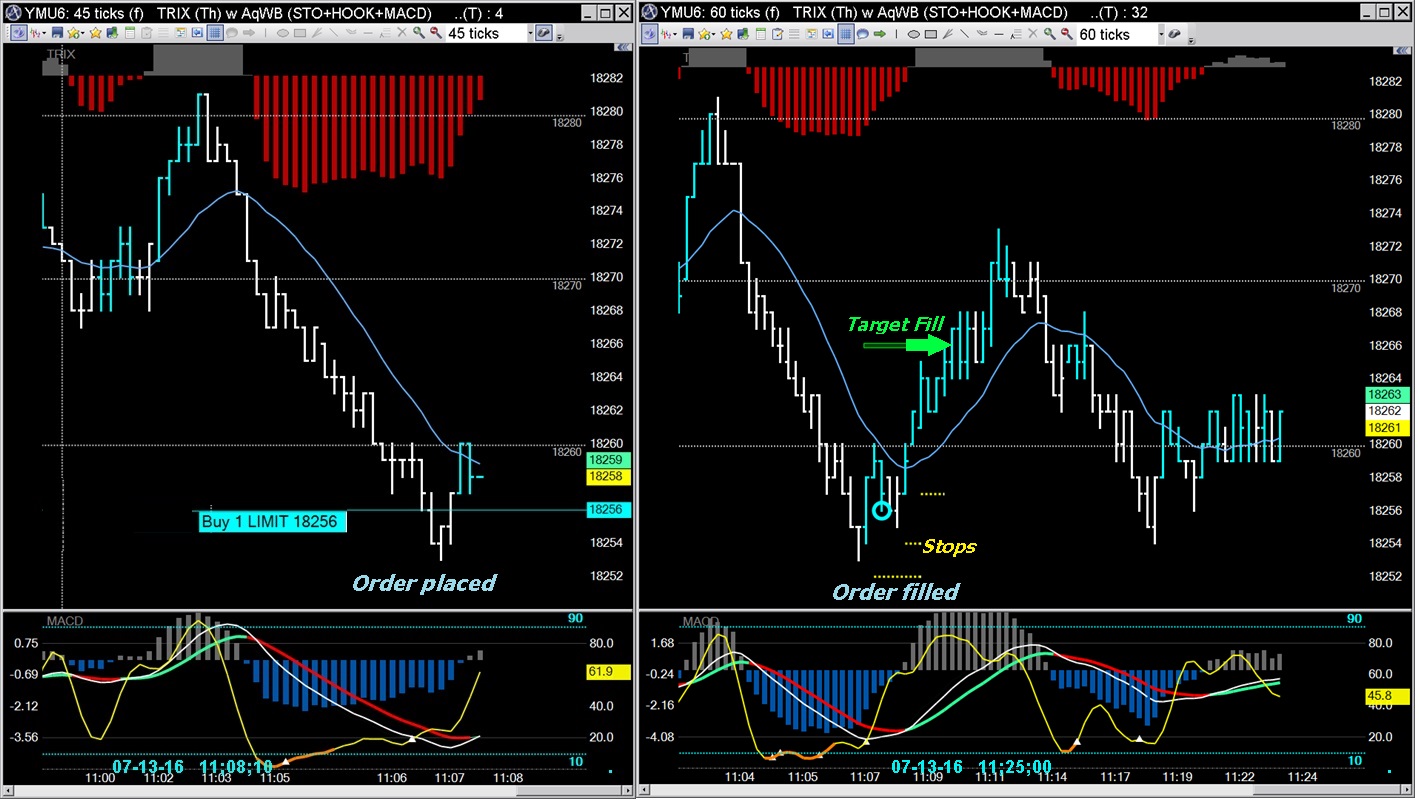
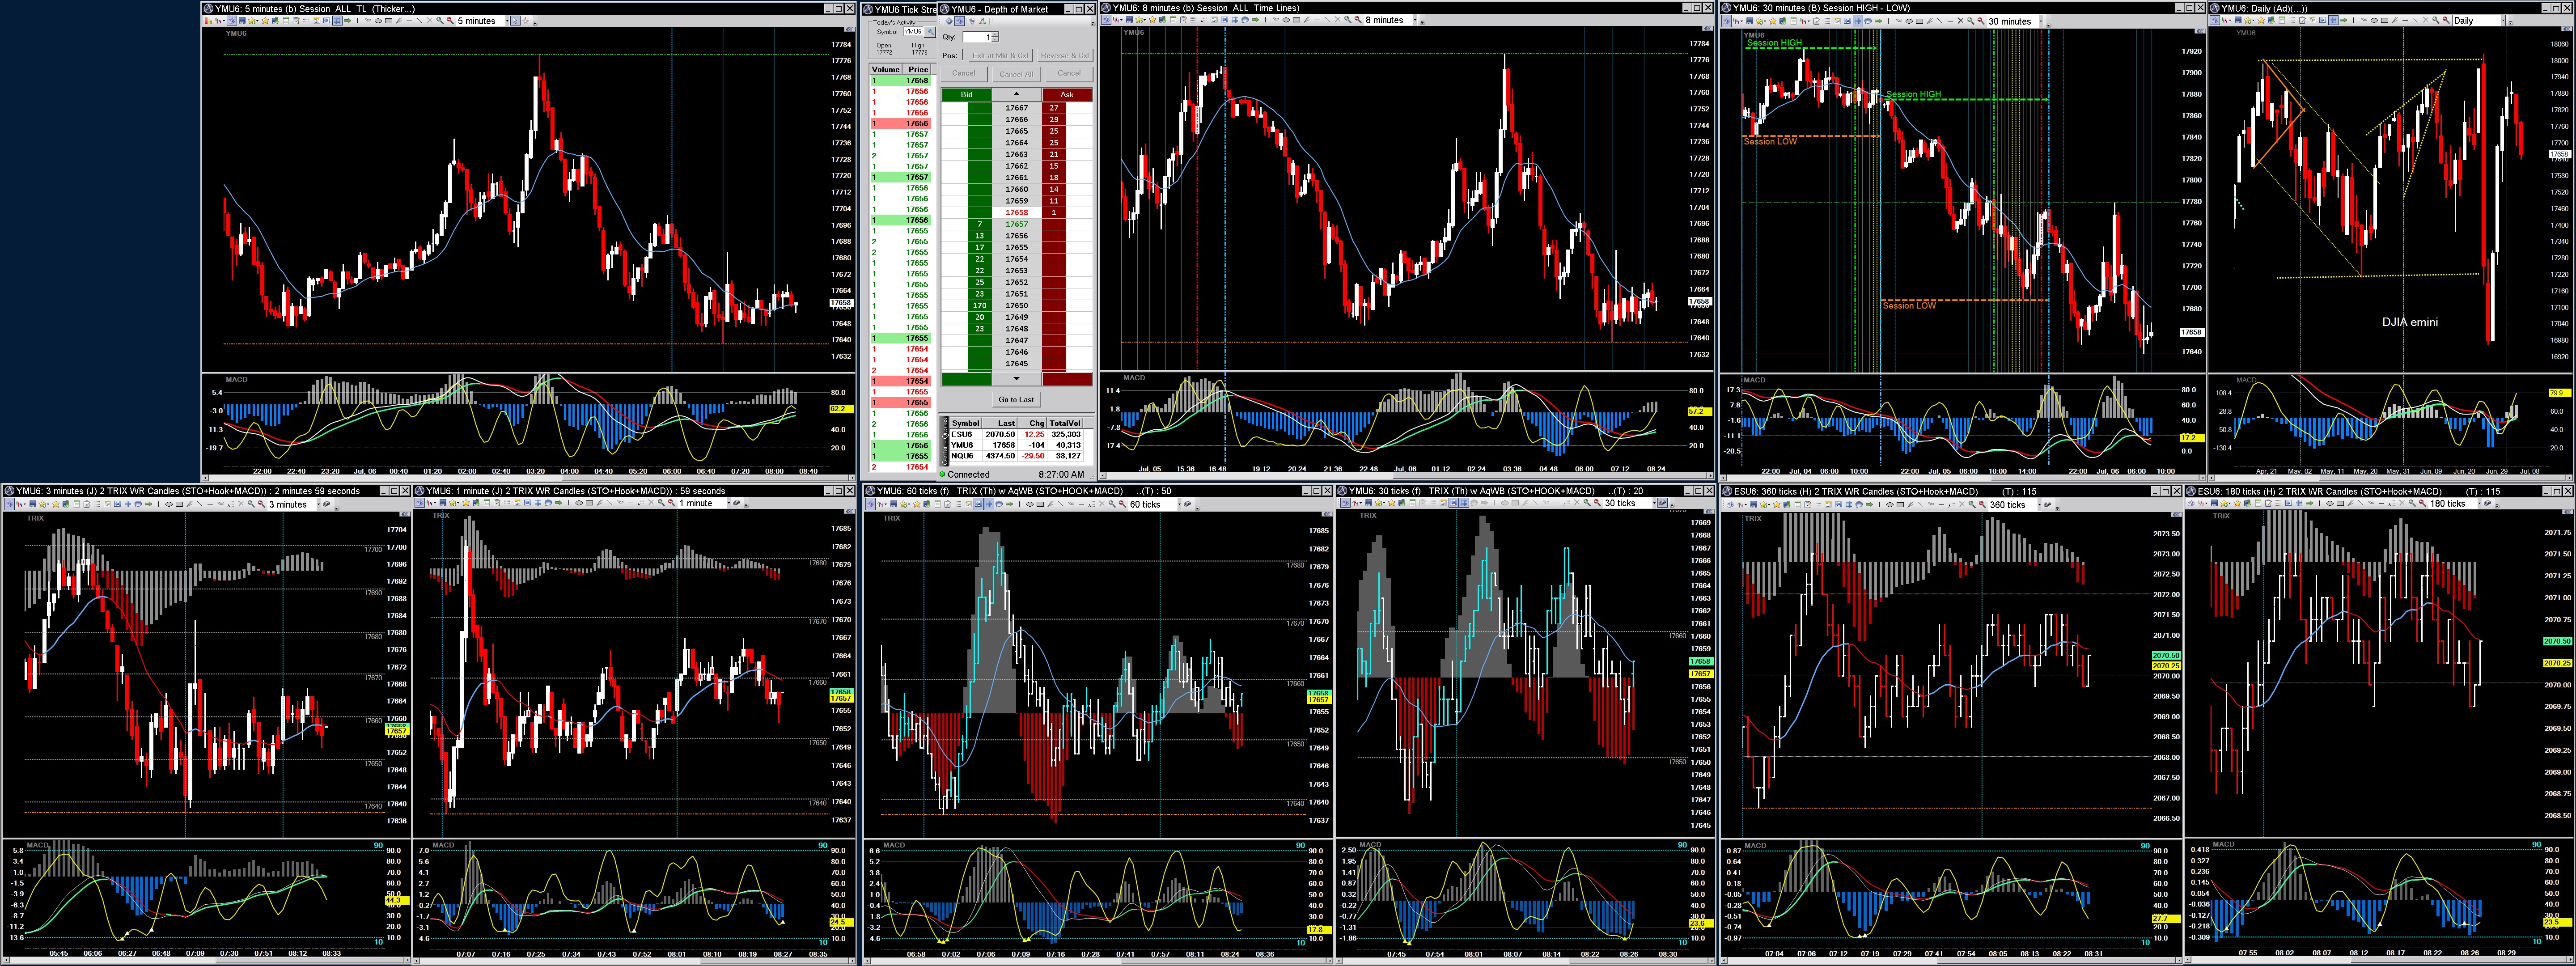
I have observed that price seems to do more oscillating ??????? <link to chart) than trending
even when it can be seen to be moving in one over-all direction for an extended period of time.
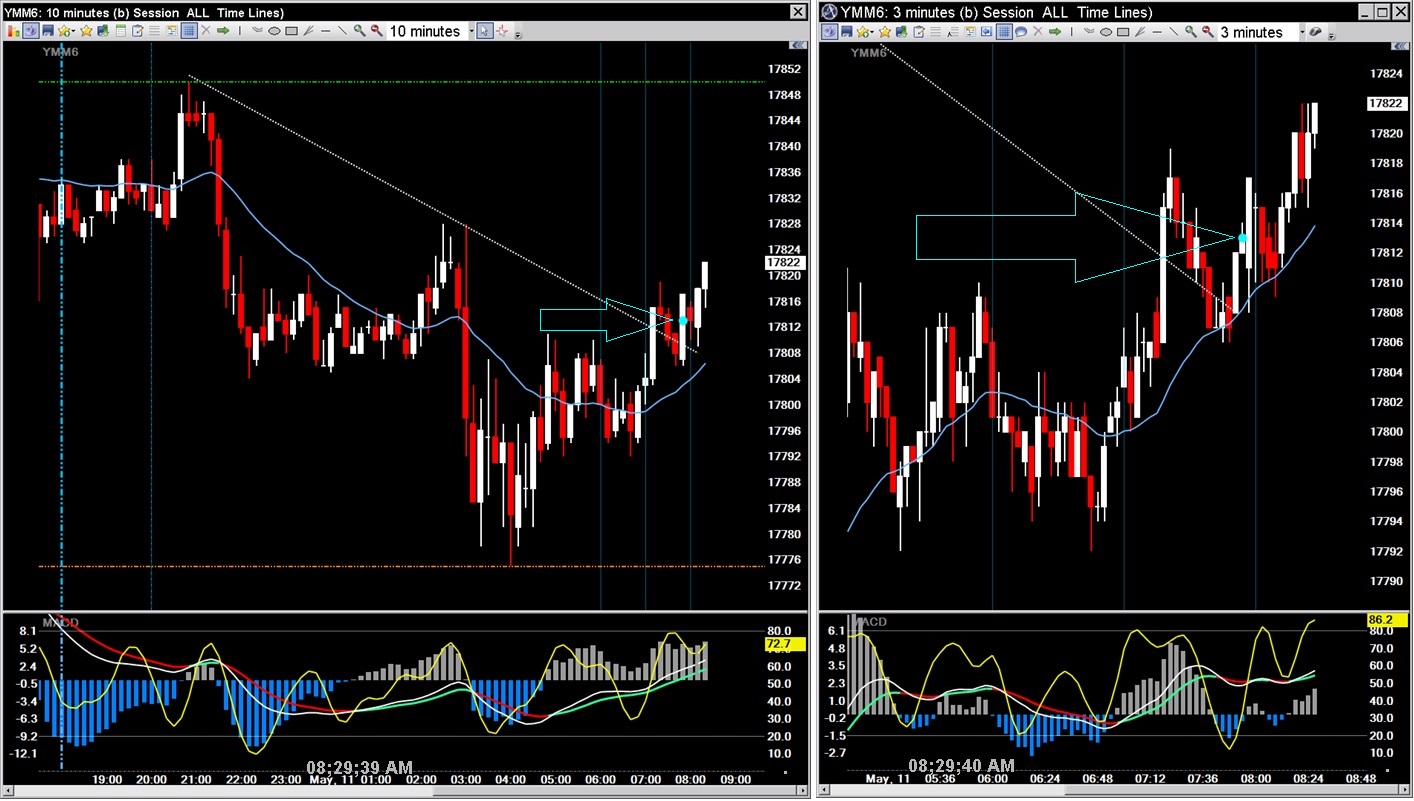
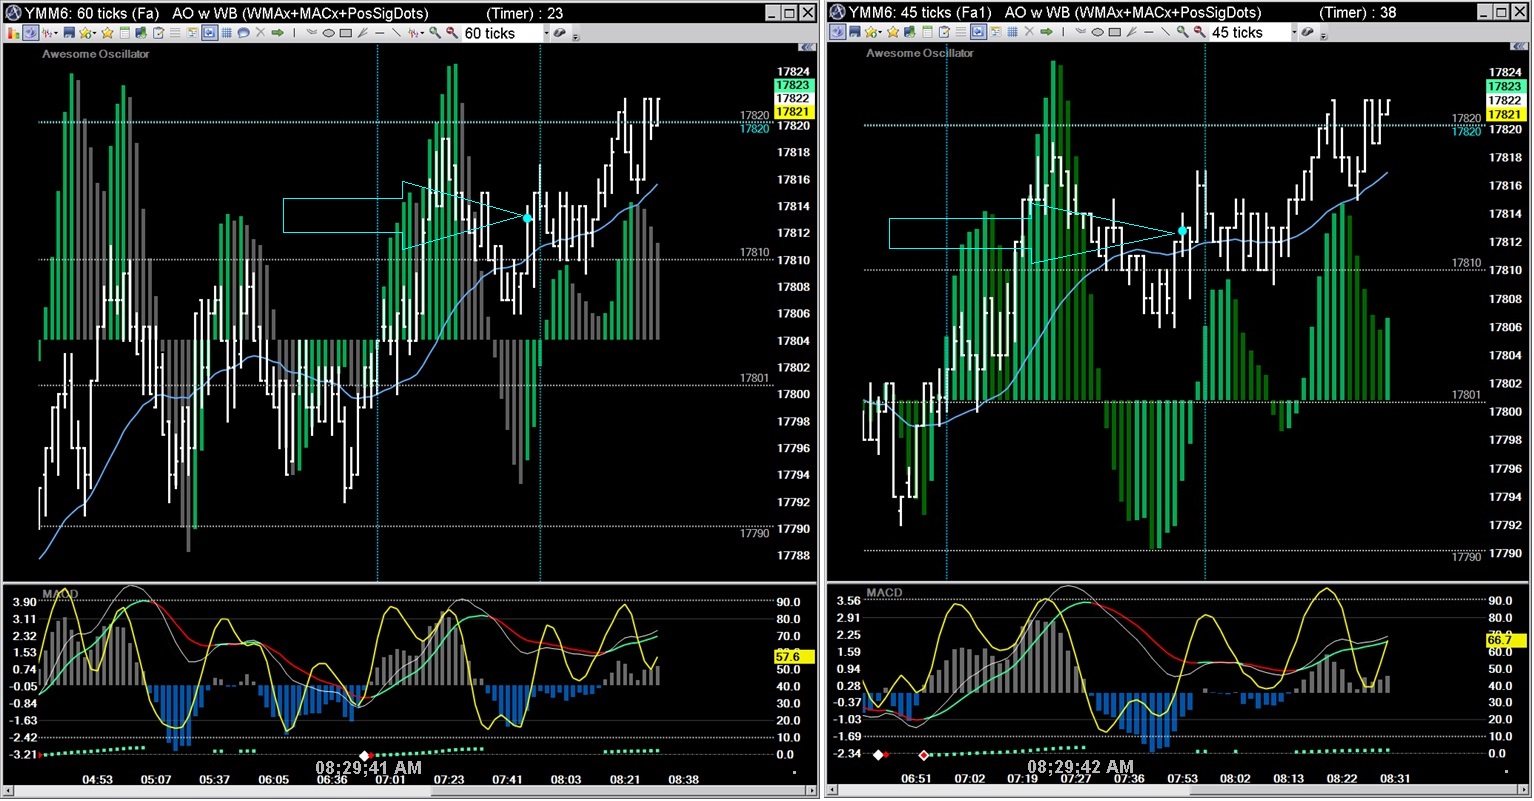
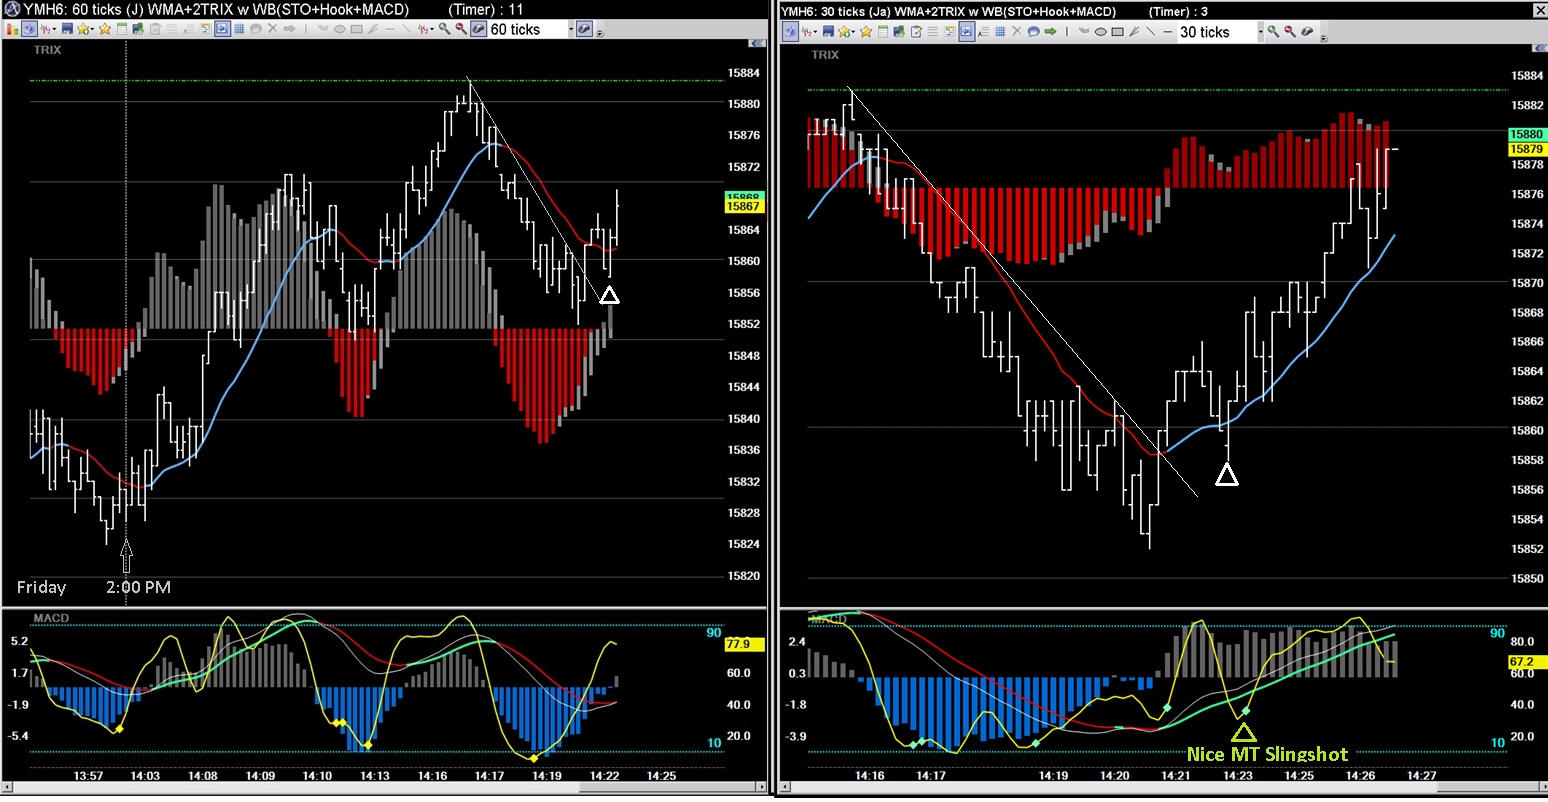
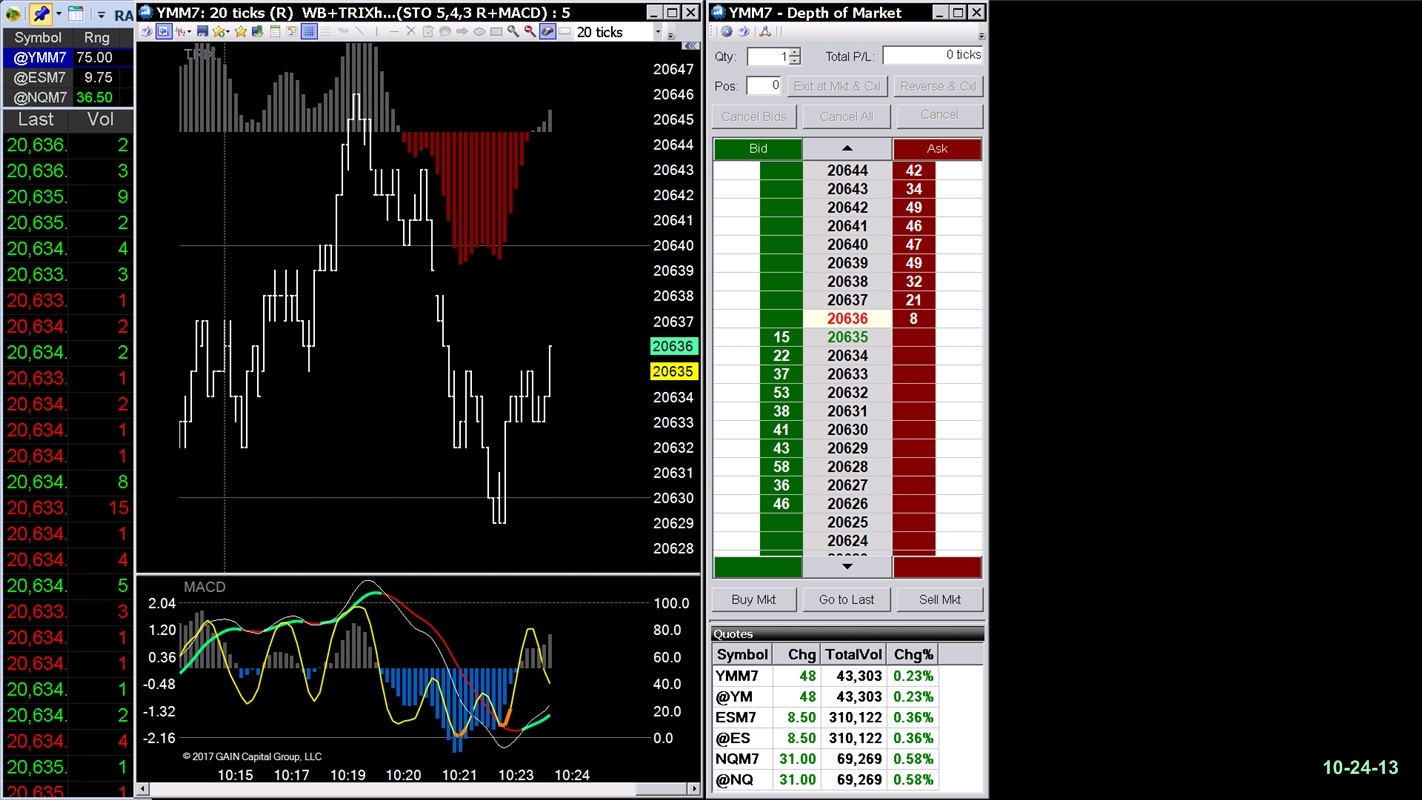
I have developed trade methods to take advantage of these very short term price oscillations.
I trade price action patterns and indicator signals that continually repeat themselves:
All day, Every day and in any market you choose to trade.
These patterns have been printing on charts for as long as charts have existed.
These methods work whether the over-all trend is down or up.
For more in-depth explanations of my methods, visit my iHub profile to find the link
to my free blog (No ads, No sign-ins, No tracking, NO etc.)
Six monitor Trade-Station layout showing multiple time frames
3 month daily and 3 week 4 hour bars (MACD and Stochastic in study)
2 day 30 minutes per bar with other ApexTrader and ASUS computer windows plus the Task Bar
Current full session 15 minute bars and 2 hours 2 minute bars
150 ticks per bar and 90 ticks per bar (TRIX histogram with price...MACD and Stochastic in study)
60 ticks per bar and 45 ticks per bar
35 ticks per bar with Trade Mode enabled with Depth-of-Market and Time&Sales windows
A WAG without confirming patterns or signals is dependent entirely on "feel".
These examples document my thoughts, before and after taking a WAG...
Coming off Friday's trend day UP, Sunday night's opening for Monday's session gapped up and was continuing the bullish trend.
"Coulda" been paying closer attention - I was fixated on the 30 tick T-Mode entry chart...
Even the 60 tick chart which is next to the 30 tick on my layout showed the previous low:
I also didn't notice what the longer term spotter charts were saying:
KISS - Keep it Simple Scalping
Standard Operating Procedure for entering Long position scalps :
Watch multiple Time frames for Signals (Indicator to price Divergences) before Price breaks out above a down trend Line.
These patterns and signals occur in ALL markets and on ALL time frames ...ALL THE TIME.
Followers
|
1
|
Posters
|
|
Posts (Today)
|
0
|
Posts (Total)
|
17
|
Created
|
01/16/16
|
Type
|
Free
|
Moderators |
Volume | |
Day Range: | |
Bid Price | |
Ask Price | |
Last Trade Time: |