


Saturday, March 08, 2014 11:12:16 AM
by Clark March 7, 2014
Now that it appears clear the bottom is in for gold,
it’s time to stop fretting about how low prices
will drop and how long the correction will last and
start looking at how high they’ll go and
when they’ll get there.
When viewing the gold market from a historical perspective,
one thing that’s clear is that the junior mining stocks
tend to fluctuate between extreme boom and bust cycles.
As a group, they’ll double in price, then crash by 75%...
then double or triple or even quadruple again, only to
crash 90%. Boom, bust, repeat.
Given that we just completed a major bust cycle and not
just any bust cycle, but one of the harshest on record,
according to many veteran insiders the setup for a major
rally in gold stocks is right in front of us.
This may sound sensationalistic, but based on past
historical patterns and where we think gold prices are
headed, the odds are high that, on average, gold
producers will trade in the $200 per share range
before the next cycle is over.
With most of them currently trading between $20 and
$40, the returns could be stupendous.
And the percentage returns of the typical junior will
be greater by an order of magnitude, providing
life-changing gains to smart investors.
What you’re about to see are historical returns of both
producers and juniors during three separate boom cycles.
These are factual returns; they are not hypothetical.
And if you accept the fact that this market moves in
cycles, you know it’s about to happen again.
Gold had a spectacular climb in 1979-1980, and gold
stocks in general gave a staggering performance at
that time many of them becoming 10-baggers
(1,000% gains and more).
While this is a well-known fact, few researchers have
bothered to identify exact returns from specific
companies during this era.
Digging up hard data from before the mid-1980s,
especially for the junior explorers, is difficult
because the information wasn’t computerized at the time.
So I sent my nephew Grant to the library to view
the Wall Street Journal on microfiche.
We also include information we’ve had from
Scott Hunter of Haywood Securities; Larry Page,
then president of the Manex Resource Group;
and the dusty archives at the Northern Miner.
Note: This means our tables, while accurate, are not
at all comprehensive.
Let’s get started…
The Quintessential Bull Market: 1979-1980
The granddaddy of gold bull cycles occurred during the
1970s, culminating in an unabashed mania in 1979 and 1980.
Gold peaked at $850 an ounce on January 21, 1980, a rise
of 276% from the beginning of 1979.
(Yes, the price of gold on the last trading day of 1978
was a mere $226 an ounce.)
Here’s a sampling of gold producer stock prices from
this era.
What you’ll notice in addition to the amazing returns
is that gold stocks didn’t peak until nine months
after gold did.

Keep in mind, though, that our data measures the exact
top of each company’s price.
Most investors, of course, don’t sell at the very peak.
If we were to able to grab, say, 80% of the climb,
that’s still a return of 231.6%.
Here’s a sampling of how some successful junior gold
stocks performed in the same period, along with the
month each of them peaked.
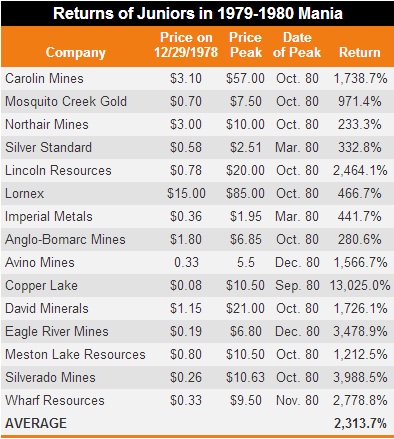
If you had bought a reasonably diversified portfolio
of top performing gold juniors prior to 1979, your
initial investment could have grown 23 times in just
two years.
If you had managed to grab 80% of that move, your
gains would still have been over 1,850%.
This means a junior priced at $0.50 today that
captured the average gain from this boom would sell
for $12 at the top, or $9.75 at 80%.
If you own ten juniors, imagine just one of them
matching Copper Lake’s better than 100-bagger
performance.
Here’s what returns of this magnitude could mean to you.
Let’s say your portfolio includes $10,000 in gold
juniors that yield spectacular gains such as the above.
If the next boom cycle matches the 1979-1980 pattern,
your portfolio could be worth $241,370 at its peak…
or about $195,000 if you exit at 80% of the top prices.
You have to play the cycle.
Returns from that era have been written about before,
so I can hear some investors saying,
“Yeah, but that only happened once.”
Au contraire. Read on…
The Hemlo Rally of 1981-1983
Many investors don’t know that there have been several
bull cycles in gold and gold stocks since
the 1979-1980 period.
Ironically, gold was flat during the two years of
the Hemlo rally.
But something else ignited a bull market.Discovery.
Here’s how it happened…
Back in the day, most exploration was done by teams
from the major producers.
But because of lagging gold prices and the resulting
need to cut overhead, they began to slash their
exploration budgets, unleashing a swarm of experienced
geologists armed with the knowledge of high-potential
mineral targets they’d explored while working
for the majors.
Many formed their own companies and
went after these targets.
This led to a series of spectacular discoveries,
the first of which occurred in mid-1982, when
Golden Sceptre and Goliath Gold discovered
the Golden Giant deposit in the Hemlo area of
eastern Canada.
Gold prices rallied that summer, setting off a
mini bull market that lasted until
the following May.
The public got involved, and as you can see,
the results were impressive for such a short
period of time.
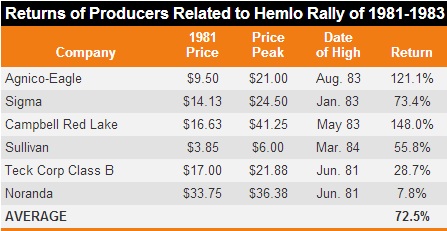
Gold producers, on average, returned over 70% on
investors’ money during this period.
While these aren’t the same spectacular gains from
just a few years earlier, keep in mind they occurred
over only about 12 months’ time. This would be akin
to a $20 gold stock soaring to $34.50 by this time
next year, just because it’s located in a
significant discovery area.
Once again, it was the juniors that brought the
dazzling returns.
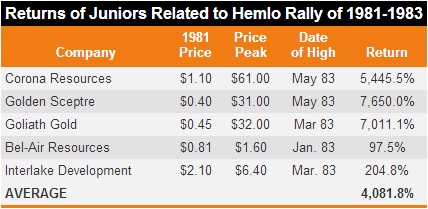
The average return for these junior gold stocks that
had a direct interest in the Hemlo area exceeded
a whopping 4,000%.
This is especially impressive when you realize that
it occurred without the gold stock industry as a
whole participating.
This tells us that a big discovery can lead to
enormous gains, even if the industry as
a whole is flat.
In other words, we have historical precedence that
humongous returns are possible without a mania,
by owning stocks with direct exposure to
a discovery area.
By May 1983, roughly a year after it started, gold
prices started back down again, spelling the end
of that cycle—another reminder that one must sell
to realize a profit.
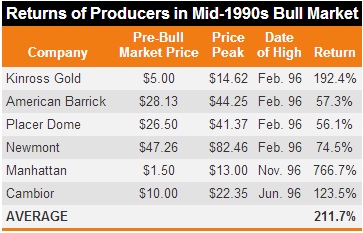
The Roaring ’90s
By the time the ’90s rolled around, many junior
exploration companies had acquired the
“intellectual capital” they needed from the majors.
Another series of gold discoveries in the mid-1990s
set off one of the most stunning bull markets
in the current generation.
By the summer of ’96, these discoveries had sparked
another bull cycle, and companies with little more
than a few drill holes were selling for $20 a share.
The table below, which includes some of the better
known names of the day, is worth the proverbial
thousand words.
The average producer more than tripled investors’
money during this period.
Once again, these gains occurred in a relatively
short period of time, in this case inside
of two years.
Here’s how some of the juniors performed.
And if you’re the kind of investor with the courage
to buy low and the discipline to sell during a frenzy,
it can be worth a million dollars.
Hold on to your hat.
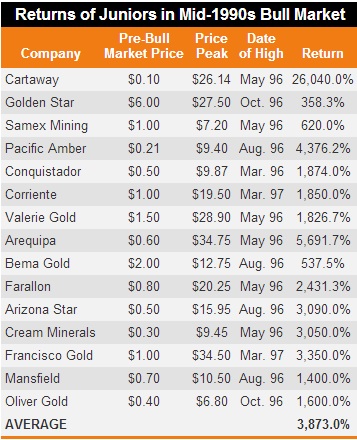
Many analysts refer to the 1970s bull market as the
granddaddy of them all—and to a certain extent it
was but you’ll notice that the average return of
these stocks during the late ’90s bull exceeds what
the juniors did in the 1979-1980 boom.
This is akin to that $0.50 junior stock today reaching
$19.86… or $16, if you snag 80% of the move.
A $10,000 portfolio with similar returns would grow
to over $397,000 (or over $319,000 on 80%).
Gold Stocks and Depression
Those of you in the deflation camp may dismiss all
this because you’re convinced the Great Deflation
is ahead.
Fair enough. But you’d be wrong to assume gold stocks
can’t do well in that environment.
Take a look at the returns of the two largest
producers in the US and Canada, respectively,
during the Great Depression of the 1930s,
a period that saw significant price deflation.
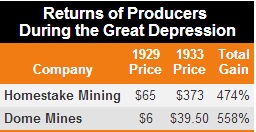
During a period of soup lines, crashing stock
markets, and a fixed gold price, large gold
producers handed investors five and six times
their money in four years.
If deflation “wins,” we still think gold equity
investors can, too.
How to Capitalize on This Cycle
History shows that precious metals stocks move
in cycles.
We’ve now completed a major bust cycle and,
we believe, are on the cusp of a tremendous boom.
The only way to make the kind of money outlined
above is to buy before the boom is in full swing.
That’s now. For most readers, this is literally
a once-in-a-lifetime opportunity.
As you can see above, there can be great variation
among the returns of the companies.
That’s why, even if you believe we’re destined for
an “all-boats-rise” scenario, you still want
to own the better companies.
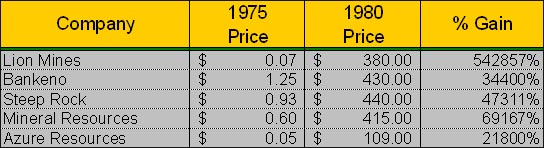
What if you invest in 'Caledonia Mining Corporation
and it become a LION -
ex. in 1975?..
take a look at the past gains in a few juniors:
$GOLD INDX Chart TA TI P&F Alert Bullish Price Objective $2,040.0 / oz
CAL Chart TA TI P&F Alert Bullish Price Objective $3.63 / oz
Caledonia Mining Corp. -
CALVF:NASDAQ - TSE:CAL - CMCL Aim London -
Ex.
Let's focus on what more makes CAL a better buy than almost
any other gold stock out there -
ex...a few...
Caledonia Blanket Gold Mines enjoy Zimland corp. taxes
are 25% and its only
about half of US & Can bolshevistic 50% taxes +
Blanket Gold Mines have much less than half of
the high labour cost in US & Can.
Note.
all producers on the list have higher gold prod. cost than
Caledonia Mining's low prod. cost @ $554/oz -
CAL paying a dividend every quarter to the shareholders -
Fyi. do a dd...for a low cost gold mines producer with
very low labour cost and taxes....
Caledonia Mining Corp. -
CALVF:NASDAQ - TSE:CAL - CMCL Aim London -

CAL Blanket Gold Mines enjoy “Cash costs $554/oz at
the Gold mine are running
at $554/oz - one of the lowest cost -
gold producers in the world -
which positions the CAL company well to keep
generating cash to self-fund expansion and
CAL paying dividends every quarter to shareholders -
CAL has more than $25 million in cash in
Western London banks and NO DEBT -
http://www.commodity-tv.net/c/mid,21943,Mines_und_Money_London_2013/?v=252888
http://www.brrmedia.co.uk/event/119251/
http://investorshub.advfn.com/boards/read_msg.aspx?message_id=95869580
CAL / CALVF employ more than 1000 happy miners -
who got 15% ownership in Blanket Gold Mines -
the miners work very good for they work
for them self -
ex...Zimland corp. taxes are 25% and its only
about half of US & Can bolshevistic 50% taxes +
Blanket Gold Mines have less than half of
the high labour cost in US & Can. -
CAL Blanket Gold Mines enjoy the kind best mining
weather and it has produced gold since 2000yrs back -
Kingdoms of Africa - Great Zimbabwe -
http://www.youtube.com/watch?v=AyKrTdv-t4E
http://investorshub.advfn.com/boards/read_msg.aspx?message_id=96263045
The ruins of Great Zimbabwe – the capital of the Queen of Sheba -
http://investorshub.advfn.com/boards/read_msg.aspx?message_id=67548731
Au-Kingdom -
E.g.,
http://whc.unesco.org/en/list/364/video
http://investorshub.advfn.com/boards/read_msg.aspx?message_id=96354613
http://investorshub.advfn.com/boards/read_msg.aspx?message_id=97759402
God Bless

My opinions are my own and and DD I post should be confirmed as unbiased
Recent CMCL News
- Form EFFECT - Notice of Effectiveness • Edgar (US Regulatory) • 08/23/2024 04:15:07 AM
- Form 6-K - Report of foreign issuer [Rules 13a-16 and 15d-16] • Edgar (US Regulatory) • 08/19/2024 10:00:07 AM
- Form 6-K - Report of foreign issuer [Rules 13a-16 and 15d-16] • Edgar (US Regulatory) • 08/19/2024 10:00:06 AM
- Caledonia Mining Corporation Plc: Notification of relevant change to significant shareholder • GlobeNewswire Inc. • 08/19/2024 06:00:00 AM
- Caledonia Mining Corporation Plc: Notification of relevant change to significant shareholder • GlobeNewswire Inc. • 08/19/2024 06:00:00 AM
- Form 6-K - Report of foreign issuer [Rules 13a-16 and 15d-16] • Edgar (US Regulatory) • 08/15/2024 10:00:11 AM
- Caledonia Mining Corporation Plc: Notification of relevant change to significant shareholder • GlobeNewswire Inc. • 08/15/2024 06:00:00 AM
- Form 6-K - Report of foreign issuer [Rules 13a-16 and 15d-16] • Edgar (US Regulatory) • 08/12/2024 03:32:56 PM
- Form 6-K - Report of foreign issuer [Rules 13a-16 and 15d-16] • Edgar (US Regulatory) • 08/12/2024 10:00:08 AM
- Caledonia Mining Corporation Plc Results for the Quarter ended June 30, 2024; Details of Investor Presentation • GlobeNewswire Inc. • 08/12/2024 06:00:00 AM
- Form F-3 - Registration statement by foreign private issuers • Edgar (US Regulatory) • 08/09/2024 08:12:39 PM
- Form 6-K - Report of foreign issuer [Rules 13a-16 and 15d-16] • Edgar (US Regulatory) • 08/06/2024 10:00:05 AM
- Caledonia Mining Corporation Plc: Notice of Results and Investor Presentation • GlobeNewswire Inc. • 08/06/2024 06:00:00 AM
- Caledonia Mining Corporation Plc: Publication of 2023 ESG Report • GlobeNewswire Inc. • 08/01/2024 06:00:00 AM
- Form 6-K - Report of foreign issuer [Rules 13a-16 and 15d-16] • Edgar (US Regulatory) • 07/25/2024 10:00:11 AM
- Caledonia Mining Corporation Plc: Notification of relevant change to significant shareholder • GlobeNewswire Inc. • 07/25/2024 06:00:00 AM
- Form 6-K - Report of foreign issuer [Rules 13a-16 and 15d-16] • Edgar (US Regulatory) • 07/23/2024 10:00:13 AM
- Caledonia Mining Corporation Plc: Notification of relevant change to significant shareholder • GlobeNewswire Inc. • 07/23/2024 06:00:00 AM
- Form 6-K - Report of foreign issuer [Rules 13a-16 and 15d-16] • Edgar (US Regulatory) • 07/22/2024 10:00:12 AM
- Caledonia Mining Corporation Plc: Notification of relevant change to significant shareholder • GlobeNewswire Inc. • 07/22/2024 06:00:00 AM
- Form 6-K - Report of foreign issuer [Rules 13a-16 and 15d-16] • Edgar (US Regulatory) • 07/19/2024 10:00:09 AM
- Caledonia Mining Corporation Plc: Notification of relevant change to significant shareholder • GlobeNewswire Inc. • 07/19/2024 06:00:00 AM
- Form 6-K - Report of foreign issuer [Rules 13a-16 and 15d-16] • Edgar (US Regulatory) • 07/15/2024 05:50:06 PM
- Caledonia Mining Corporation Plc: Notification of relevant change to significant shareholder • GlobeNewswire Inc. • 07/15/2024 06:00:00 AM
- Form 6-K - Report of foreign issuer [Rules 13a-16 and 15d-16] • Edgar (US Regulatory) • 07/12/2024 10:00:12 AM
FEATURED Integrated Ventures Acquires 51% Stake In GetTrim.Com (TM), Telemedicine Platform With Focus On Expansion Into Booming GLP-1 Powered Weight Loss Market • Sep 4, 2024 8:45 AM
Avant Technologies Announces Strategic Review Process Intended to Maximize Shareholder Value • AVAI • Sep 4, 2024 8:00 AM
PickleJar Launches National "Get on the Bus" Campaign, Unveils Thompson Square Tour Bus Wrap • PKLE • Sep 4, 2024 7:17 AM
Maybacks Global and Inventel Products To Launch Global 24 Hour Shopping Channel • AHRO • Sep 3, 2024 9:15 AM
UC Asset announces plan of management stock buyback • UCASU • Sep 3, 2024 9:00 AM
Element79 Gold Corp Appoints Warren Levy to Board of Directors • ELMGF • Aug 28, 2024 9:51 AM

