


Wednesday, February 26, 2014 10:40:46 AM
Pretzel update:
http://www.pretzelcharts.com/
"On Tuesday, the S&P 500 (SPX) made a new high -- and I'd promised if that happened that I would eat crow. Turns out they're actually not too terrible if you use a lot of hot sauce. While munching, I was prompted to look into the metaphor, and found this on Wikipedia:
Crow is presumably foul-tasting in the same way that being proved wrong might be emotionally hard to swallow. The exact origin of the idiom is unknown, but it probably began with an American story published around 1850 about a slow-witted New York farmer.
This then prompted me to look up something I wrote to the traders on my forum, back on January 29:
This is the crummy thing about this wave -- SPX probably counts best as an expanded flat off 1849... so now we'll get an impulsive decline in the C-wave down, and all us Elliott Wave guys will probably have to favor another leg down. Then it will never come, and we'll be left holding the bag again.
So, given the fact that I felt SPX counted best as an expanded flat, one might wonder why I didn't favor the expanded flat (which suggested new highs) to begin with; perhaps, subconsciously, I've always wanted to try crow? I'll be addressing this one internally for a while, as it seems like maybe I wanted to prove myself right about being wrong. There's a broader lesson here about life in general and trading specifically, and I suspect all of us do this to ourselves at times -- but I'll leave it to the reader to figure it out beyond that.
At this point, of course, the objective is to move forward with the market. After a mistake, I believe our goal is to define the mistake, as opposed to letting the mistake define us. In this case, my mistake came by ignoring the wave count which I felt was objectively the best (the expanded flat) in favor of the wave count in which I became emotionally invested. My apologies to readers for this. To a large degree, I'd become trapped by my prior analysis and public statements, so the upshot is that the market has freed me from that (if you've never published a widely-read public analysis, you probably haven't given much thought to the weight, pressure, and sense of responsibility that comes with it.)
(And for a lot more thoughts on the psychology of overcoming mistakes, please see: 3 Common Psychological Mistakes Traders Make, and How to Overcome Them)
So -- let's look at the charts with fresh eyes and see what we come away with.
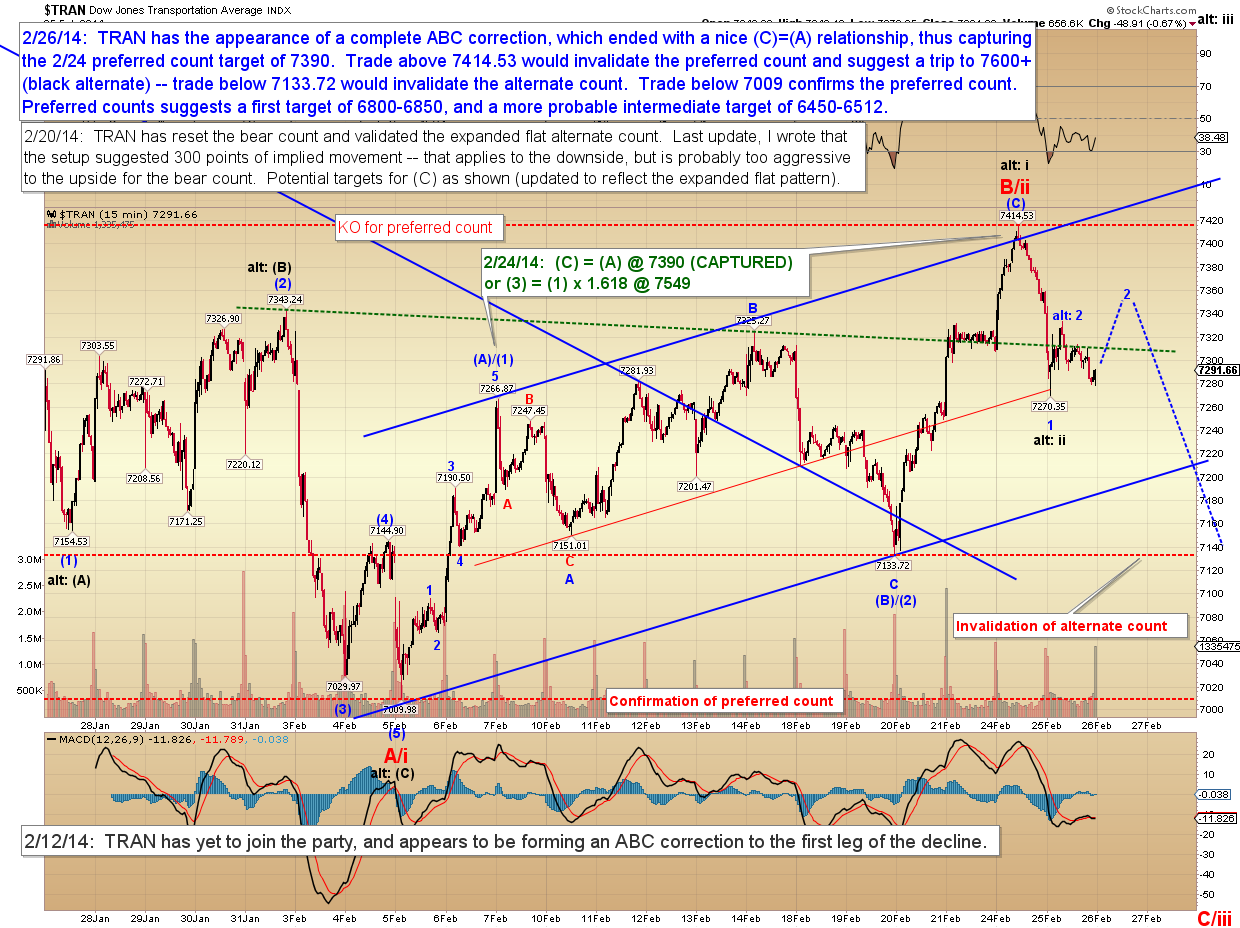
First off, the Dow Transportation Average (TRAN) has actually tracked quite well with February's projections, and appears to have completed the anticipated ABC correction within a few points of the target. The best feature about TRAN is the wave structure has clear levels, which should help define some of the more ambiguous structures currently seen in other equities markets."
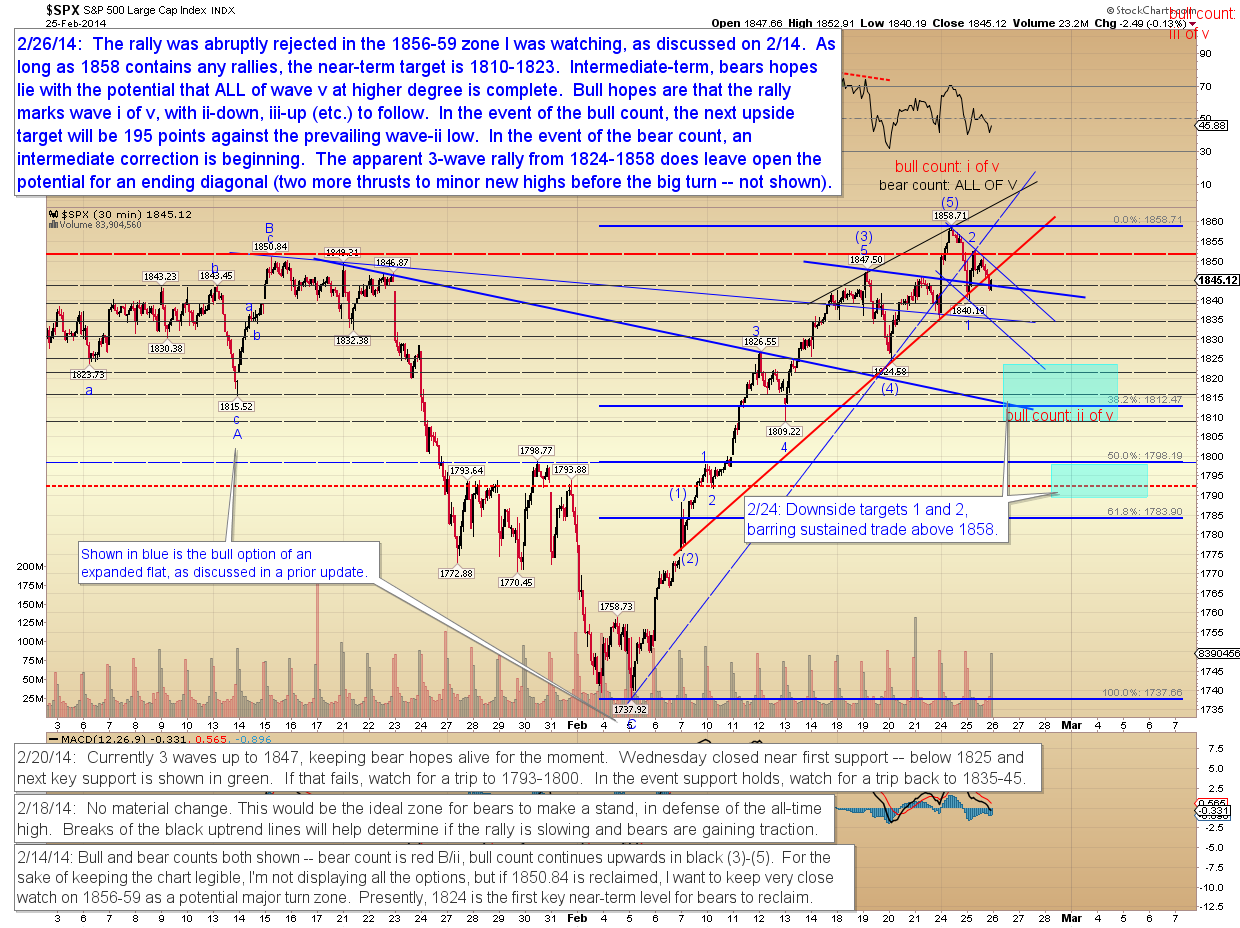
"SPX broke the all-time high, then turned within the 3-point zone that I felt would be an important inflection point. Near-term, I expect a trip toward the noted targets -- of course, bearish bets are off in the event of sustained trade above 1859."
"The reality is that every form of market analysis is merely an attempt to assign probability. There is no certainty and no absolute perfection. My goal with these updates is to try and narrow down the market to the top two probabilities (the preferred and alternate counts), then to try and locate the inflection points and levels which appear key to those counts.
For the intermediate term, there are two main options heading forward:
1. If the rally marks all of wave (5), then we're in for a prolonged correction.
2. While I've been talking about topping signals for the past few updates, we do have to give consideration to the potential that the topping signals may be short-term. In that event, the rally is only wave i of a subdividing wave (5) -- which would make the (assumed pending) decline a second wave, and yet another BTFD ("Buy the Fargin' Dip") opportunity.
At this exact moment, I don't have much of a preference between the two counts, and will simply have to see how related markets perform (yen currency crosses and U.S. bonds, for example), along with the structure of the next decline, to begin assigning higher probability to one of those options."
"In conclusion, bears appear have the ball for the near term -- and TRAN appears to be providing the clearest near-term structure at the moment. I thus believe that chart is important to monitor for clues during the coming sessions. Trade safe."
Follow me on Twitter while I try to figure out exactly how to make practical use of Twitter:
@PretzelLogic
http://www.pretzelcharts.com/
"On Tuesday, the S&P 500 (SPX) made a new high -- and I'd promised if that happened that I would eat crow. Turns out they're actually not too terrible if you use a lot of hot sauce. While munching, I was prompted to look into the metaphor, and found this on Wikipedia:
Crow is presumably foul-tasting in the same way that being proved wrong might be emotionally hard to swallow. The exact origin of the idiom is unknown, but it probably began with an American story published around 1850 about a slow-witted New York farmer.
This then prompted me to look up something I wrote to the traders on my forum, back on January 29:
This is the crummy thing about this wave -- SPX probably counts best as an expanded flat off 1849... so now we'll get an impulsive decline in the C-wave down, and all us Elliott Wave guys will probably have to favor another leg down. Then it will never come, and we'll be left holding the bag again.
So, given the fact that I felt SPX counted best as an expanded flat, one might wonder why I didn't favor the expanded flat (which suggested new highs) to begin with; perhaps, subconsciously, I've always wanted to try crow? I'll be addressing this one internally for a while, as it seems like maybe I wanted to prove myself right about being wrong. There's a broader lesson here about life in general and trading specifically, and I suspect all of us do this to ourselves at times -- but I'll leave it to the reader to figure it out beyond that.
At this point, of course, the objective is to move forward with the market. After a mistake, I believe our goal is to define the mistake, as opposed to letting the mistake define us. In this case, my mistake came by ignoring the wave count which I felt was objectively the best (the expanded flat) in favor of the wave count in which I became emotionally invested. My apologies to readers for this. To a large degree, I'd become trapped by my prior analysis and public statements, so the upshot is that the market has freed me from that (if you've never published a widely-read public analysis, you probably haven't given much thought to the weight, pressure, and sense of responsibility that comes with it.)
(And for a lot more thoughts on the psychology of overcoming mistakes, please see: 3 Common Psychological Mistakes Traders Make, and How to Overcome Them)
So -- let's look at the charts with fresh eyes and see what we come away with.
First off, the Dow Transportation Average (TRAN) has actually tracked quite well with February's projections, and appears to have completed the anticipated ABC correction within a few points of the target. The best feature about TRAN is the wave structure has clear levels, which should help define some of the more ambiguous structures currently seen in other equities markets."

"SPX broke the all-time high, then turned within the 3-point zone that I felt would be an important inflection point. Near-term, I expect a trip toward the noted targets -- of course, bearish bets are off in the event of sustained trade above 1859."

"The reality is that every form of market analysis is merely an attempt to assign probability. There is no certainty and no absolute perfection. My goal with these updates is to try and narrow down the market to the top two probabilities (the preferred and alternate counts), then to try and locate the inflection points and levels which appear key to those counts.
For the intermediate term, there are two main options heading forward:
1. If the rally marks all of wave (5), then we're in for a prolonged correction.
2. While I've been talking about topping signals for the past few updates, we do have to give consideration to the potential that the topping signals may be short-term. In that event, the rally is only wave i of a subdividing wave (5) -- which would make the (assumed pending) decline a second wave, and yet another BTFD ("Buy the Fargin' Dip") opportunity.
At this exact moment, I don't have much of a preference between the two counts, and will simply have to see how related markets perform (yen currency crosses and U.S. bonds, for example), along with the structure of the next decline, to begin assigning higher probability to one of those options."

"In conclusion, bears appear have the ball for the near term -- and TRAN appears to be providing the clearest near-term structure at the moment. I thus believe that chart is important to monitor for clues during the coming sessions. Trade safe."
Follow me on Twitter while I try to figure out exactly how to make practical use of Twitter:
@PretzelLogic
Join the InvestorsHub Community
Register for free to join our community of investors and share your ideas. You will also get access to streaming quotes, interactive charts, trades, portfolio, live options flow and more tools.

