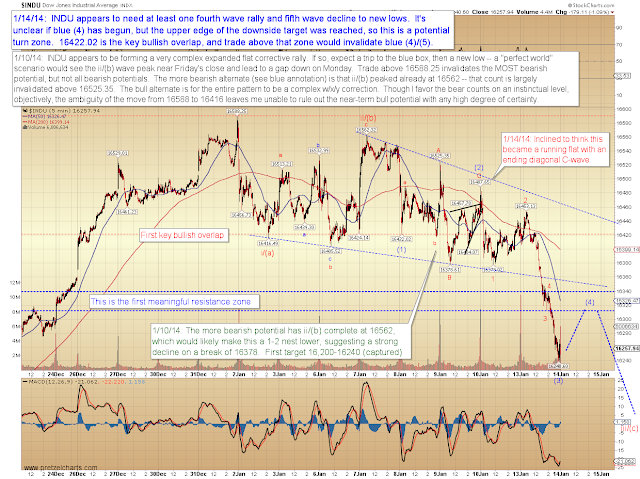
"For the past couple updates, I've been warning that I felt the market was in a potential topping zone, but was uncertain if the S&P 500 (SPX) had another small wave up still left. As the pattern developed across markets, in Friday's update I noted that the Dow Jones Industrial Average (INDU) looked destined for new lows. With this mention, I published an if/then target: if 16,378 failed, then it suggested a strong decline to 16,200-16,240. On Monday, INDU broke the key level, then dropped rapidly to 16,240.60 before staging a small recovery.
For at least a year, this has been a very hard market in which to project downside moves against the (obviously) prevailing bullish trend -- and the market's current position is often where things get even trickier for bears. No matter how hard we try, as humans we can't help but want to envision a market that moves in a linear fashion. We have to fight the urge to project the market's future by using the same equations that work in the macro world, such as: "If a train leaves New York and travels at 100 miles an hour, how long until it reaches Cleveland, 400 miles away?" We figure: 4 hours, right?
The problem is, when it comes to the market, that train may decide to travel to Cleveland by way of Miami. Or, despite the fact that it's headed that direction, it may decide not to go to Cleveland at all -- just like the rest of us. (Sorry Clevelanders!)
The point is, on several occasions last week I mentioned that selling retests of the SPX 1849 high appeared to be a solid trade to me -- but now that we've seen a decline and selling actually looks like a "good" trade to our linear-thinking minds, it's much more dangerous. Don't get me wrong, I think the odds are good for at least some continuation to the downside -- but every projection doesn't make for a good trade, because entries, risk/reward, stops, etc. must all be considered.
So if you're bearish but missed the boat last week, be very careful about where you try to hop on going forward. The reality is, the market hasn't yet done anything but form a three-wave corrective decline. No key intermediate levels have been broken, and the pattern has not yet formed an impulsive five-wave decline to suggest a larger trend change. While there have been intermediate warning signals, price and pattern trump everything -- and practically speaking, the pattern at intermediate degree has not yet ruled out the potential for another wave up. Speculate accordingly.
Let's start off with INDU, since the pattern here still appears a bit cleaner to me than SPX. I've noted some key upside levels on the chart."
"SPX doesn't have the clear nested first and second waves that INDU has, but bears would like to see 1823-27 act as resistance to any rallies. Bulls would like to see 1810 +/- act as support. The action over the next few sessions will have intermediate implications, though it must be noted that a failure at 1810 simply rules out a micro fourth wave and limits bull options. In itself, it is not the "end-all" to the bull case -- more on that in the next few updates."
One chart (not shown) which was quite bearish yesterday is the Dow Jones Transportation Average (TRAN). TRAN lunged to new highs at the open, then closed below Friday's low, thereby forming a bearish engulfing candle.
"I'd also like to show the SPY chart again, to emphasize the intermediate importance of the current inflection zone. Bulls can still stick save the market in the near future and keep the uptrend alive -- but if they don't, we're likely in for a solid correction, in the neighborhood of 8-10% or more."
"In conclusion, the ingredients are in place for an intermediate decline, but we don't yet have confirmation from either the price or the patterns. This has all the makings of an important week for the markets. Trade safe. "
Register for free to join our community of investors and share your ideas. You will also get access to streaming quotes, interactive charts, trades, portfolio, live options flow and more tools.
 News
News  Market Data
  Discover