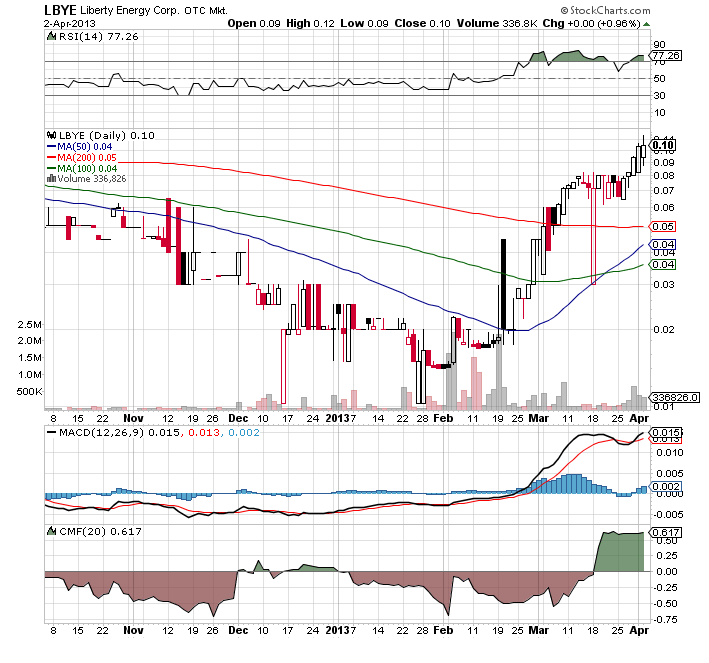
Golden Cross forming on the Daily chart. (ie. 200day MA undercutting 50day MA) Bottom came in with MACD cross. When the MACD line turned positive, breakout happened, and the stock ran up from a base. When that when the CMF turned positive, breakout happened again, and the stock ran up AGAIN from a higher base.
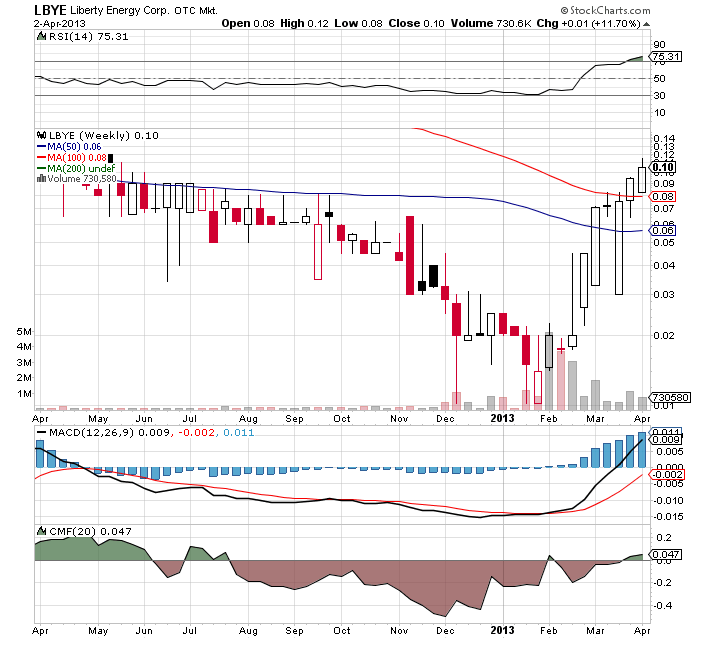
Weekly 1-year snapshot
MA 100 & 50 starting to turn. Bottom came in with MACD cross. With the MACD line just turning positive, will we see another breakout? The CMF recently turned positive, another bullish sign of breakout coming?
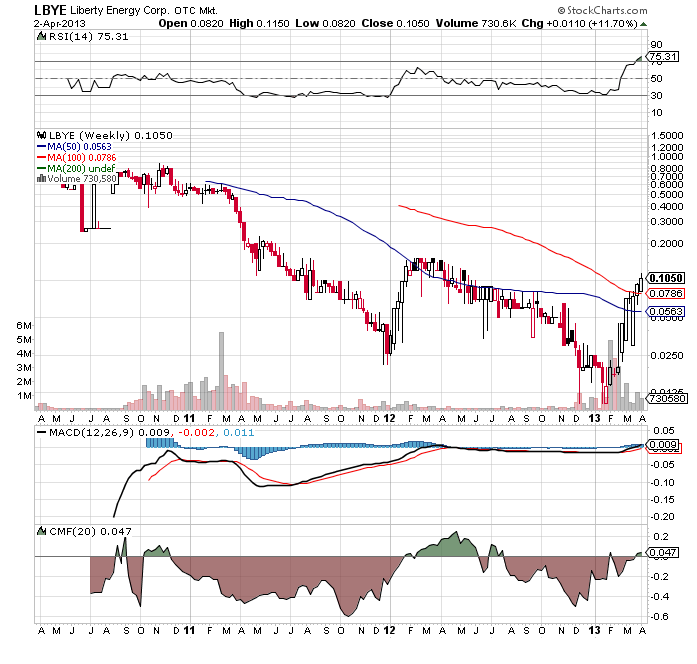
Weekly 2-year snapshot
Looks when sweeter with 2-year weekly chart. Price was over .80 2 years ago! And I expect to see much better Fundamentals this time... Solid management & acquisitions of revenue-producing assets, will all be fine by me!
Register for free to join our community of investors and share your ideas. You will also get access to streaming quotes, interactive charts, trades, portfolio, live options flow and more tools.


 News
News  Market Data
  Discover