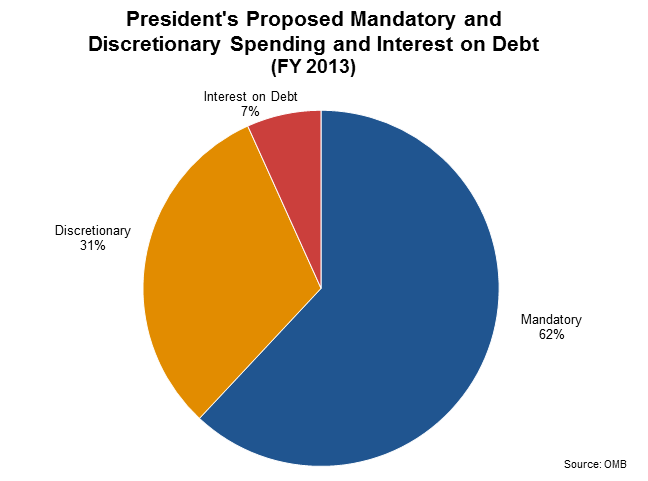
The U.S. Treasury divides all spending into three groups: mandatory spending and discretionary spending and interest on debt. Interest on debt, which is much smaller than the other two categories, is the interest the government pays on its accumulated debt, minus interest income received by the government for assets it owns. This pie chart shows all projected federal spending in 2013 broken into these three categories.
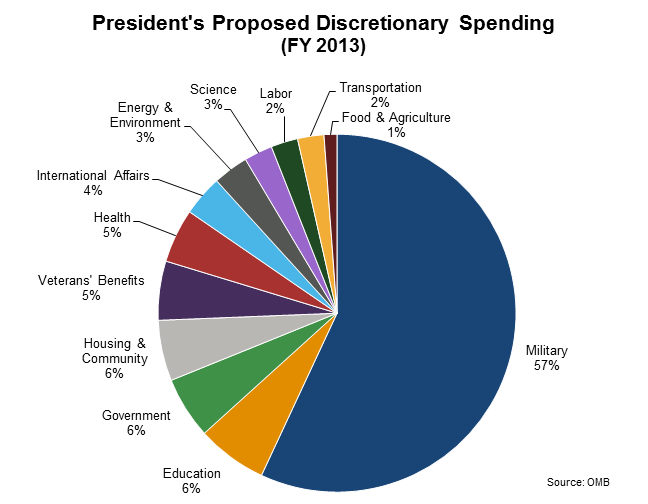
This (discretionary budget and spending) is the spending we always hear about... and what they budget. Occassionally, like once during the Clinton years, more money comes in than goes out for the manadatory spending and they can use it to say "we have a surplus". It is all really just smoke and mirrors.
Mandatory spending is largely made up of earned-benefit or entitlement programs, and the spending for those programs is determined by eligibility rules rather than the appropriations process. For example, Congress decides to create a program like the Supplemental Nutrition Assistance Program (SNAP), also known as food stamps. It then sets criteria for determining who is eligible to receive benefits from the program. The amount of money spent on SNAP each year is then determined by how many people are eligible and apply for benefits.
Congress therefore cannot decide each year to increase or decrease the budget for SNAP. Instead, it can review the eligibility rules and may change them in order to exclude or include more people.
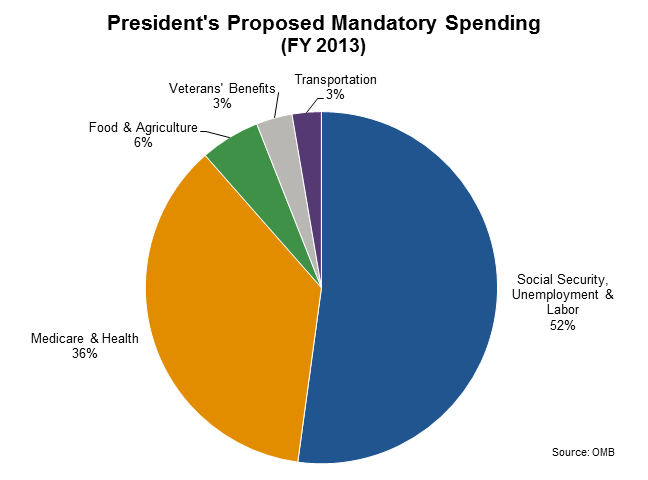
Mandatory spending makes up about two-thirds of the total federal budget. By far the largest mandatory program is Social Security, which comprises around one-third of mandatory spending and around 20 percent of the total federal budget. This chart shows where the projected $2.1 trillion in mandatory spending will go in fiscal year 2013.
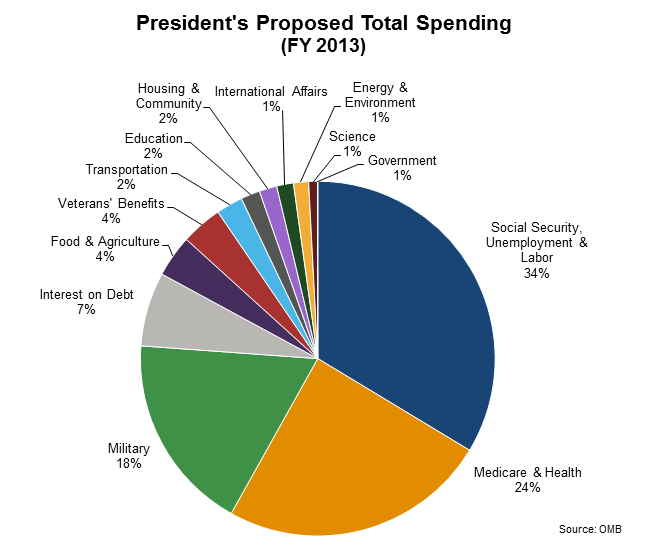
Finally, putting together discretionary spending, mandatory spending, and interest on the debt, you can see how the total federal budget is divided into different categories of spending. This pie chart shows how President Obama proposed dividing up the whole federal budget in fiscal 2013. Income security programs like Social Security and unemployment insurance together comprise the largest slice, followed by Medicare & Health, and Military.
Register for free to join our community of investors and share your ideas. You will also get access to streaming quotes, interactive charts, trades, portfolio, live options flow and more tools.
 News
News  Market Data
  Discover