


Wednesday, January 16, 2013 2:50:41 PM
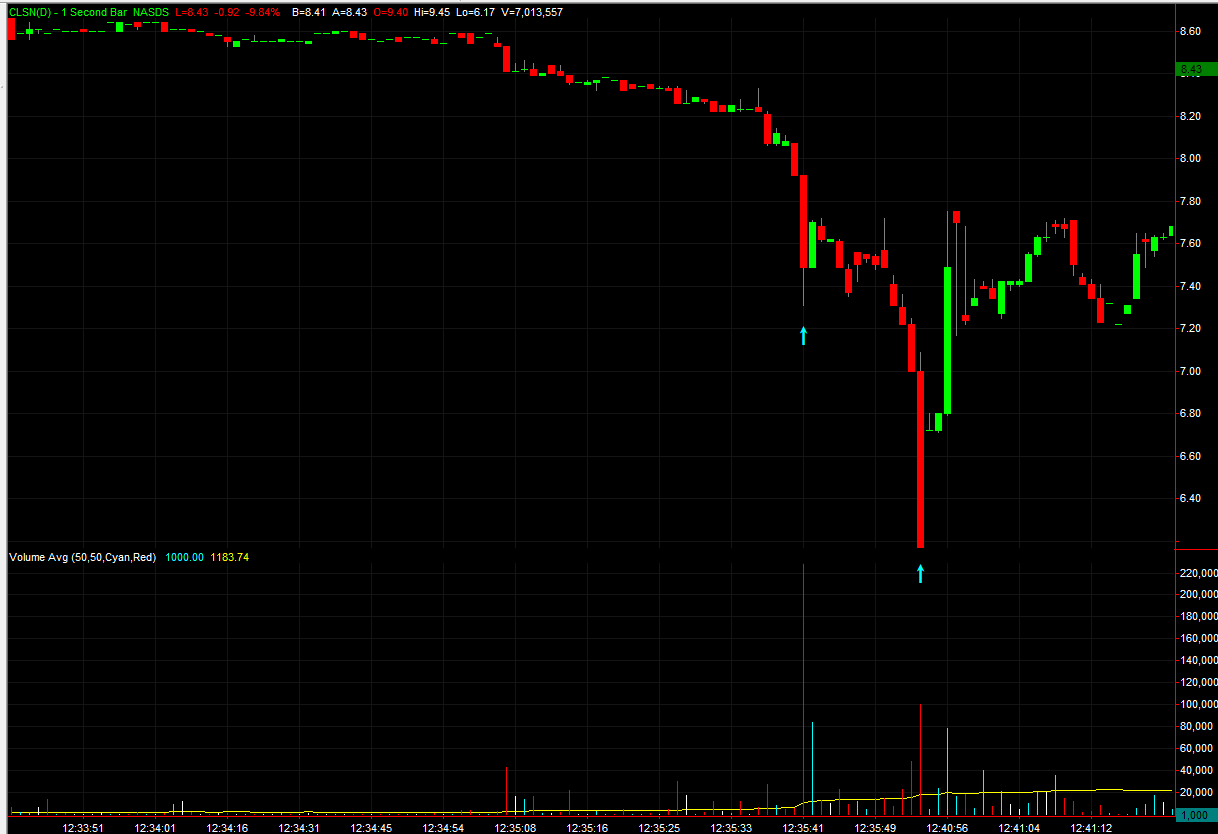
We clearly see the first blue arrow on the 1 second chart, which was a total of only 226,662 shares, both buys and sells which triggered the move after a gradual slope.
It would not have taken that many sells to trigger, as many stops may have been set as market orders at $8, people liking round numbers. Thus the second before could have triggered that second with the first blue arrow. Only about 6,000 shares, both buys and sells. That was the second that dropped below $8
After that, we had some additional sales, until the next logical stop market order level was hit $7. Notice that is exactly the second large move down marked by the second blue arrow.
Again, people set stops at round numbers like $8 and $7, others just below prior low fractals. So it would not take many shares sold to elicit this trigger of stops mixed with some panic selling.
It could just be normal selling and then the triggering of stops, or an intentional trigger by a larger player wanting 3 things.
1. Jan Calls to expire worthless that they sold.
2. Cover short sales at a lower price
3. Pick up more shares cheaper
4. Pick up more calls cheaper or offload Jan puts
VHAI - Vocodia Partners with Leading Political Super PACs to Revolutionize Fundraising Efforts • VHAI • Sep 19, 2024 11:48 AM
Dear Cashmere Group Holding Co. AKA Swifty Global Signs Binding Letter of Intent to be Acquired by Signing Day Sports • DRCR • Sep 19, 2024 10:26 AM
HealthLynked Launches Virtual Urgent Care Through Partnership with Lyric Health. • HLYK • Sep 19, 2024 8:00 AM
Element79 Gold Corp. Appoints Kevin Arias as Advisor to the Board of Directors, Strengthening Strategic Leadership • ELMGF • Sep 18, 2024 10:29 AM
Mawson Finland Limited Further Expands the Known Mineralized Zones at Rajapalot: Palokas step-out drills 7 metres @ 9.1 g/t gold & 706 ppm cobalt • MFL • Sep 17, 2024 9:02 AM
PickleJar Announces Integration With OptCulture to Deliver Holistic Fan Experiences at Venue Point of Sale • PKLE • Sep 17, 2024 8:00 AM

