Sunday, December 02, 2012 12:43:55 PM
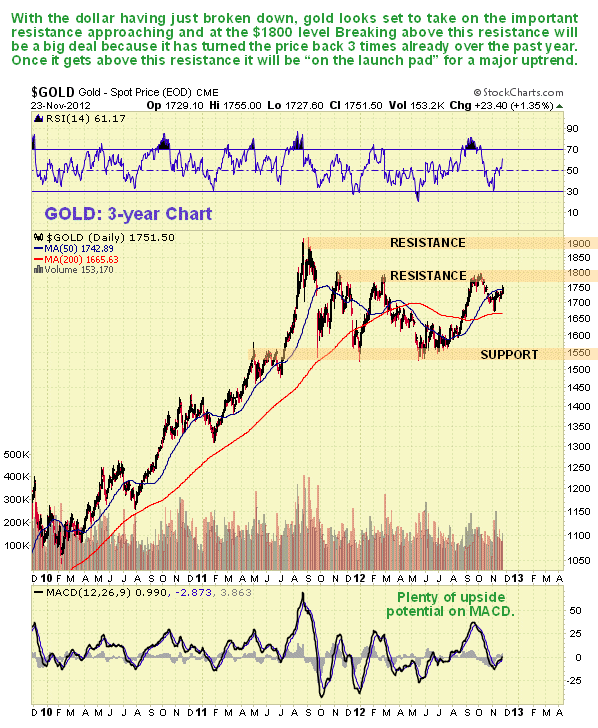
Gold dipped to our "buy spot" just above $1700,
in the process marking out the Right Shoulder of the small
Head- and-Shoulders bottom that formed just above its
200-day moving average.
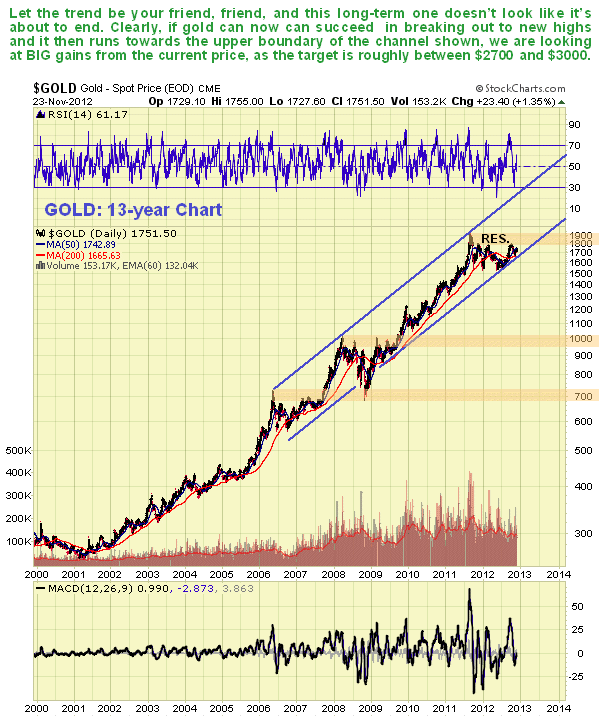
Everything is now in place for a significant uptrend to get going,
with the breakout on Friday from a fine completed base pattern, and
the MACD indicator showing that there is still plenty of immediate
upside potential from here.
by Clive Maund,
Diploma Technical Analysis
http://investorshub.advfn.com/boards/read_msg.aspx?message_id=81969239
God Bless
Recent CMCL News
- Caledonia Mining Corporation Plc: Notification of relevant change to significant shareholder • GlobeNewswire Inc. • 04/16/2024 06:00:00 AM
- Caledonia Mining Corporation Plc: Notification of relevant change to significant shareholder • GlobeNewswire Inc. • 04/15/2024 06:00:00 AM
- Caledonia Mining Corporation Plc Notification of relevant change to significant shareholder • GlobeNewswire Inc. • 04/10/2024 06:05:00 AM
- Caledonia Mining Corporation Plc: Issue of Securities Pursuant to Long Term Incentive Plan Awards and Issue of New Long Term Incentive Plan Awards • GlobeNewswire Inc. • 04/10/2024 06:05:00 AM
- Caledonia Mining Corporation Plc Blanket Mine Q1 2024 Production • GlobeNewswire Inc. • 04/10/2024 06:00:00 AM
- Caledonia Mining Corporation Plc: Appointment of Chief Operating Officer • GlobeNewswire Inc. • 04/08/2024 06:00:00 AM
- Caledonia declares quarterly dividend • GlobeNewswire Inc. • 03/28/2024 07:03:00 AM
- Caledonia Mining Corporation Plc Results for the Year ended December 31, 2023; Notice of Management Conference Call; Dividend Declaration • GlobeNewswire Inc. • 03/28/2024 07:00:00 AM
- Caledonia Mining Corporation Plc: Notice of Availability of AGM Materials • GlobeNewswire Inc. • 03/27/2024 07:00:00 AM
- Caledonia Mining Corporation Plc: Notification of relevant change to significant shareholder • GlobeNewswire Inc. • 03/26/2024 07:00:00 AM
- Caledonia Mining Corporation Plc: Notification of relevant change to significant shareholder • GlobeNewswire Inc. • 03/25/2024 07:00:00 AM
- Caledonia Mining Corporation Plc: Non-Executive Director Changes • GlobeNewswire Inc. • 03/18/2024 07:00:00 AM
- Caledonia Mining Corporation Plc Trading update for the year ended December 31, 2023 • GlobeNewswire Inc. • 03/04/2024 07:00:00 AM
- Form 6-K - Report of foreign issuer [Rules 13a-16 and 15d-16] • Edgar (US Regulatory) • 01/30/2024 11:00:08 AM
- Caledonia Mining Corporation Plc: Encouraging results from deep level drilling at Blanket Mine • GlobeNewswire Inc. • 01/30/2024 07:00:00 AM
- Form 6-K - Report of foreign issuer [Rules 13a-16 and 15d-16] • Edgar (US Regulatory) • 01/23/2024 11:00:14 AM
- Caledonia Mining Corporation Plc: Notification of relevant change to significant shareholder • GlobeNewswire Inc. • 01/23/2024 07:00:00 AM
- Form 6-K - Report of foreign issuer [Rules 13a-16 and 15d-16] • Edgar (US Regulatory) • 01/12/2024 11:01:05 AM
- Form 6-K - Report of foreign issuer [Rules 13a-16 and 15d-16] • Edgar (US Regulatory) • 01/12/2024 11:00:08 AM
- Caledonia Mining Corporation Plc: Issue of Securities Pursuant to Long Term Incentive Plan Awards • GlobeNewswire Inc. • 01/12/2024 07:01:00 AM
- Caledonia Mining Corporation Plc: Blanket Mine Q4 and FY 2023 Production and 2024 Guidance • GlobeNewswire Inc. • 01/12/2024 07:00:00 AM
- Form 6-K - Report of foreign issuer [Rules 13a-16 and 15d-16] • Edgar (US Regulatory) • 01/04/2024 11:00:09 AM
- Caledonia Mining Corporation Plc: Notification of relevant change to significant shareholder • GlobeNewswire Inc. • 01/04/2024 07:00:00 AM
- Form 6-K - Report of foreign issuer [Rules 13a-16 and 15d-16] • Edgar (US Regulatory) • 01/03/2024 11:00:08 AM
- Caledonia Mining Corporation Plc: Notification of relevant change to significant shareholder • GlobeNewswire Inc. • 01/03/2024 07:00:00 AM
NanoViricides Reports that the Phase I NV-387 Clinical Trial is Completed Successfully and Data Lock is Expected Soon • NNVC • May 2, 2024 10:07 AM
ILUS Files Form 10-K and Provides Shareholder Update • ILUS • May 2, 2024 8:52 AM
Avant Technologies Names New CEO Following Acquisition of Healthcare Technology and Data Integration Firm • AVAI • May 2, 2024 8:00 AM
Bantec Engaged in a Letter of Intent to Acquire a Small New Jersey Based Manufacturing Company • BANT • May 1, 2024 10:00 AM
Cannabix Technologies to Deliver Breath Logix Alcohol Screening Device to Australia • BLO • Apr 30, 2024 8:53 AM
Hydromer, Inc. Reports Preliminary Unaudited Financial Results for First Quarter 2024 • HYDI • Apr 29, 2024 9:10 AM


