Posted by john.nelson at 9:02 AM Monday, June 25, 2012
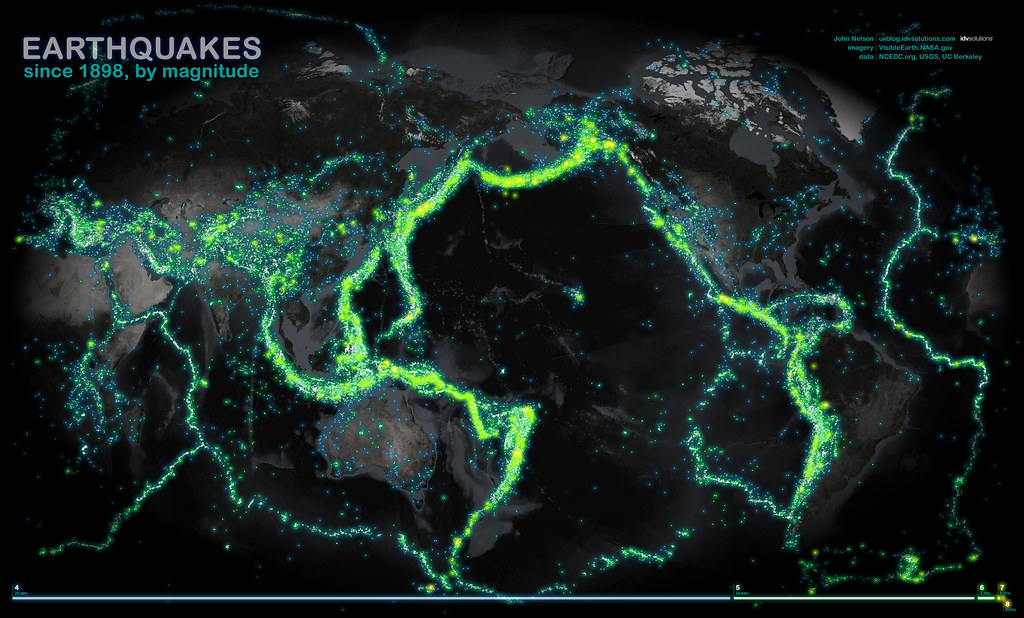
I've been looking at really general sources of existential risk and visualizing them via the kitchen sink school of thematic mapping. So the earthquakes map was just a matter of time. Here, data from NCEDC.org and the USGS and UC Berkeley have been sliced out into veneers based on magnitude, then glued onto and image that began it's life at NASA's Visual Earth and wrung into the Times projection (centered at the interesting bits). The result looks an awful lot like a fleet of Nickelodeon tankers spilled the world's supply of floam.
We only started recording hard core in the late 1960's. Also, you'd be right to assume that areas with more sensors record more earthquakes (but that's why they are there, so round and round we go), though they can pretty well pinpoint epicenters from all over.
You can order a poster print of this map than you should then mount within a flexible frame with unanchored pliable wall brackets behind shatterproof glass.
Register for free to join our community of investors and share your ideas. You will also get access to streaming quotes, interactive charts, trades, portfolio, live options flow and more tools.
 News
News  Market Data
  Discover