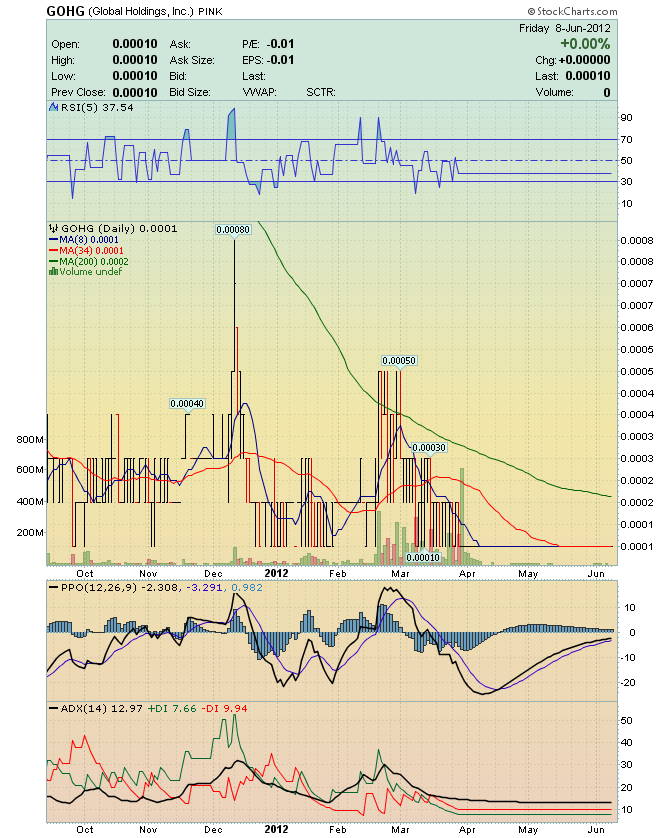
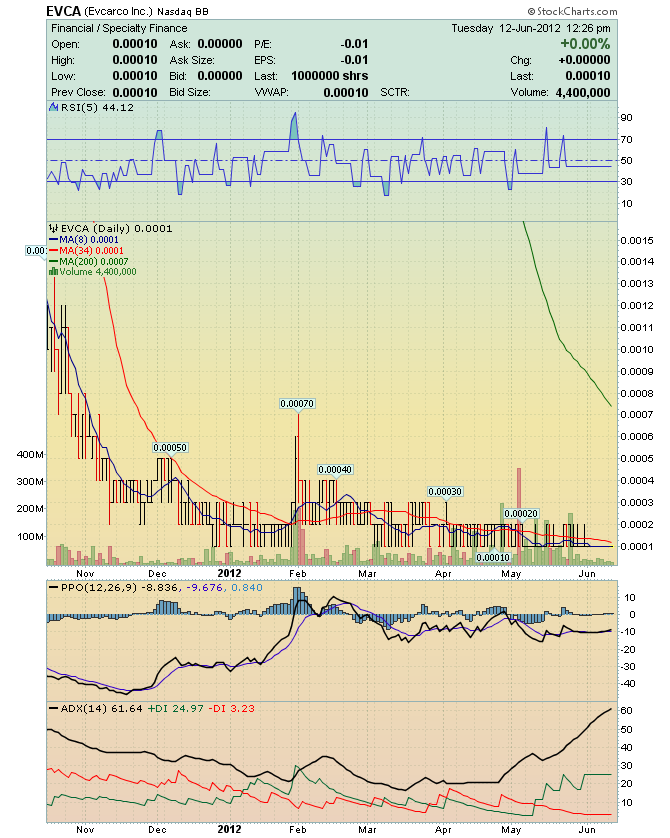
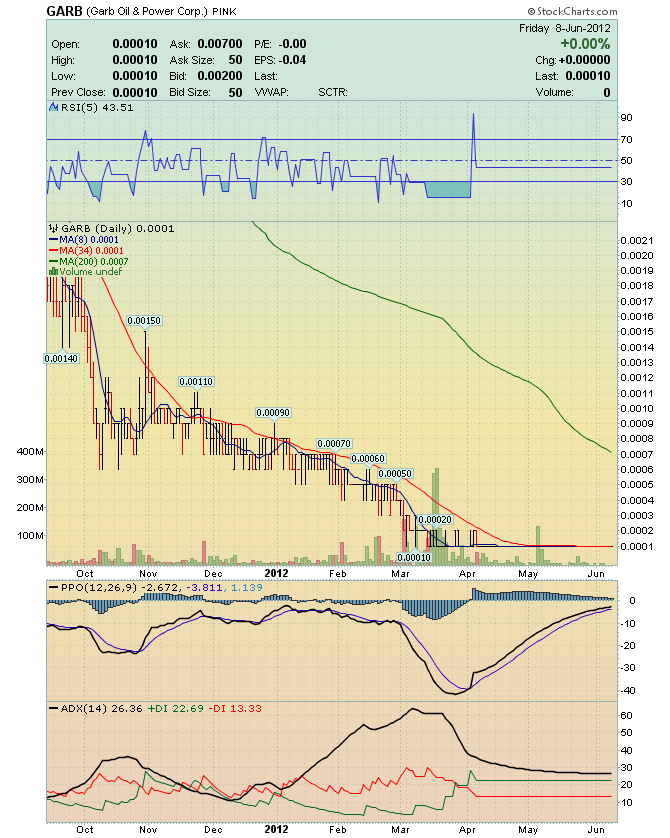
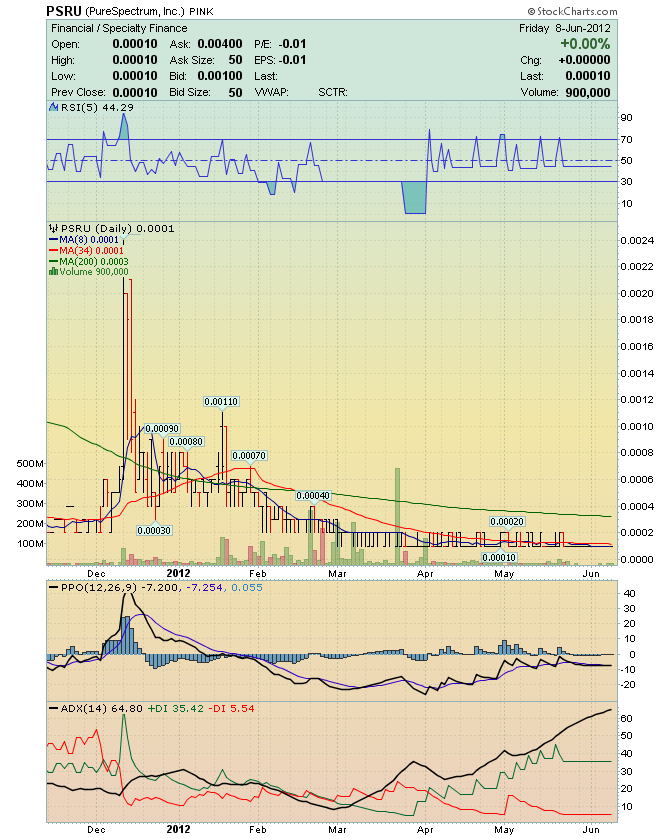
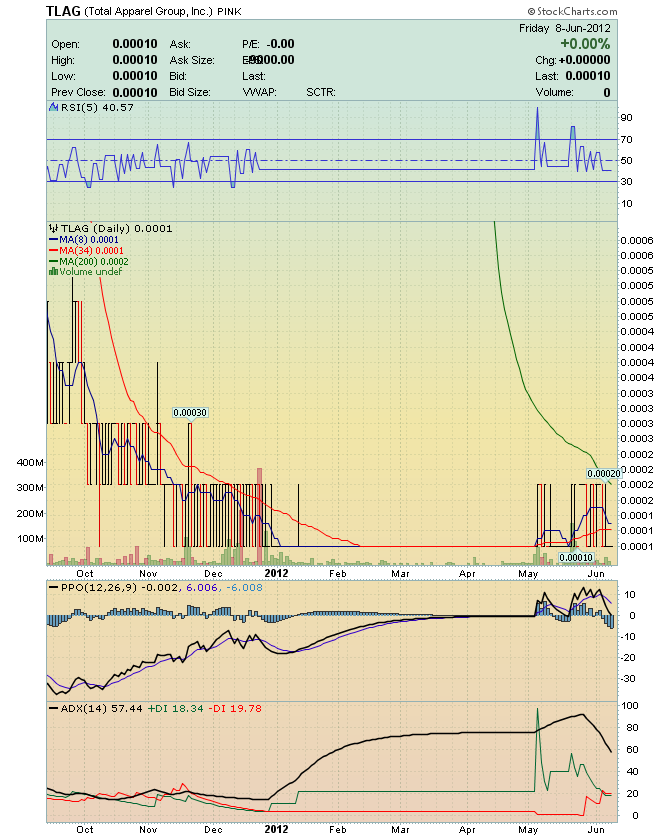
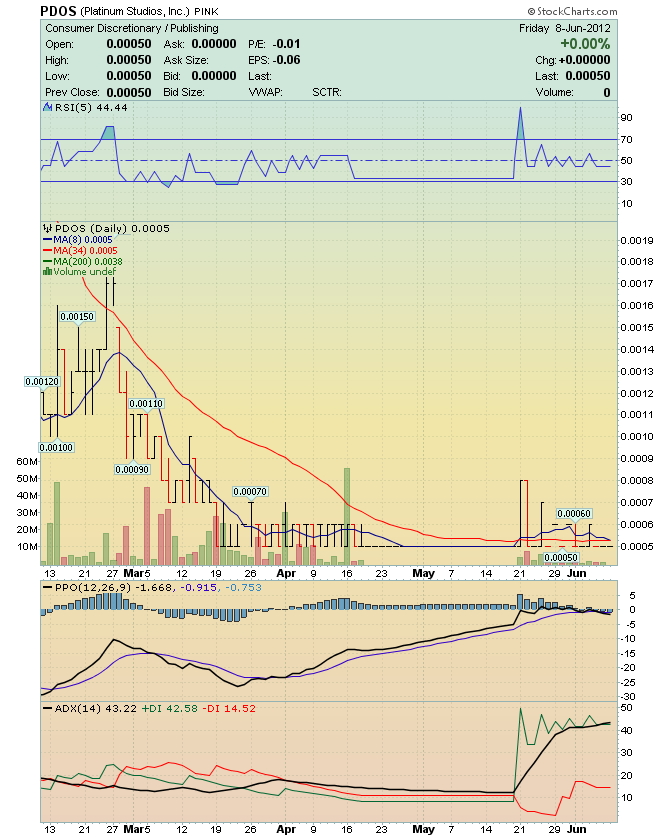
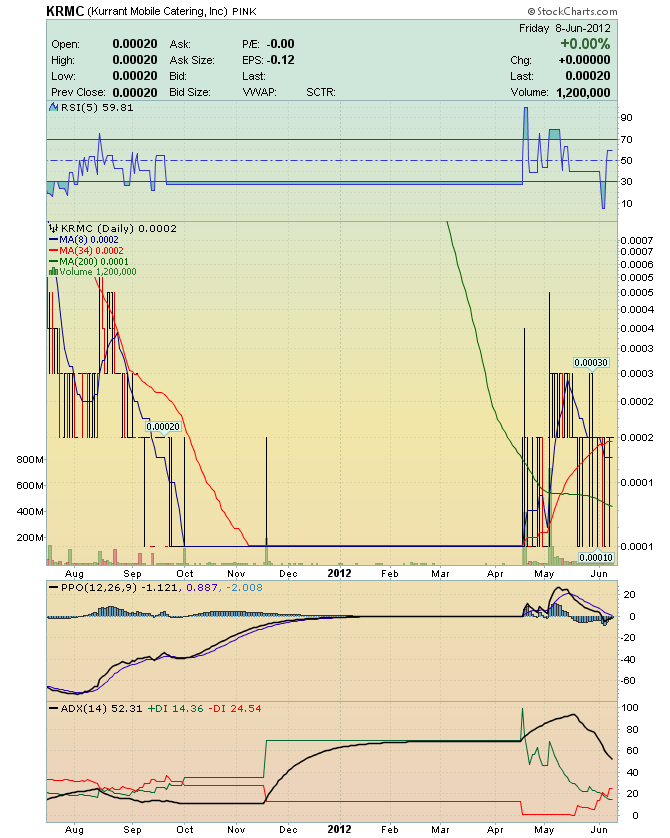
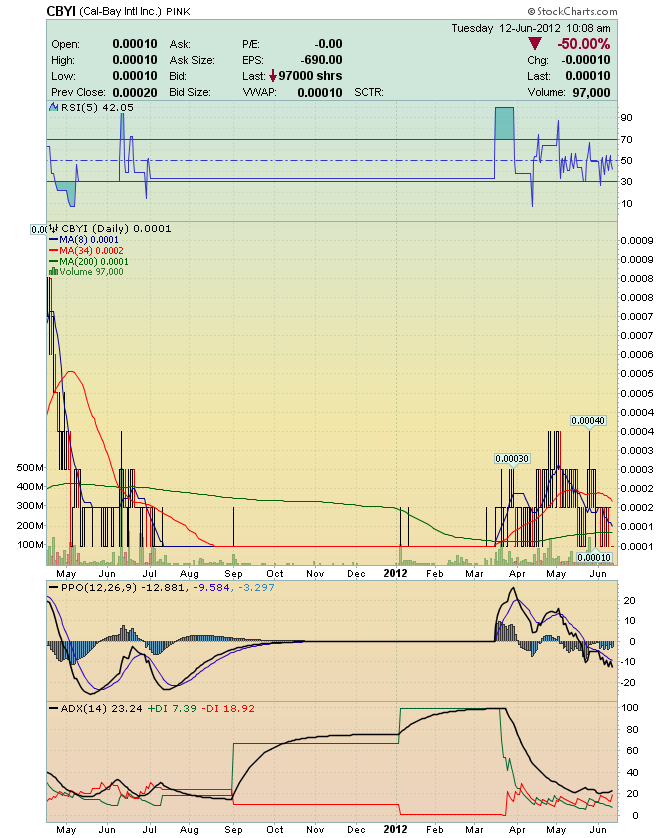
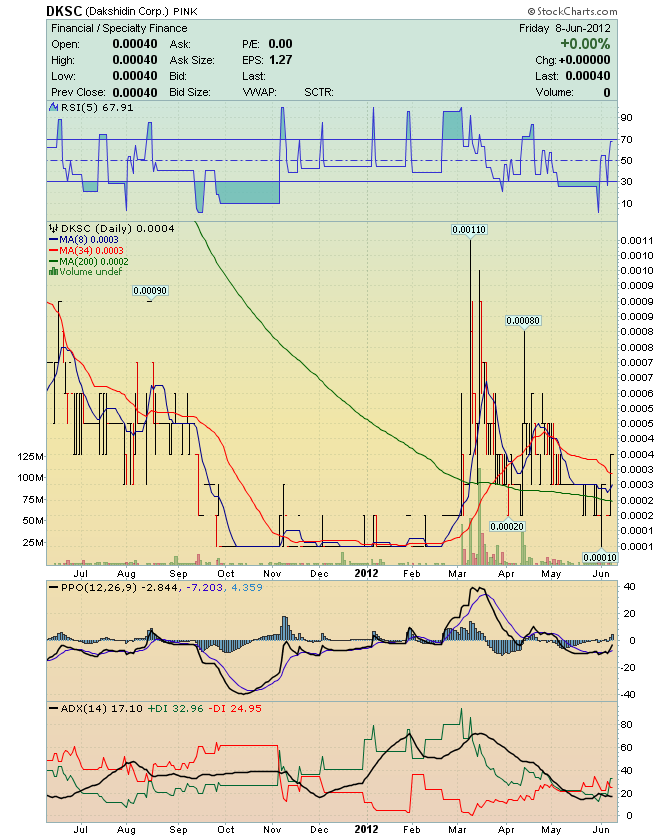
This is a "very risky", boring chart pattern, and NOT a good chart pattern to trade !
The RSI and the Price both go flat.
Your stock looks like it's sleeping, or dead !
Some charts will resemble the "Pond-Fishing Play".
This chart pattern may be caused by either a "manipulated walk down", by Market Makers, and/or Insiders,
or, the company is going under, effecting a "Reverse Stock Split" , or, will soon be delisted.
Despondency and Depression describe this situation, as shareholders watch their account value drop to nearly zero !
This is "the lowest level" that a stock can get to, in an accumulation phase.
The stock will have a Bid 0.00 - Ask 0.0001 in most cases.
The "negative news" and aggressive sellers, have now over powered any "positive news" and buyers.
Most everyone hates this stock. Shareholders who are still holding shares, are referred to as "Bagholders".
Just as the patient without a pulse, when everyone thinks the patient is dead, shareholders start to believe their shares are dead, and will never move again.
Some of these stocks will stay flat for a few weeks, while others will stay flat for months. You don't want to tie your money up for this lengh of time !
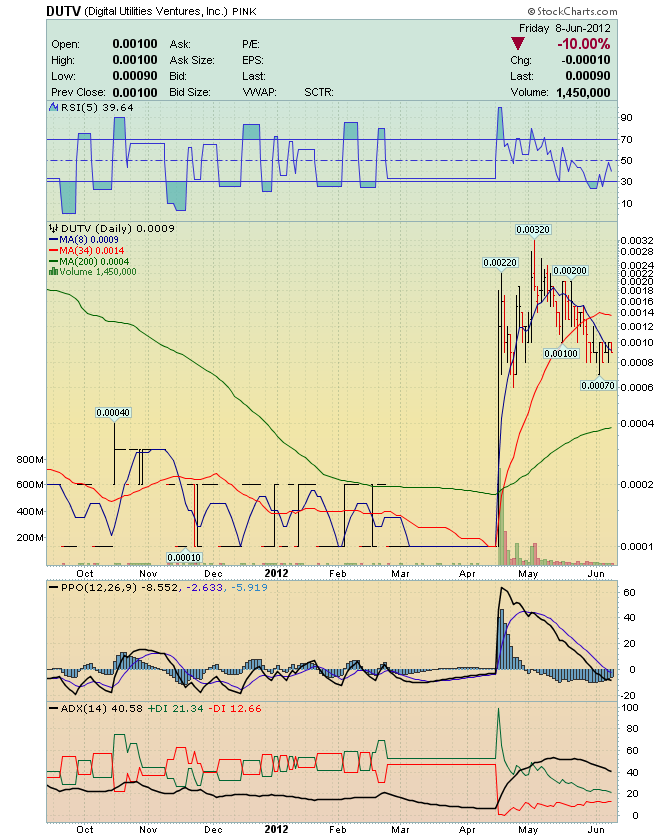
The price is pulled down to anywhere from 0.0001 to 0.0005, usually with some sort of negative event, being associated with the drop.
Some of these plays will "recover" and come back to life, after some kind of positive news is announced, but, most will NOT recover !!
Register for free to join our community of investors and share your ideas. You will also get access to streaming quotes, interactive charts, trades, portfolio, live options flow and more tools.
 News
News  Market Data
  Discover