| Followers | 2229 |
| Posts | 20751 |
| Boards Moderated | 0 |
| Alias Born | 04/13/2006 |
Sunday, January 08, 2012 1:53:17 PM
Very important to understand how to read charts: previous supports become resistances, and, previous resistances become supports.
Supports and positive points are signaled with green, resistances and negative points are signaled with red.
Supports: .015(the upper horizontal dashed green line, and also the ascending green trend line), .012(the lower horizontal dashed green line), .0085(the PAR SAR), and finally .008(the horizontal green line).
Resistances: .03(top of the first leg of the run, and, previous resistance, the lower horizontal dashed red line), .045(previous support and resistance point, the middle horizontal dashed red line), .08(previous support and resistance point, the upper horizontal dashed red line), and, .26(previous support, now resistance, the horizontal red line).
Positive points:
- The RSI is turning up, still oversold, with much room to run, I think that a run to .26 will put the RSI around 70, and, the top of the overbought zone is 90, so take your own conclusions.
- The lines of the MACD are still under 0, still lots of room to run, the MACD is at .038 right now, until .20 - .30, more than the necessary to a run to .26.
- The ADX is still at 9.58, to touch the overbought zone, at 50 - 60, it is needed a run to .50, more or less, so again still much room to the run to .26.
- The stock is now trending up, that ascending green trend line is now the support of the stock, as you can see, a run to .08 is very easy, and a spike to .26 also not impossible, on a stock that has fallen from 2.50 to .008 in two months.
- Looking to the volume, we can see that this stock was heavily shorted in the latest days/weeks, only that green day with 105M shares was higher than the entire A/S, the latest week's volume was 257M shares, almost the triple of the entire A/S, the shorts will need to cover, causing a short squeeze, and, a short squeeze could easily drive this stock to .26.
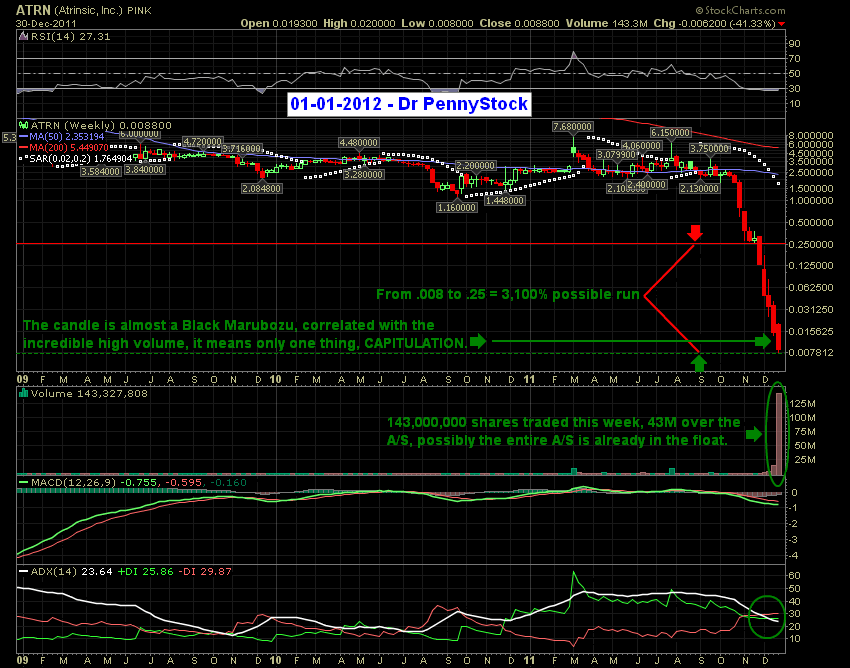
- When I analyze the weekly chart, the run to .26 is even more obvious, the RSI is still oversold, the MACD stopped the down trend, and, is still negative LOL, the +DI is still under the -DI, at 26, still room to double, the volume is awesome, with much higher volume on the white candle, it means the big money is buying, over $4,000,000 were traded only in the last week, and, finally the close was above the middle of the candle, the pull back to .015 was very healthy, and, the stock is now ready to continue the run to .08 - .26, the 3,100% possible run I called right at the bottom last week.
Negative points: Technically I do not see any negative points at this time, all the indicators are pointing up, in both charts.
Daily Chart

Weekly chart

The weekly chart I posted last week, where I predicted a capitulation and a bounce this week, I was 100% right, see here: http://investorshub.advfn.com/boards/read_msg.aspx?message_id=70440282

Any question or response to this message, please post it on my IHUB board here: http://investorshub.advfn.com/boards/board.aspx?board_id=20573
Do not send me PMs, I am a free member, I can't respond to them.
Cheers
Dr Pennystock
Recent PTIX News
- Form SC 13G/A - Statement of acquisition of beneficial ownership by individuals: [Amend] • Edgar (US Regulatory) • 02/14/2024 07:29:52 PM
- Form 8-K - Current report • Edgar (US Regulatory) • 12/15/2023 08:50:02 PM
- Form 8-K - Current report • Edgar (US Regulatory) • 11/29/2023 10:18:27 PM
- Form 10-Q - Quarterly report [Sections 13 or 15(d)] • Edgar (US Regulatory) • 11/14/2023 09:02:39 PM
- Form DEF 14A - Other definitive proxy statements • Edgar (US Regulatory) • 11/02/2023 08:29:05 PM
- Form 4 - Statement of changes in beneficial ownership of securities • Edgar (US Regulatory) • 10/13/2023 04:48:45 PM
- Form 10-Q - Quarterly report [Sections 13 or 15(d)] • Edgar (US Regulatory) • 08/14/2023 07:29:32 PM
Glidelogic Corp. Becomes TikTok Shop Partner, Opening a New Chapter in E-commerce Services • GDLG • Jul 5, 2024 7:09 AM
Freedom Holdings Corporate Update; Announces Management Has Signed Letter of Intent • FHLD • Jul 3, 2024 9:00 AM
EWRC's 21 Moves Gaming Studios Moves to SONY Pictures Studios and Green Lights Development of a Third Upcoming Game • EWRC • Jul 2, 2024 8:00 AM
BNCM and DELEX Healthcare Group Announce Strategic Merger to Drive Expansion and Growth • BNCM • Jul 2, 2024 7:19 AM
NUBURU Announces Upcoming TV Interview Featuring CEO Brian Knaley on Fox Business, Bloomberg TV, and Newsmax TV as Sponsored Programming • BURU • Jul 1, 2024 1:57 PM
Mass Megawatts Announces $220,500 Debt Cancellation Agreement to Improve Financing and Sales of a New Product to be Announced on July 11 • MMMW • Jun 28, 2024 7:30 AM


