


Saturday, April 17, 2010 7:44:34 AM
2 year / daily chart
i dont use indicators, i dont use voodoo, i just watch price vs resistances and supports within channels. i follow very simple patterns and its the way i like to keep it.
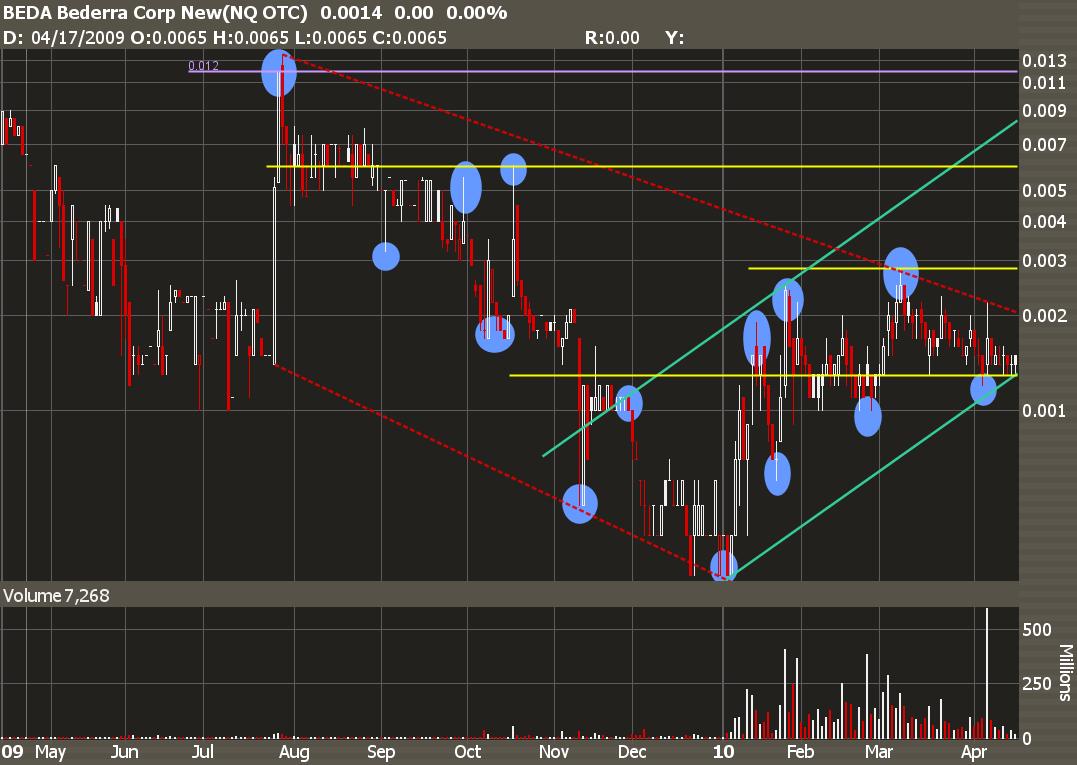
i believe the trend has changed, and is now in a longterm upward trend. AND as you can see, the volume increased just as the trend had changed. My ultimate target is the purple line .012 - .013 ballpark figure, because i think a V-shape chart pattern has formed.
As you can see (with my blue circles drawn), the pattern has changed from lower highs and lower lows, to now having higher highs and higher lows. i have yet to see a negation of this trend, and believe that volume will come pretty soon because of how i see the chart.
this is imo.
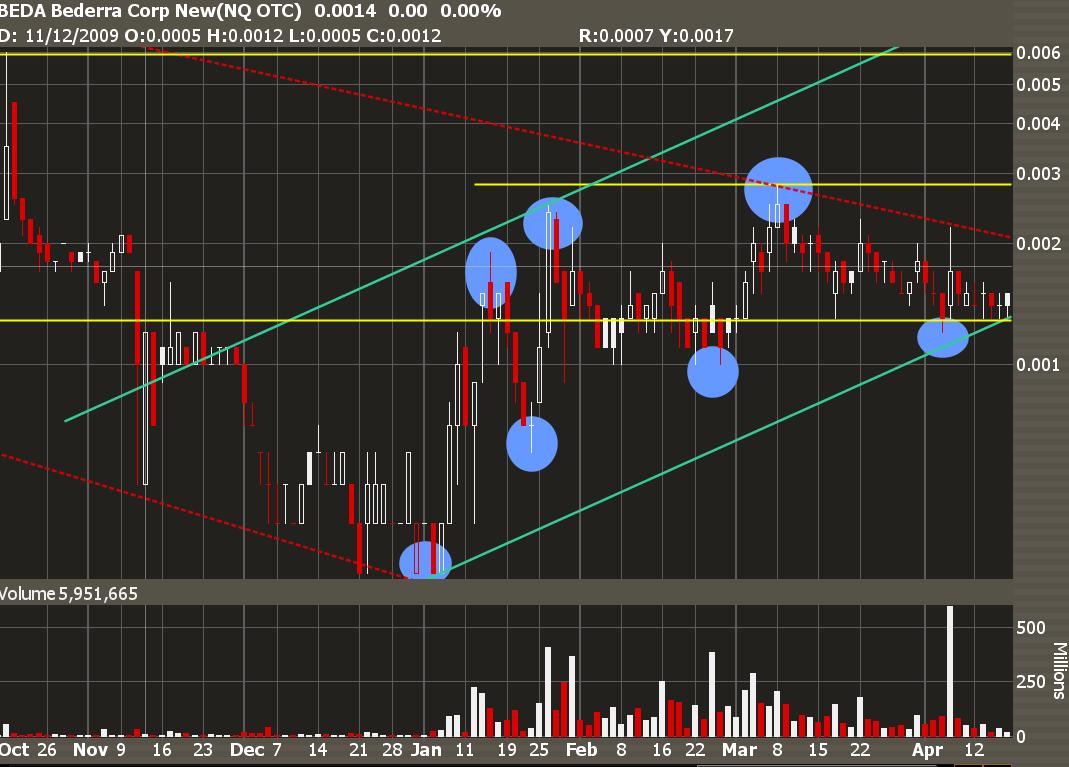
and here is another closer look at the chart / uptrend channel / and resistances/supports i have noted.
Have a nice day everyone!
FEATURED POET Announces Design Win and Collaboration with Foxconn Interconnect Technology for High-speed AI Systems • May 14, 2024 10:09 AM
FEATURED Element79 Gold Corp Reports Exceptionally High-Grade Results from Lucero • May 14, 2024 7:00 AM
VAYK Added New Manager for Expansion into $64 Billion Domestic Short-term Rental Market • VAYK • May 14, 2024 9:00 AM
Avant Technologies Equipping AI-Managed Data Center with High Performance Computing Systems • AVAI • May 10, 2024 8:00 AM
VAYK Discloses Strategic Conversation on Potential Acquisition of $4 Million Home Service Business • VAYK • May 9, 2024 9:00 AM
Bantec's Howco Awarded $4.19 Million Dollar U.S. Department of Defense Contract • BANT • May 8, 2024 10:00 AM

