Understanding support and resistance levels are one of the most basic, but important aspects of technical analysis. Their importance comes in the aspect of the psychology they provide. Think about it... if you can have an idea of "where" the bears have stood in the past, don't you think that'd be valuable? Well, that is exactly what understanding support and resistances can do for you.
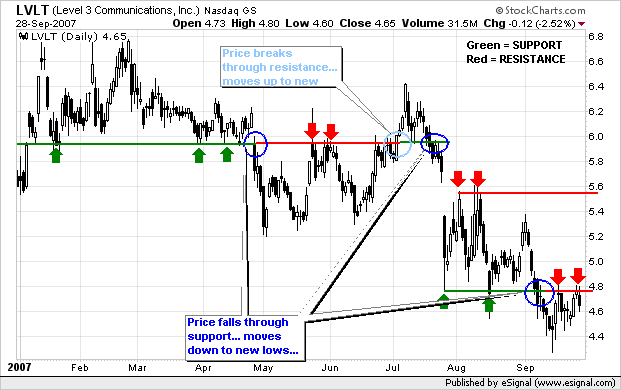
What is resistance? Resistance levels are where the bears "own the field"... the PPS approaches these areas and is then battered back down... resistance points are shown with red arrows/lines.
What is support? Support levels are just the opposite of resistance levels in regards to "who's in charge". In this case, our good friends DA BULLS own the field. Support levels are areas where buyer's sentiment is strong; therefore, when the price approaches these levels, buyers are waiting with open arms... areas of support are shown with green arrows/lines.
One important concept to realize is that when is resistance is broke, it BECOMES the new support. The opposite is also true. When a support is broken, it in return becomes the new resistance. This concept is illustrated in the LVLT chart below.
Register for free to join our community of investors and share your ideas. You will also get access to streaming quotes, interactive charts, trades, portfolio, live options flow and more tools.


 News
News  Market Data
  Discover