


| Followers | 681 |
| Posts | 141562 |
| Boards Moderated | 35 |
| Alias Born | 03/10/2004 |
Thursday, May 09, 2024 4:48:30 PM
By: Bruce Powers | May 9, 2024
• The current natural gas rally suggests a move towards 2.37-2.465, backed by various technical indications.
Natural gas triggered a bullish continuation today as it rallied above the prior trend high of 2.27. It is on track to possibly close above that price level and confirm the breakout. It will be a clearer sign of strength if it does close above 2.27. Resistance for the day was seen at a high of 2.31, an interim target defined from a prior swing low. Today’s advance followed a retest of support with a low of 2.15, before buyers took back control.
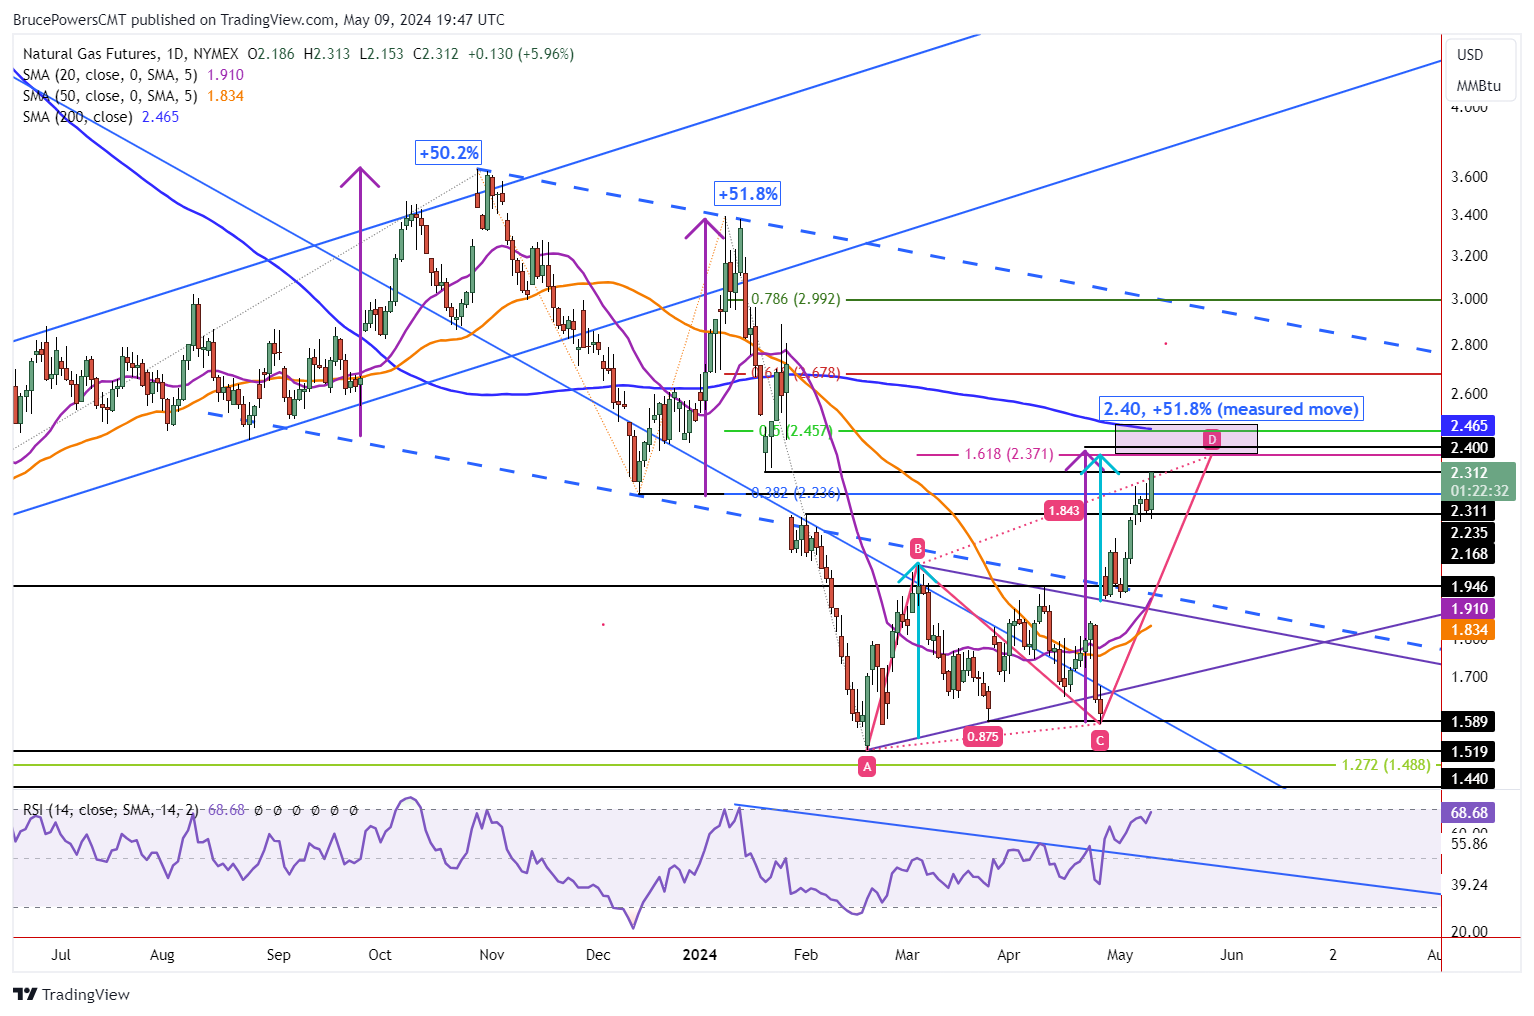
Bullish Price Action Improves Chance of Hitting 2.37 and Higher
Bullish price action seen today improves the chance that natural gas reaches the next higher target zone. It is anchored around the 200-Day MA, currently at 2.465. Given the current trajectory of the trend and the fact that the 200-Day line has not been tested as resistance since late-January, there is a good chance the 200-Day line may be reached. It is the top of a potential resistance zone that starts at 2.37, which is the completion of a rising ABCD pattern where the CD leg of the advance is 161.8% of the AB leg. Also, a minimum target from the bottom symmetrical triangle completes at 2.37 (light blue arrows).
Measured Move Completes at 2.40
A little higher, at 2.40, a measured move completes. That is where the current rally matches the advance from the December 13 low on a percentage basis. The December rise was 51.8% and the current rally matches at 2.40. It would reflect price symmetry between different swings. The December rally was the last advance that was greater than the previous three, which all followed the December rally. It is also close to a match with the rally that began from the August 24 swing low last year. And that rally was just prior to the December advance. Natural gas advanced by 50.2% from that low.
Can the price of natural gas extend beyond the 200-Day MA. Of course it can, but the resistance zone noted above is backed by multiple indications that a potentially significant resistance zone begins at 2.37. The risk of a retracement will be highest upon entering the 2.37 to 2.465 price zone.
Read Full Story »»»
 DiscoverGold
Information posted to this board is not meant to suggest any specific action, but to point out the technical signs that can help our readers make their own specific decisions. Caveat emptor!
• DiscoverGold
Avant Technologies Engages Wired4Tech to Evaluate the Performance of Next Generation AI Server Technology • AVAI • May 23, 2024 8:00 AM
Branded Legacy, Inc. Unveils Collaboration with Celebrity Tattoo Artist Kat Tat for New Tattoo Aftercare Product • BLEG • May 22, 2024 8:30 AM
"Defo's Morning Briefing" Set to Debut for "GreenliteTV" • GRNL • May 21, 2024 2:28 PM
North Bay Resources Announces 50/50 JV at Fran Gold Project, British Columbia; Initiates NI 43-101 Resources Estimate and Bulk Sample • NBRI • May 21, 2024 9:07 AM
Greenlite Ventures Inks Deal to Acquire No Limit Technology • GRNL • May 17, 2024 3:00 PM
Music Licensing, Inc. (OTC: SONG) Subsidiary Pro Music Rights Secures Final Judgment of $114,081.30 USD, Demonstrating Strength of Licensing Agreements • SONGD • May 17, 2024 11:00 AM

