


| Followers | 681 |
| Posts | 141515 |
| Boards Moderated | 35 |
| Alias Born | 03/10/2004 |
Thursday, May 09, 2024 4:46:28 PM
By: Bruce Powers | May 9, 2024
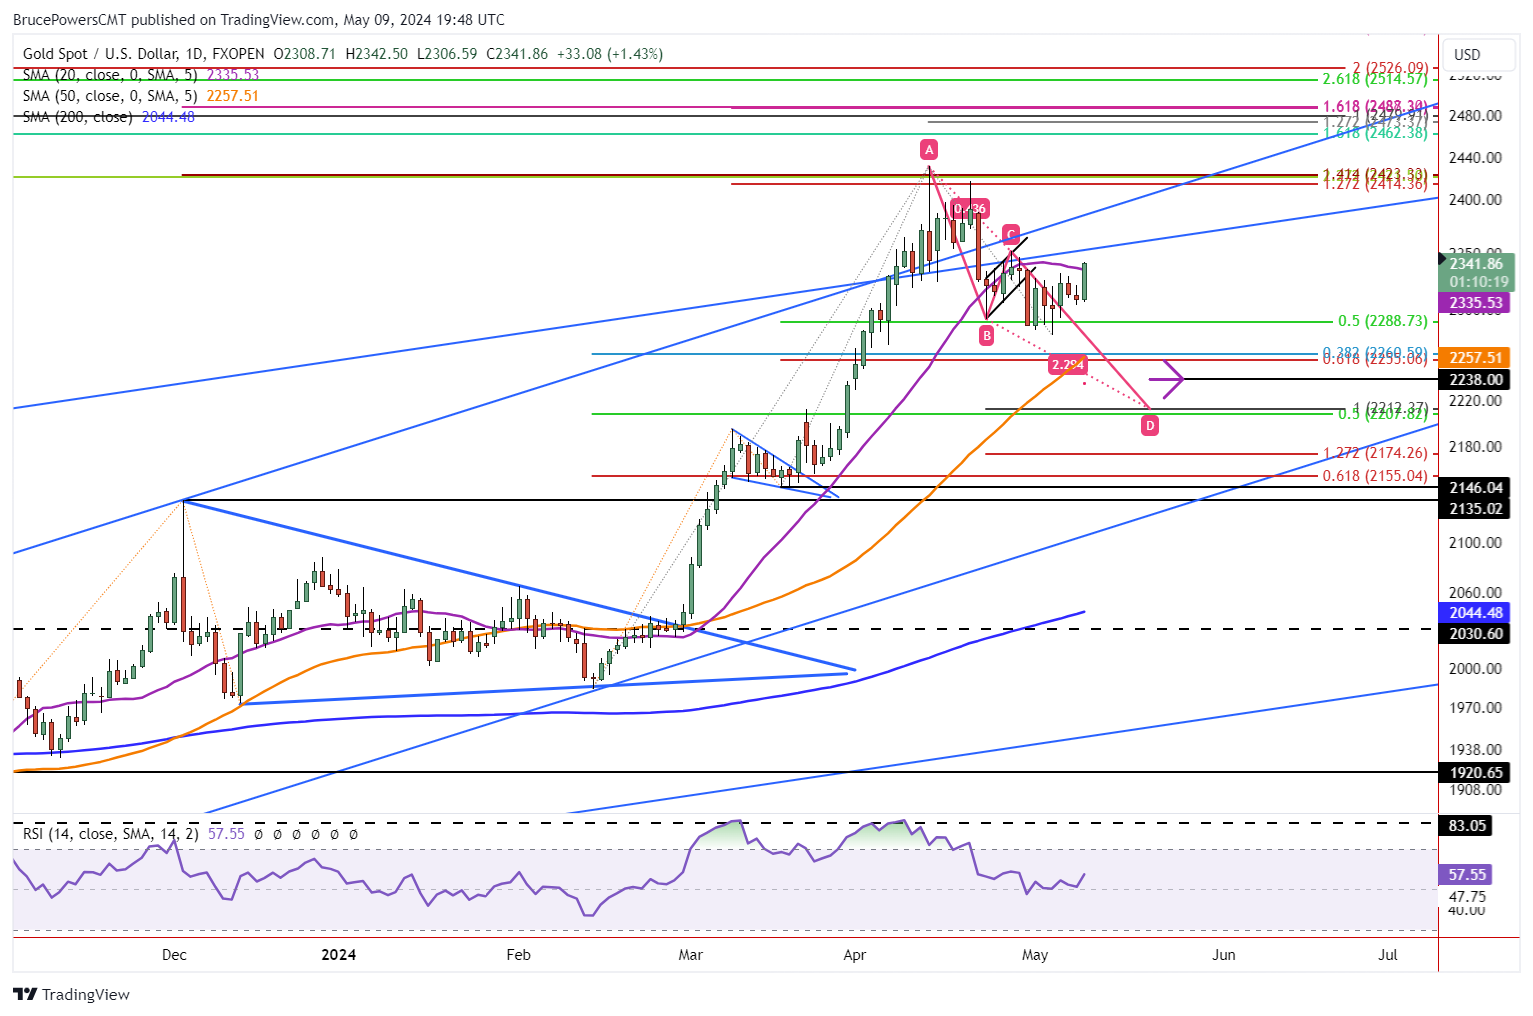
• A breakout above key resistance levels, including 2,347 and this week's high, could signal a sustained advance for gold, following its multi-year basing pattern breakout in March.
Gold showed strength today, rising to test resistance around the 20-Day MA with the day’s high of 2,342, at the time of this writing. That is an eight-day high for which it traded within a relatively tight range. Today’s high generates a new high for the consolidation range. Although it is a sign of short-term strength, it doesn’t change the near-term outlook. A daily close above the 20-Day MA at 2,335 would begin to do that. Also, after today’s session, a daily close above today’s high would also be a sign of strength that may lead to increased demand.
Testing Resistance
So, what happens next will be of interest. If gold moves above today’s high (also 20-Day MA), then higher prices may follow. But if today’s resistance holds and is followed by a pullback, a continuation of the retracement remains in play. Last week’s high of 2,347 is also an important near-term price level as a rally above it will trigger a bullish reversal in the weekly time frame. Currently, gold is set to complete this week as an inside week.
Therefore, starting next week a breakout above this week’s high would provide a bullish signal, keeping in mind that such a move would also exceed resistance around the 20-Day line. Buyers have regained control of silver following today’s rally above its 20-Day MA. This might be a warning that gold could be about to do the same. Price action will provide a guide.
Watching for Signs of Strength
Potential lower targets have been discussed in recent articles, so today let’s consider the upside potential. A decisive breakout above last week’s high of 2,347 will provide a bullish signal that could lead to higher prices, or above this week’s high once the week completes. Additional strength will be indicated on a rally above the most recent swing high on the daily chart at 2,352 (C). Once there is a daily close above the slightly higher level, the chance for a sustained advance improves.
Minor Retracement Shows Underlying Strength
When considering the larger picture. Gold broke out of a multi-year basing pattern in March and kept going until reaching the current record high of 2,431. If last week’s low of 2,277 is the completion of a retracement, it would reflect strong underlying demand for gold as buyers stepped up before a 38.2% Fibonacci retracement completed.
Read Full Story »»»
 DiscoverGold
Information posted to this board is not meant to suggest any specific action, but to point out the technical signs that can help our readers make their own specific decisions. Caveat emptor!
• DiscoverGold
Recent GLD News
- Form 10-Q - Quarterly report [Sections 13 or 15(d)] • Edgar (US Regulatory) • 05/08/2024 06:11:30 PM
- Form 10-Q - Quarterly report [Sections 13 or 15(d)] • Edgar (US Regulatory) • 02/08/2024 03:33:22 PM
- Form FWP - Filing under Securities Act Rules 163/433 of free writing prospectuses • Edgar (US Regulatory) • 01/19/2024 05:18:16 PM
- Crypto: RNDR, LINK, CHZ Emerge as Wednesday’s Top Performers, Ethereum Pilots Dencun Update, and More • IH Market News • 01/17/2024 04:51:44 PM
- Form 424I - • Edgar (US Regulatory) • 12/27/2023 04:04:08 PM
- Form FWP - Filing under Securities Act Rules 163/433 of free writing prospectuses • Edgar (US Regulatory) • 12/22/2023 09:02:08 PM
- Form 10-K - Annual report [Section 13 and 15(d), not S-K Item 405] • Edgar (US Regulatory) • 11/22/2023 07:49:08 PM
- Form FWP - Filing under Securities Act Rules 163/433 of free writing prospectuses • Edgar (US Regulatory) • 09/14/2023 02:12:55 PM
- Form 8-K - Current report • Edgar (US Regulatory) • 09/12/2023 08:02:07 PM
- Gold Stabilizes Near One-Month Highs as U.S. Interest Rate Hike Expectations • IH Market News • 08/31/2023 12:43:38 PM
- Gold Closes Higher, With Strong Retreat In Treasury Interest Rates And Dollar Low • IH Market News • 08/29/2023 06:20:49 PM
- Form 10-Q - Quarterly report [Sections 13 or 15(d)] • Edgar (US Regulatory) • 08/07/2023 06:55:27 PM
Avant Technologies Engages Wired4Tech to Evaluate the Performance of Next Generation AI Server Technology • AVAI • May 23, 2024 8:00 AM
Branded Legacy, Inc. Unveils Collaboration with Celebrity Tattoo Artist Kat Tat for New Tattoo Aftercare Product • BLEG • May 22, 2024 8:30 AM
"Defo's Morning Briefing" Set to Debut for "GreenliteTV" • GRNL • May 21, 2024 2:28 PM
North Bay Resources Announces 50/50 JV at Fran Gold Project, British Columbia; Initiates NI 43-101 Resources Estimate and Bulk Sample • NBRI • May 21, 2024 9:07 AM
Greenlite Ventures Inks Deal to Acquire No Limit Technology • GRNL • May 17, 2024 3:00 PM
Music Licensing, Inc. (OTC: SONG) Subsidiary Pro Music Rights Secures Final Judgment of $114,081.30 USD, Demonstrating Strength of Licensing Agreements • SONGD • May 17, 2024 11:00 AM

