


| Followers | 681 |
| Posts | 141613 |
| Boards Moderated | 35 |
| Alias Born | 03/10/2004 |
Tuesday, May 07, 2024 4:58:29 PM
By: Bruce Powers | May 7, 2024
• Gold remains in consolidation below key resistance levels, with a bearish flag pattern indicating potential for lower prices unless it rallies above recent highs.
Gold remains stuck in consolidation and has been trending sideways for the five days. Consolidation is occurring just below resistance represented by the purple 20-Day MA, currently at 2,330, and the 38.2% Fibonacci retracement at 2,322. The 38.2% price zone previously represented support and now resistance. Further, gold remains under a bear flag that triggered a sharp decline starting with a break below 2,320 last Tuesday. Since then, recent price action has done nothing to negate the potential for a deeper pullback and lower prices indicated by the breakdown of the flag.
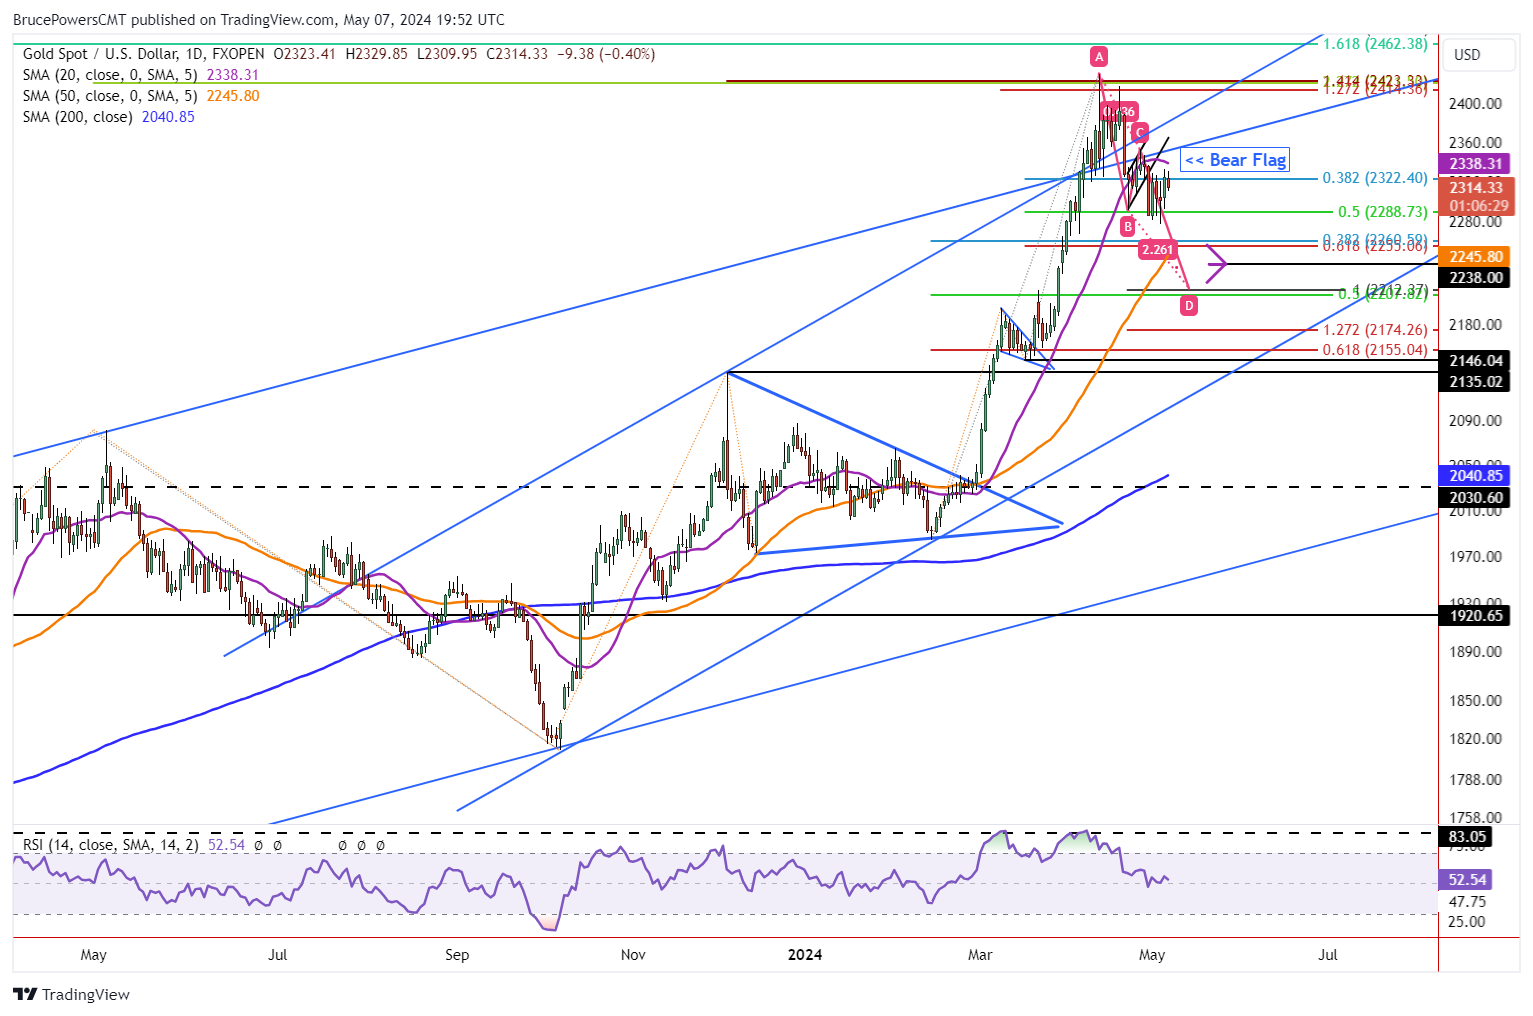
Bear Flag on Deck
The bear flag shows a small rising parallel trend channel. Each boundary line has three touches from price. There is symmetry represented in the pattern as the channel can be divided in half. In other words, it is a clear and solid pattern that has been broken. It shows a pause in the degree of selling that occurred prior to the flag’s formation. Therefore, a continuation lower is the most likely resolution and that has been indicated by the breakdown last week.
Nevertheless, a five-day pause below the breakdown level does not show selling pressure increasing. It leaves open the possibility of a failure of the bearish pattern. A failure would occur during an advance prior to new retracement lows. However, a rally above last week’s high of 2,347 would need to occur for signs of a failed bearish pennant.
Key Near-Term Support at 2,227
Support from the recent consolidation is at last week’s low of 2,227. The next bearish signal will be indicated on a drop below that price level. Calculating the measuring objective for the bear flag provides a minimum target of 2,238. However, the orange 50-Day MA has been rising as the price of gold consolidates. If it continues to consolidate for a while longer, the 50-Day line may join a slightly higher target zone from 2,261 to 2,255. If it does, the chance of hitting that price zone will increase. The 50-Day line is currently at 2,246.
There is also a lower potential target zone from around 2,212 to 2,208. However, last month’s low support was at 2,228. If this lower price zone is reached, then the monthly low would have been broken. A drop below a monthly low would diminish the current underlying bullishness that remains in the market.
Read Full Story »»»
 DiscoverGold
Information posted to this board is not meant to suggest any specific action, but to point out the technical signs that can help our readers make their own specific decisions. Caveat emptor!
• DiscoverGold
Recent GLD News
- Form 10-Q - Quarterly report [Sections 13 or 15(d)] • Edgar (US Regulatory) • 05/08/2024 06:11:30 PM
- Form 10-Q - Quarterly report [Sections 13 or 15(d)] • Edgar (US Regulatory) • 02/08/2024 03:33:22 PM
- Form FWP - Filing under Securities Act Rules 163/433 of free writing prospectuses • Edgar (US Regulatory) • 01/19/2024 05:18:16 PM
- Crypto: RNDR, LINK, CHZ Emerge as Wednesday’s Top Performers, Ethereum Pilots Dencun Update, and More • IH Market News • 01/17/2024 04:51:44 PM
- Form 424I - • Edgar (US Regulatory) • 12/27/2023 04:04:08 PM
- Form FWP - Filing under Securities Act Rules 163/433 of free writing prospectuses • Edgar (US Regulatory) • 12/22/2023 09:02:08 PM
- Form 10-K - Annual report [Section 13 and 15(d), not S-K Item 405] • Edgar (US Regulatory) • 11/22/2023 07:49:08 PM
- Form FWP - Filing under Securities Act Rules 163/433 of free writing prospectuses • Edgar (US Regulatory) • 09/14/2023 02:12:55 PM
- Form 8-K - Current report • Edgar (US Regulatory) • 09/12/2023 08:02:07 PM
- Gold Stabilizes Near One-Month Highs as U.S. Interest Rate Hike Expectations • IH Market News • 08/31/2023 12:43:38 PM
- Gold Closes Higher, With Strong Retreat In Treasury Interest Rates And Dollar Low • IH Market News • 08/29/2023 06:20:49 PM
- Form 10-Q - Quarterly report [Sections 13 or 15(d)] • Edgar (US Regulatory) • 08/07/2023 06:55:27 PM
Green Leaf Innovations, Inc. Engages Olayinka Oyebola & Co for Two-Year Audit • GRLF • May 28, 2024 8:30 AM
HealthLynked Introduces AI-Powered Chat Function to Enhance Healthcare Accessibility • HLYK • May 28, 2024 8:00 AM
Avant Technologies Engages Wired4Tech to Evaluate the Performance of Next Generation AI Server Technology • AVAI • May 23, 2024 8:00 AM
Branded Legacy, Inc. Unveils Collaboration with Celebrity Tattoo Artist Kat Tat for New Tattoo Aftercare Product • BLEG • May 22, 2024 8:30 AM
"Defo's Morning Briefing" Set to Debut for "GreenliteTV" • GRNL • May 21, 2024 2:28 PM
North Bay Resources Announces 50/50 JV at Fran Gold Project, British Columbia; Initiates NI 43-101 Resources Estimate and Bulk Sample • NBRI • May 21, 2024 9:07 AM

