


| Followers | 689 |
| Posts | 143817 |
| Boards Moderated | 35 |
| Alias Born | 03/10/2004 |
Wednesday, November 13, 2019 3:24:49 PM
By: Tim Ord | November 13, 2019
* (Click Read Full Story »»» at the bottom of the page for the charts to appear on the post)
SPX Monitoring purposes: Flat.
Monitoring purposes GOLD: Long GDX on 1/29/19 at 21.96.
Long Term Trend SPX monitor purposes: Sold long-term SPX on 10/24/19 at 3010.29=gain 1.49%; Long SPX on 10/14/19 at 2966.15.
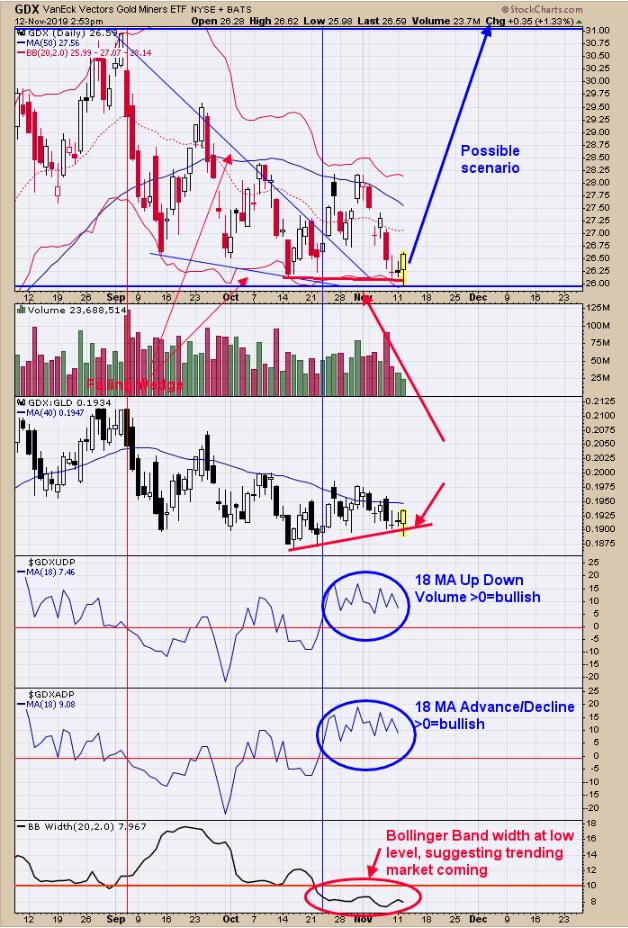
We updated this chart from yesterday. Yesterday, we said that “[t]he two important indicators on this chart are the 18 average of the GDX Up Down Volume Percent and 18 average GDX Advance/Decline percent (second and third window up from bottom). Since October 23 (GDX close 26.81) the 18 moving averages of GDX Up Down Volume and Advance/Decline have been staying above '0' which have been bullish for GDX in the past. GDX has tested the mid October lows but both indicators remain bullish with readings above '0'. The bottom window is the Bollinger Bandwidth which has stayed below '10' for an extended time, suggesting market is not far from an impulse wave. Middle window is the GDX/GLD ratio. This ratio is making higher lows while GDX has made lower lows, showing that GDX/GLD ratio is stronger than GDX and a bullish sign.” With these bullish indicators, it appears that GDX impulse wave could start at any time. Long GDX on 1/29/19 at 21.97.
Tim Ord,
Editor
Read Full Story »»»
 DiscoverGold
 Click on "In reply to", for Authors past commentaries
Information posted to this board is not meant to suggest any specific action, but to point out the technical signs that can help our readers make their own specific decisions. Your Due Dilegence is a must!
• DiscoverGold
Recent GDX News
- YieldMax GDXY Name Change • GlobeNewswire Inc. • 01/25/2024 04:22:00 PM
VHAI - Vocodia Partners with Leading Political Super PACs to Revolutionize Fundraising Efforts • VHAI • Sep 19, 2024 11:48 AM
Dear Cashmere Group Holding Co. AKA Swifty Global Signs Binding Letter of Intent to be Acquired by Signing Day Sports • DRCR • Sep 19, 2024 10:26 AM
HealthLynked Launches Virtual Urgent Care Through Partnership with Lyric Health. • HLYK • Sep 19, 2024 8:00 AM
Element79 Gold Corp. Appoints Kevin Arias as Advisor to the Board of Directors, Strengthening Strategic Leadership • ELMGF • Sep 18, 2024 10:29 AM
Mawson Finland Limited Further Expands the Known Mineralized Zones at Rajapalot: Palokas step-out drills 7 metres @ 9.1 g/t gold & 706 ppm cobalt • MFL • Sep 17, 2024 9:02 AM
PickleJar Announces Integration With OptCulture to Deliver Holistic Fan Experiences at Venue Point of Sale • PKLE • Sep 17, 2024 8:00 AM

