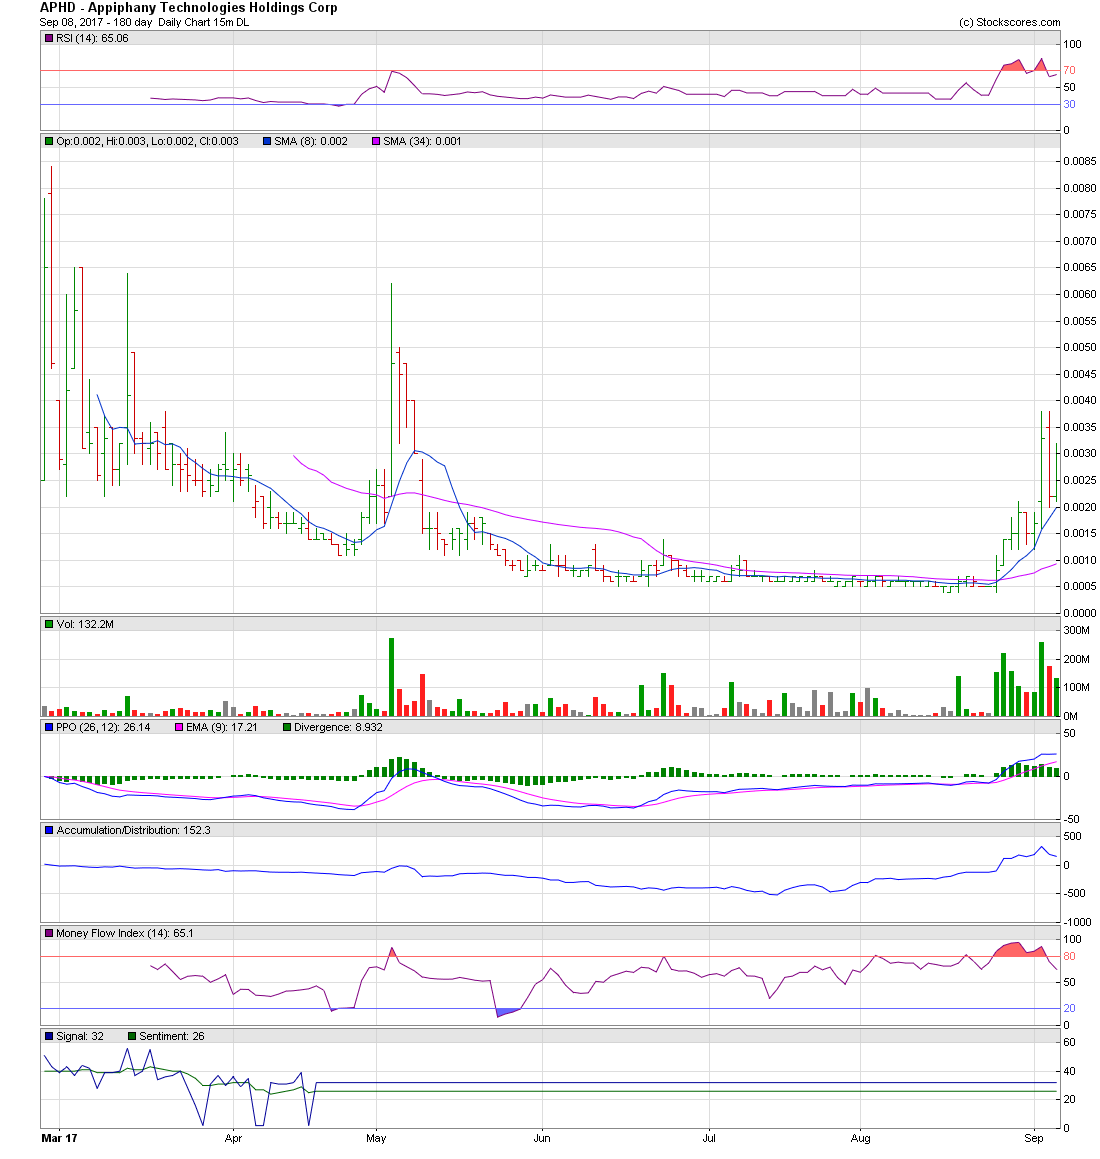
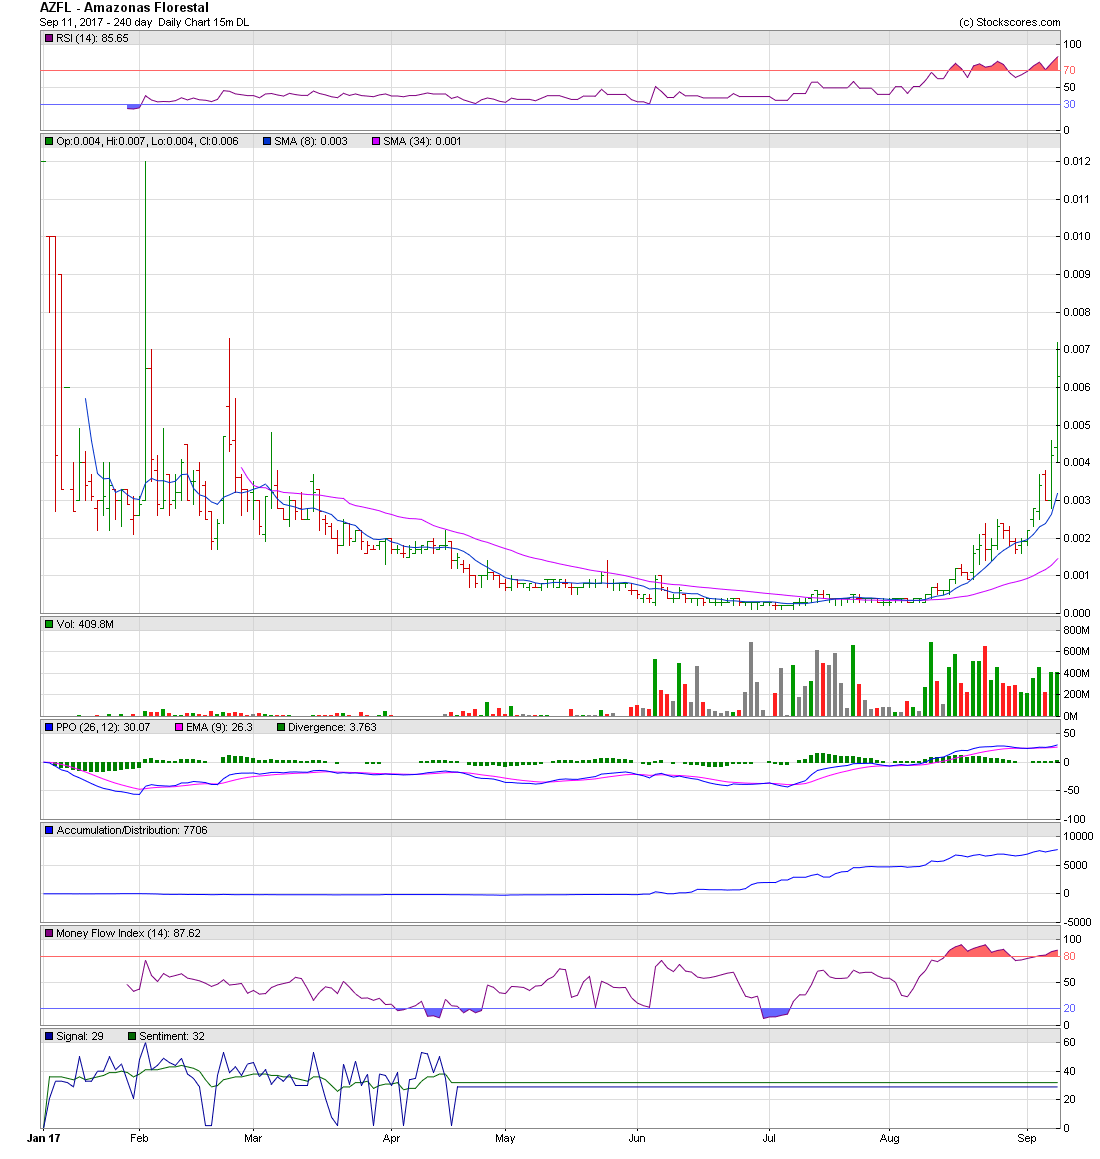
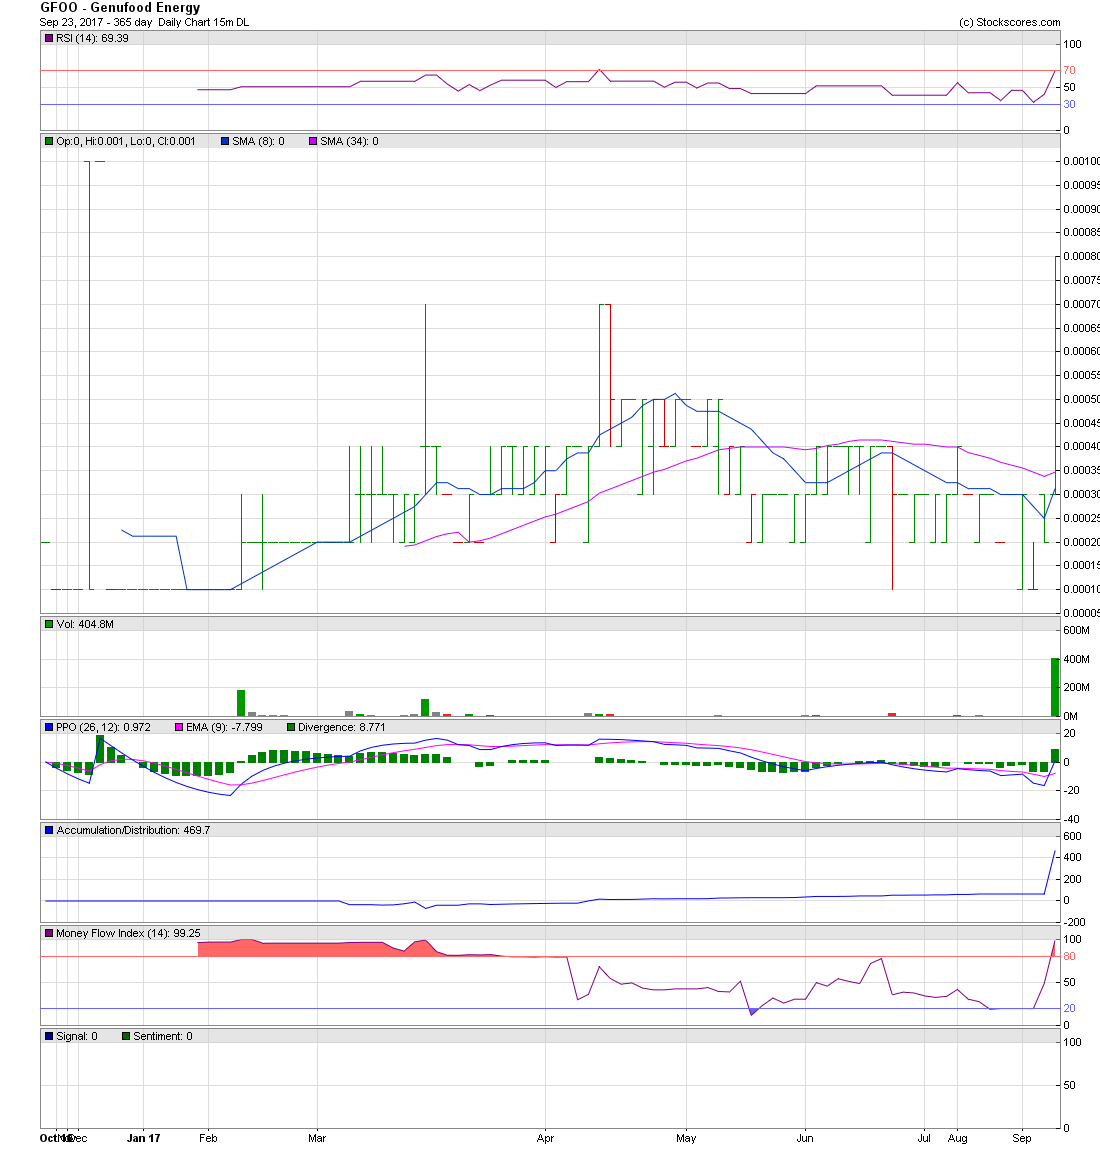
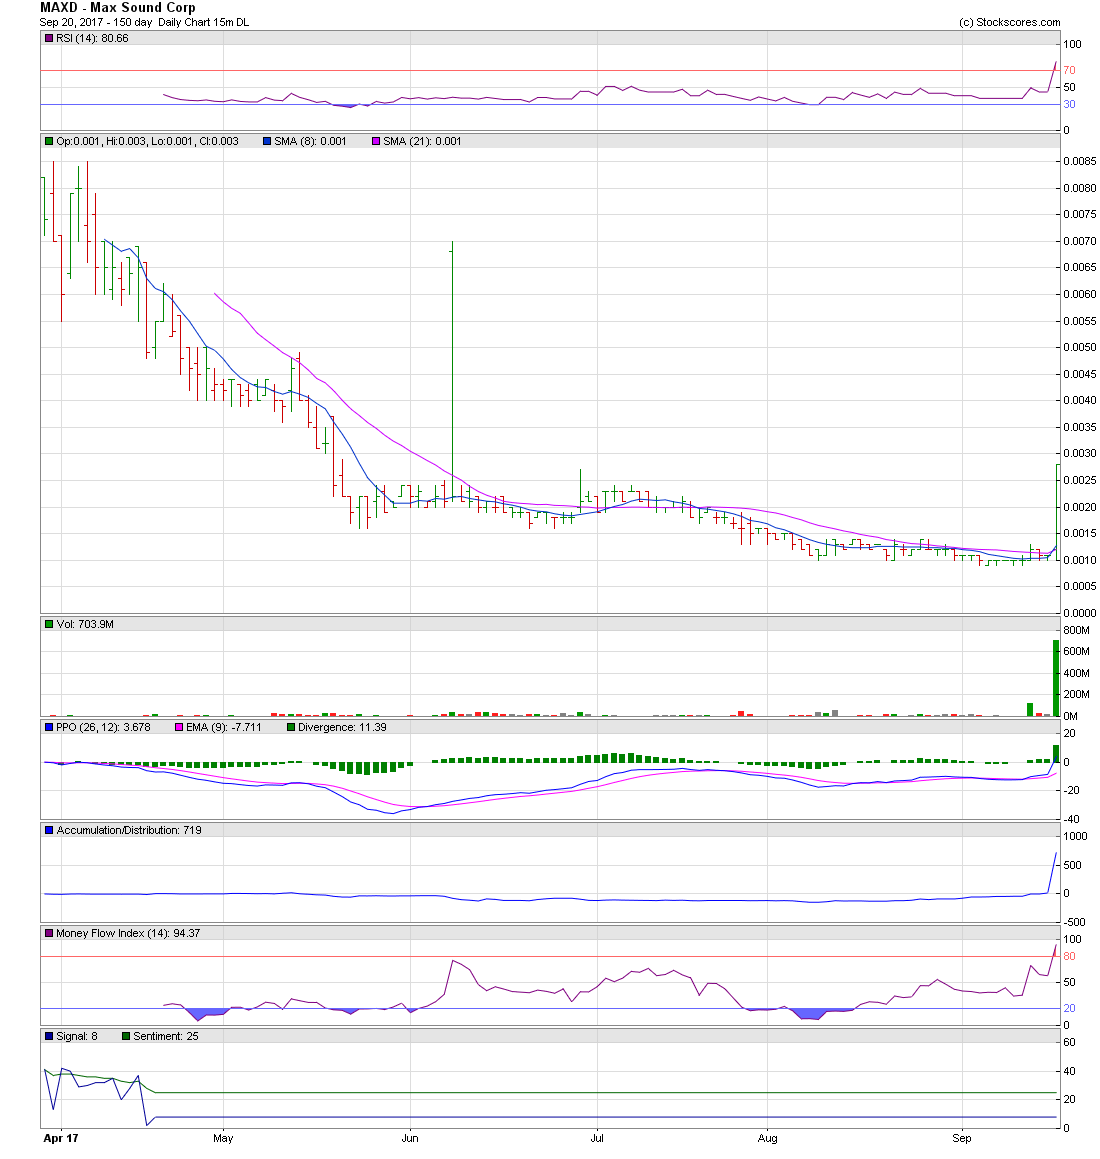
How Our Scans Can Make You Money! Our Scans will Alert You of stocks to BUY, before the Run happens! _______________________________________________________________ We'll Alert You to Stocks to BUY, before the Run happens! APHD - Alerted at 0.0006 Climbs to 0.0037 https://investorshub.advfn.com/boards/read_msg.aspx?message_id=134504241&txt2find=APHD https://investorshub.advfn.com/boards/read_msg.aspx?message_id=134463852 AZFL - Alerted at 0.0003 Climbs to 0.0072 https://investorshub.advfn.com/boards/read_msg.aspx?message_id=134535526&txt2find=AZFL https://investorshub.advfn.com/boards/read_msg.aspx?message_id=134503477 GFOO - Alerted at 0.0002 Climbs to 0.0008 https://investorshub.advfn.com/boards/read_msg.aspx?message_id=134846220&txt2find=GFOO https://investorshub.advfn.com/boards/read_msg.aspx?message_id=134846233 HAON - Alerted at 0.0002 Climbs to 0.0008 https://investorshub.advfn.com/boards/read_msg.aspx?message_id=134504228&txt2find=HAON https://investorshub.advfn.com/boards/read_msg.aspx?message_id=133787557 MAXD - Alerted at 0.0010 Climbs to 0.0028 https://investorshub.advfn.com/boards/read_msg.aspx?message_id=134752161&txt2find=MAXD https://investorshub.advfn.com/boards/read_msg.aspx?message_id=134752140 ________________________________________________________________ Embedded Charts https://investorshub.advfn.com/uimage/uploads/2017/9/8/cghcyAPHD_Sept_8_Chart_1.png https://investorshub.advfn.com/uimage/uploads/2017/9/11/snuzcAZFL_Sept_11_Chart_1.png https://investorshub.advfn.com/uimage/uploads/2017/9/23/luumaGFOO_Sept_22_Chart_2.png https://investorshub.advfn.com/uimage/uploads/2017/8/10/iyeqxHAON_August_9_Chart_2.png https://investorshub.advfn.com/uimage/uploads/2017/9/20/uzonsMAXD_Sept_19_Chart_2.png _________________________________________________________________ Live! Charts https://www.stockscores.com/chart.asp?TickerSymbol=APHD&TimeRange=180&Interval=d&Volume=1&ChartType=OHLC&Stockscores=1&ChartWidth=1100&ChartHeight=480&LogScale=None&Band=None&avgType1=SMA&movAvg1=8&avgType2=SMA&movAvg2=34&Indicator1=RSI&Indicator2=PPO&Indicator3=AccDist&Indicator4=MFI&endDate=&CompareWith=&entryPrice=&stopLossPrice= https://www.stockscores.com/chart.asp?TickerSymbol=AZFL&TimeRange=180&Interval=d&Volume=1&ChartType=OHLC&Stockscores=1&ChartWidth=1100&ChartHeight=480&LogScale=None&Band=None&avgType1=SMA&movAvg1=8&avgType2=SMA&movAvg2=34&Indicator1=RSI&Indicator2=PPO&Indicator3=AccDist&Indicator4=MFI&endDate=&CompareWith=&entryPrice=&stopLossPrice= https://www.stockscores.com/chart.asp?TickerSymbol=GFOO&TimeRange=720&Interval=w&Volume=1&ChartType=OHLC&Stockscores=1&ChartWidth=1100&ChartHeight=480&LogScale=None&Band=None&avgType1=SMA&movAvg1=8&avgType2=SMA&movAvg2=34&Indicator1=RSI&Indicator2=PPO&Indicator3=AccDist&Indicator4=MFI&endDate=&CompareWith=&entryPrice=&stopLossPrice= https://www.stockscores.com/chart.asp?TickerSymbol=HAON&TimeRange=365&Interval=d&Volume=1&ChartType=OHLC&Stockscores=1&ChartWidth=1100&ChartHeight=480&LogScale=None&Band=None&avgType1=SMA&movAvg1=8&avgType2=SMA&movAvg2=34&Indicator1=RSI&Indicator2=PPO&Indicator3=AccDist&Indicator4=MFI&endDate=&CompareWith=&entryPrice=&stopLossPrice= https://www.stockscores.com/chart.asp?TickerSymbol=MAXD&TimeRange=180&Interval=d&Volume=1&ChartType=OHLC&Stockscores=1&ChartWidth=1100&ChartHeight=480&LogScale=None&Band=None&avgType1=SMA&movAvg1=8&avgType2=SMA&movAvg2=34&Indicator1=RSI&Indicator2=PPO&Indicator3=AccDist&Indicator4=MFI&endDate=&CompareWith=&entryPrice=&stopLossPrice=
 News
News  Market Data
  Discover