The mean-reversion trader would wait for RSI(5) to dip below 30 and then move back above 30.
The green vertical lines show this system in action with the last buy signal on August 4th and sell signal on October 9th.
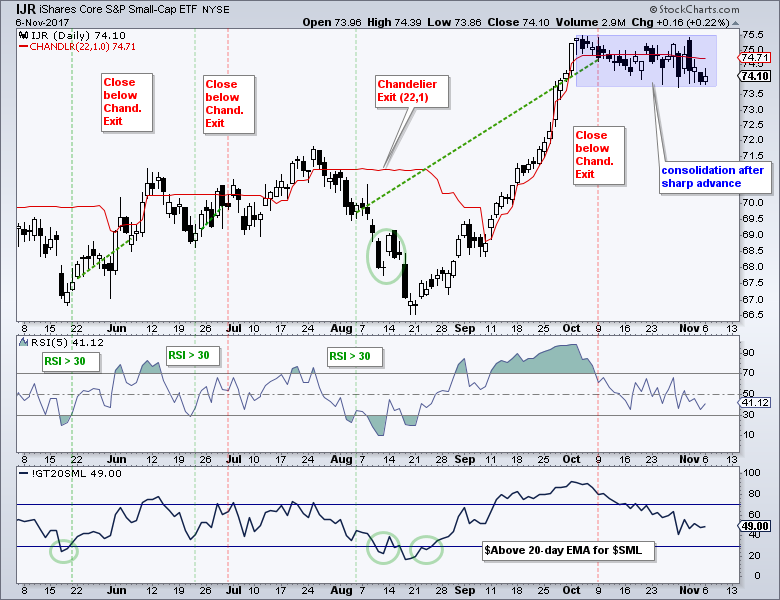
A sell signal triggers with a close below the Chandelier Exit.
There is no stop-loss for this system, which you can read about in this System Trader article. Currently, RSI(5) dipped below 40, but has yet to dip below 30 to initialize a bullish setup. Indicators, settings and systems are not perfect. Sometimes IJR starts its rebound without RSI(5) dipping below 30 and sometimes IJR continues lower even after a signal.
The lower indicator window shows Small-Cap %Above 200-day EMA (!GT200SML) with horizontal lines at 30% and 70%. A dip below 30% signals a short-term oversold condition and a subsequent upturn above 30% trigger a bullish signal. There have been three signals in the past six months (green circles).
Register for free to join our community of investors and share your ideas. You will also get access to streaming quotes, interactive charts, trades, portfolio, live options flow and more tools.
 News
News  Market Data
  Discover