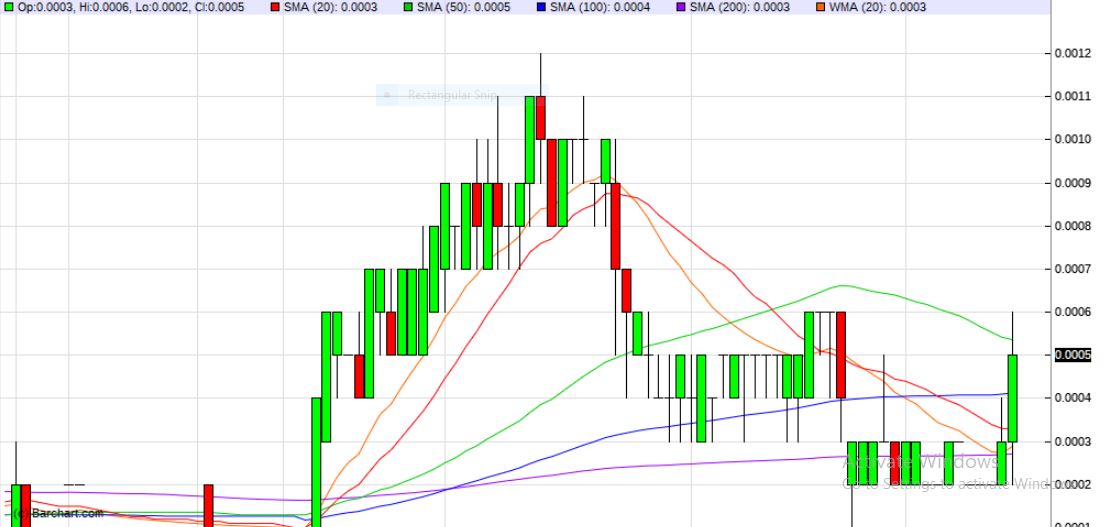
GRDO chart stayed above the 200dma broke thru the 100 and the 50dma currently just under the 50dma. Stock is strong, very bullish activity here in the last 2 trading days. Gap filled between .0003 & .0004 ready to move. Indicators all charged up showing money flow into the stock.
Register for free to join our community of investors and share your ideas. You will also get access to streaming quotes, interactive charts, trades, portfolio, live options flow and more tools.
 News
News  Market Data
  Discover