


Monday, October 16, 2017 2:50:52 PM
Indicators all charged up showing money flow into the stock.
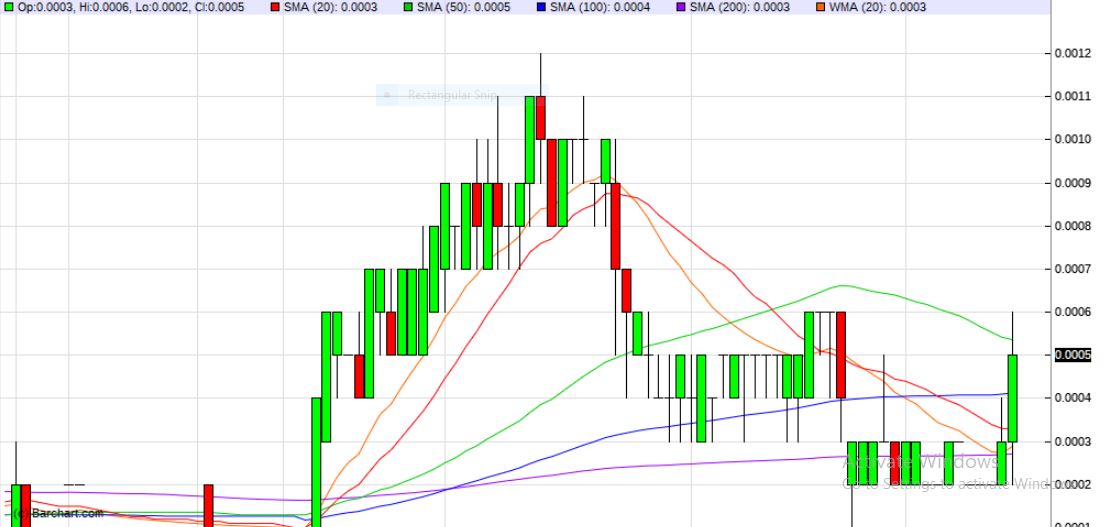
https://www.barchart.com/stocks/quotes/GRDO/technical-chart?plot=CANDLE&volume=total&data=DO&density=M&pricesOn=1&asPctChange=0&logscale=0&indicators=SMA(20);SMA(50);SMA(100);SMA(200);OBV;SMACD(12,26,9);MFI(14,100);STOFA(14,3);RSI(14,100);WMA(20);MOMENT(20);IV(16750848)&sym=GRDO&grid=1&height=500&studyheight=100

Bantec Reports an Over 50 Percent Increase in Sales and Profits in Q1 2024 from Q1 2023 • BANT • Apr 25, 2024 10:00 AM
Cannabix's Breath Logix Alcohol Device Delivers Positive Impact to Private Monitoring Agency in Montana, USA • BLO • Apr 25, 2024 8:52 AM
Kona Gold Beverages, Inc. Announces Name Change to NuVibe, Inc. and Initiation of Ticker Symbol Application Process • KGKG • Apr 25, 2024 8:30 AM
Axis Technologies Group and Carbonis Forge Ahead with New Digital Carbon Credit Technology • AXTG • Apr 24, 2024 3:00 AM
North Bay Resources Announces Successful Equipment Test at Bishop Gold Mill, Inyo County, California • NBRI • Apr 23, 2024 9:41 AM
Epazz, Inc.: CryObo, Inc. solar Bitcoin operations will issue tokens • EPAZ • Apr 23, 2024 9:20 AM

