


| Followers | 2 |
| Posts | 1540 |
| Boards Moderated | 0 |
| Alias Born | 05/06/2017 |
Thursday, September 14, 2017 5:16:25 PM
Q2, 2017 By the Numbers.
http://www.capitalcube.com/blog/index.php/capstone-cos-inc-capc-us-earnings-analysis-q2-2017-by-the-numbers-september-13-2017/?yptr=yahoo
Highlights
Summary numbers: Revenues of USD 10.22 million, Net Earnings of USD 0.90 million.
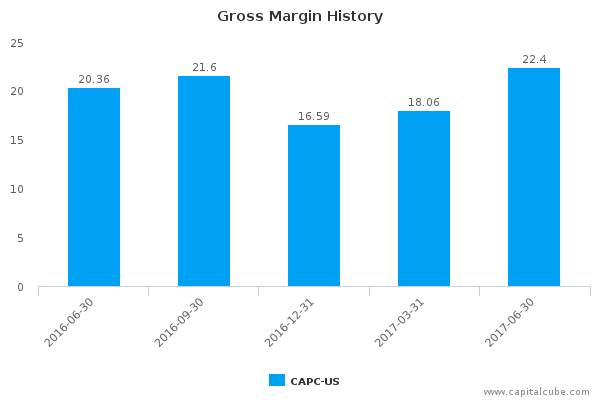
Gross margins widened from 20.36% to 22.40% compared to the same period last year, operating (EBITDA) margins now 13.27% from 13.20%.
Change in operating cash flow of 106.54% compared to same period last year is about the same as change in earnings, likely no significant movement in accruals or reserves.
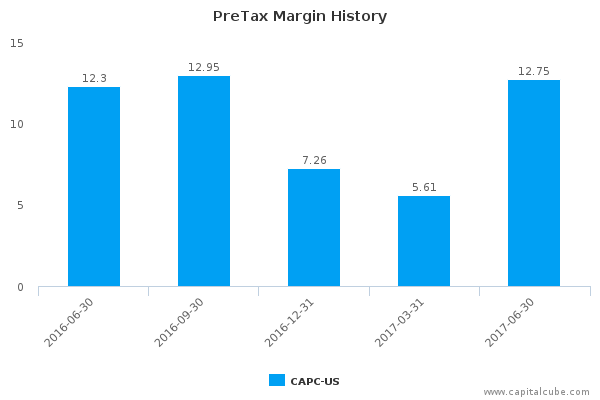
Earnings decline largely a result of non-operational activity, pretax margins improved from 12.30% to 12.75%.
The table below shows the preliminary results and recent trends for key metrics such as revenues and net income growth:
Relevant Numbers (Quarterly)
2017-06-30 2017-03-31 2016-12-31 2016-09-30 2016-06-30
Revenues (mil) 10.22 6.75 7.96 11.69 8.9
Revenue Growth (%YOY) 14.8 224.9 10.94 50.92 2969.89
Earnings (mil) 0.9 0.25 0.35 1.49 1.08
Earnings Growth (%YOY) -16.71 353.39 -36.49 19.44 253.49
Net Margin (%) 8.82 3.71 4.37 12.74 12.16
EPS 0.02 0.01 0.01 0.03 0.02
Return on Equity (%) 15.86 4.81 7.01 36.99 39.71
Return on Assets (%) 34.7 9.96 11 43.59 51.41
Market Share Versus Profits
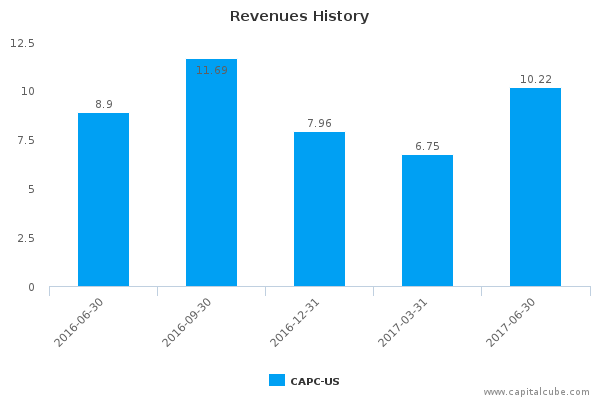
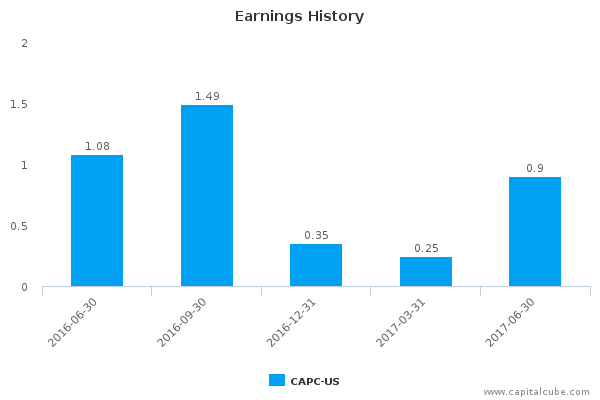
Compared to the same period last year, CAPC-US‘s change in revenue was close to the amount of its change in earnings. It remains to be seen how the rest of its peer group’s results will turn out and if CAPC-US‘s performance is a sign of any major shift in the composition of market share in this sector. Also, for comparison purposes, revenues changed by 51.35% and earnings by 259.57% compared to the previous period.
Earnings Growth Analysis
The company’s year-on-year earnings decline did not come as a result of a contraction in gross margins or because of any cost control issues. Both gross margins and operating margins (EBITDA) margins actually improved over this time frame. Gross margins went from 20.36% to 22.40%, while operating margins improved from 13.20% to 13.27% over this period. For comparison, gross margins were 18.06% and EBITDA margins 6.00% in the immediate last period.
Gross Margin Trend
Companies sometimes sacrifice improvements in revenues and margins in order to extend friendlier terms to customers and vendors. Capital Cube probes for such activity by comparing the changes in gross margins with any changes in working capital. If the gross margins improved without a worsening of working capital, it is possible that the company’s performance is a result of truly delivering in the marketplace and not simply an accounting prop-up using the balance sheet.
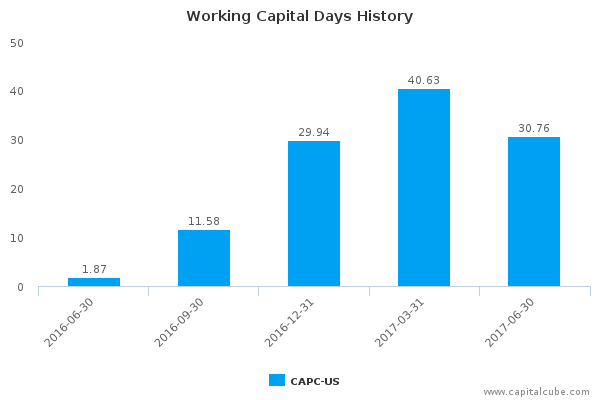
CAPC-US‘s gross margin improvement has not produced any big difference in its working capital. Working capital days are currently 30.76, compared to last year’s level of 1.87 days. This leads Capital Cube to conclude that the improvements in gross margins are likely from operating decisions and not trade-offs with the balance sheet.
Cash Versus Earnings – Sustainable Performance?
It is important to examine a company�s cash versus earnings numbers to gauge whether its performance is sustainable.
CAPC-US‘s year-on-year change in operating cash flow of 106.54% is around its change in earnings. This suggests that there are likely no significant movement in accruals or reserves for managing earnings this period.
Margins
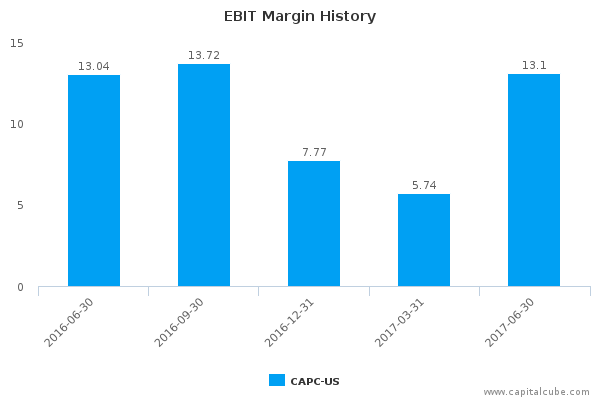
The company’s earnings decline is largely a result of non-operational activity. As a matter of fact, the company showed increases in operating (EBIT) and pretax margins. EBIT margins improved from 13.04% to 13.10% and pretax margins widened from 12.30% to 12.75%.
Company Profile
Capstone Cos., Inc. operates as a holding company, which designs and manufactures a line of specialty power failure lighting solutions and other specialty consumer products. Its product includes the power failure products, and safety and security products. The company was founded on September 18, 1986 and is headquartered in Deerfield Beach, FL.
---------------------------------------------------------------------------------------------------------
https://online.capitalcube.com/#!/stock/US/US%20OTC/CAPC
Overview
It trades at a lower Price/Book multiple (3.55) than its peer median (4.55).
CAPC-US outperforms its peers with a relatively high operating performance and the market also expects faster growth relative to its peers
CAPC-US has a successful operating model with relatively high net profit margins and asset turns.
The company's year-on-year change in revenues and earnings are better than the median among its peer group.
CAPC-US's return on assets currently and over the past five years suggest that its relatively high operating returns are sustainable.
The company's relatively high gross and pre-tax margins suggest a differentiated product portfolio and tight control on operating costs relative to peers.
Compared with the peers chosen, CAPC-US has had faster revenue growth in prior years and a current P/E ratio that suggests faster growth in the future suggesting superior growth expectations.
The company's level of capital investment is relatively low and suggests it is milking the business.
CAPC-US has the financial and operating capacity to borrow quickly.
Recent CAPC News
- Form 10-Q - Quarterly report [Sections 13 or 15(d)] • Edgar (US Regulatory) • 11/14/2023 04:55:51 PM
- Form 10-Q - Quarterly report [Sections 13 or 15(d)] • Edgar (US Regulatory) • 08/14/2023 07:14:52 PM
- Form 8-K - Current report • Edgar (US Regulatory) • 07/03/2023 06:12:39 PM
NanoViricides Reports that the Phase I NV-387 Clinical Trial is Completed Successfully and Data Lock is Expected Soon • NNVC • May 2, 2024 10:07 AM
ILUS Files Form 10-K and Provides Shareholder Update • ILUS • May 2, 2024 8:52 AM
Avant Technologies Names New CEO Following Acquisition of Healthcare Technology and Data Integration Firm • AVAI • May 2, 2024 8:00 AM
Bantec Engaged in a Letter of Intent to Acquire a Small New Jersey Based Manufacturing Company • BANT • May 1, 2024 10:00 AM
Cannabix Technologies to Deliver Breath Logix Alcohol Screening Device to Australia • BLO • Apr 30, 2024 8:53 AM
Hydromer, Inc. Reports Preliminary Unaudited Financial Results for First Quarter 2024 • HYDI • Apr 29, 2024 9:10 AM

