4th-Longest S&P 500 Streak of Days Without A 5% Drawdown Continues By: Bespoke | September 8, 2017
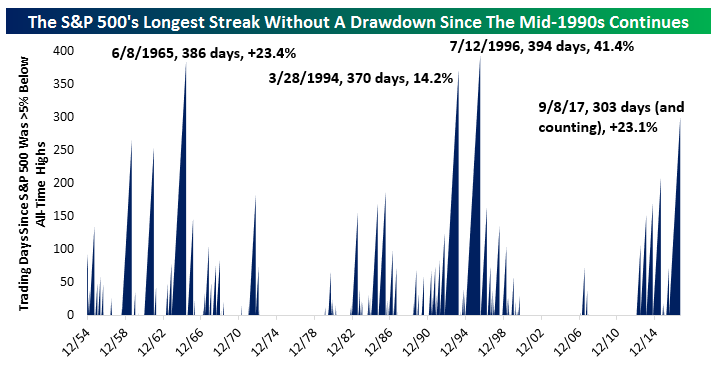
While the S&P 500 is a bit less than 1% from all-time highs and hasn’t made a new high in a month, the current drawdown is extremely small by historical standards. In the chart below, we show streaks of days where the benchmark index has avoided a decline from all-time highs of at least 5%. Each streak starts the day the index gets back within 5% of all-time highs after declining from them. During the current bull market, there have been a number of such declines, most recently around the Brexit vote in June of last year. Since then, however, the index hasn’t moved down more than 5% from record highs. That streak of 303 trading days and counting is the 4th-longest on record, matched only by streaks ending in 1965, 1994, and 1996. It’s worth noting that long streaks without large declines don’t necessarily result in huge gains; for instance, the 1994 streak saw a 14.2% gain. The 1965 streak lasted 4 months longer than the current one but only resulted in gains slightly better than the current streak’s 23.1% move higher.
Information posted to this board is not meant to suggest any specific action, but to point out the technical signs that can help our readers make their own specific decisions. Your Due Dilegence is a must! • DiscoverGold
Register for free to join our community of investors and share your ideas. You will also get access to streaming quotes, interactive charts, trades, portfolio, live options flow and more tools.


 News
News  Market Data
  Discover