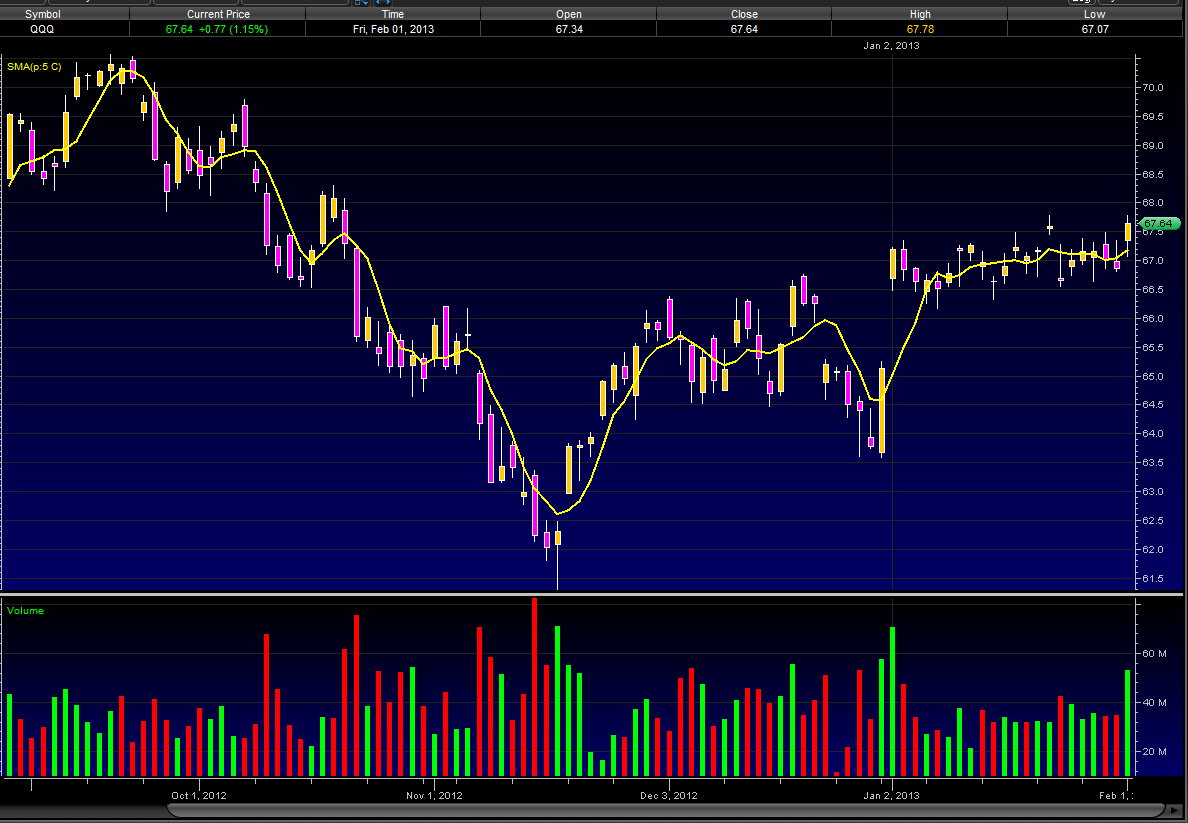
Simple Moving Average or (SMA) The SMA does not predict the price direction but it smooths out the price action to give a trend indication. Moving averages are lagging indicators because they are based on past prices. Despite this lag, moving averages help smooth price action and filter out the noise. They are also used to form the building blocks for many other technical indicators and overlays, such as Bollinger Bands, MACD and the McClellan Oscillator. Moving averages can be used to identify the direction of the trend or define potential support and resistance levels. Here's a chart with a 5 day SMA on it: A simple moving average is made by calculating the average price of a security over a specific number of closing costs. The SMA will reflect the average closing cost, based on the time line of the chart you are looking at. i.e.: A 5 SMA on a daily chart will plot a line showing the average closing daily price, on a 60 minute chart that 5 SMA will plot a line showing the average hourly closing price. If the closing price changes so too does the SMA, hence the Moving part of Simple Moving Average. Old data is dropped and new data is added as it comes and goes, making the average move along the timeline. For those who need a visual take a look at how a SMA is plotted. We will start our SMA on day 5
Daily Closing Prices: Day 1 ------ 10 Day 2 ------ 12 Day 3 ------ 11 Day 4 ------ 14 Day 5 ------ 13 Day 6 ------ 15 Day 7 ------ 18 Day 8 ------ 19
SMA Plot points: Day 5 ---- 10 12 11 14 13(closing price each day, 1 through 5) = 60 /5(# of days) = SMA of 12 Day 6 ---- Drop the 10 from day 1 and add the 15 from day 6 = 65 /5 = 13 Day 7 ---- Drop the 12 from day 2 and add 18 from day 7 = 71 /5 = 14.2 Day 8 ---- Drop the 11 from day 3 and add 19 from day 8 = 79 /5 = 15.8
Register for free to join our community of investors and share your ideas. You will also get access to streaming quotes, interactive charts, trades, portfolio, live options flow and more tools.


 News
News  Market Data
  Discover