


Tuesday, August 08, 2017 4:58:14 PM
Analysis:
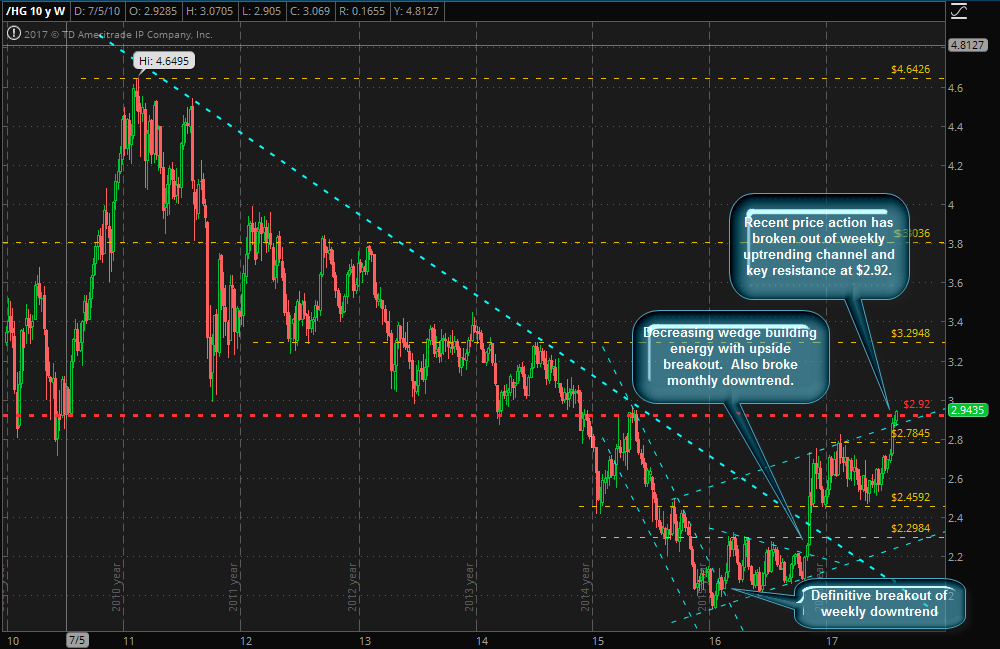
1. We witnessed a definitive breakout of the weekly downtrend back on 2/22/16. This was a strong indicator that the previous bear market in copper was ending and switching over to a bull market.
2. A decreasing wedge developed from March to October of 2016. Decreasing wedges indicate that energy is building in the price movement. Think of a coiled spring. When a breakout does occur, it typically does so dramatically releasing the stored energy. Sure enough, when it broke to the upside at the beginning of November 2016, it did so with a vengeance.
3. I had drawn the price support/resistance line at 2.4592 before Cu made its move back in Oct-Nov 2016. It is interesting to note that this line became support after copper broke out of the previous trading range. The price has come down and tested this line three times since breaking out. Classic case of previous resistance becoming new support.
4. Weekly copper is now trading in a broad positive sloping channel. Recent price action has recently broken through the top of the channel and a key resistance level of 2.92. I consider this a very bullish signal. It's not to say it won't take a couple of passes up and down through before it moves on up. But, IMO, it sets the stage for a positive move up over the course of the next year.
PG
Avant Technologies Equipping AI-Managed Data Center with High Performance Computing Systems • AVAI • May 10, 2024 8:00 AM
VAYK Discloses Strategic Conversation on Potential Acquisition of $4 Million Home Service Business • VAYK • May 9, 2024 9:00 AM
Bantec's Howco Awarded $4.19 Million Dollar U.S. Department of Defense Contract • BANT • May 8, 2024 10:00 AM
Element79 Gold Corp Successfully Closes Maverick Springs Option Agreement • ELEM • May 8, 2024 9:05 AM
Kona Gold Beverages, Inc. Achieves April Revenues Exceeding $586,000 • KGKG • May 8, 2024 8:30 AM
Epazz plans to spin off Galaxy Batteries Inc. • EPAZ • May 8, 2024 7:05 AM

